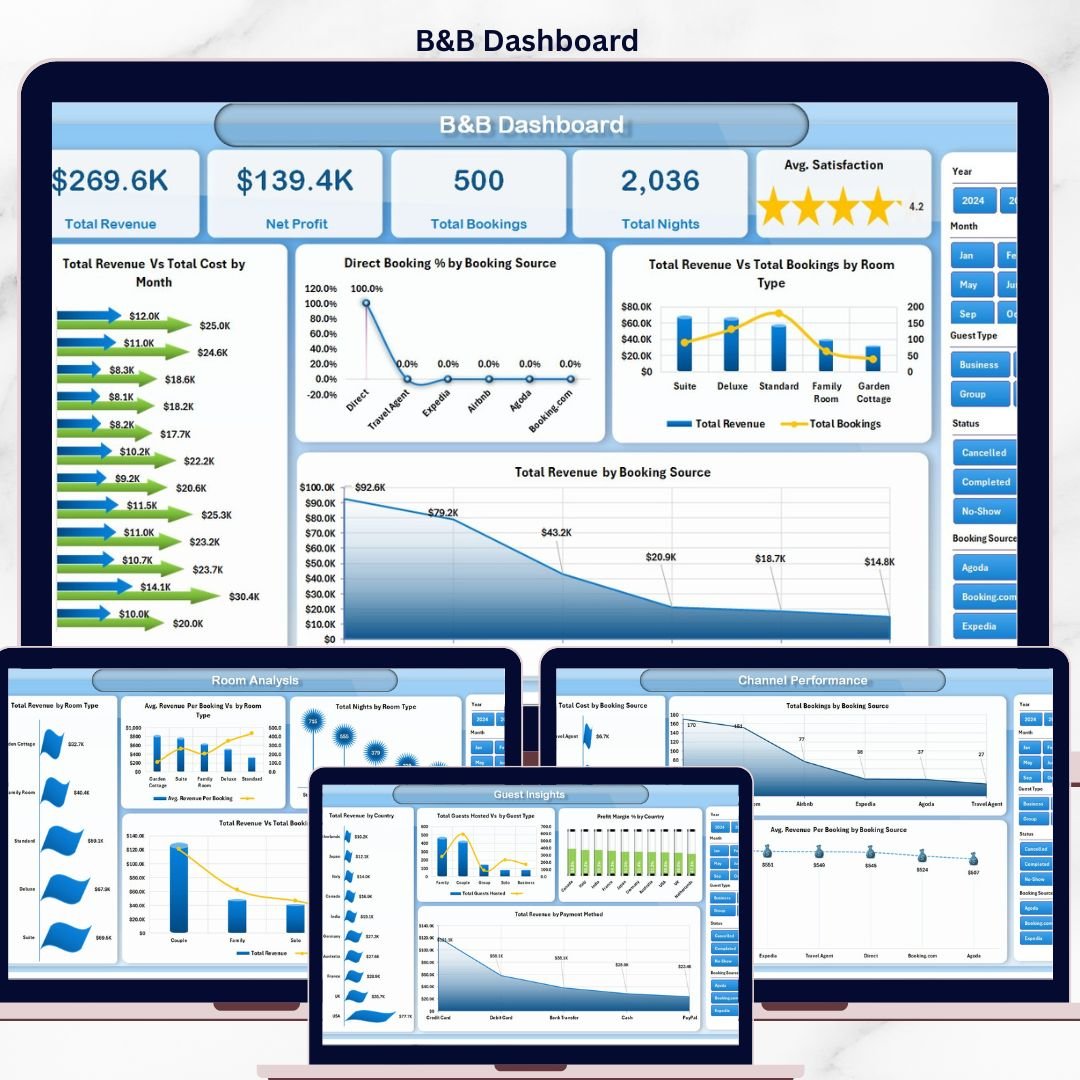


The B&B Dashboard in Excel tracks 5 high-level KPIs and 19 pivot-driven charts across 5 interactive pages, with multiple slicers for booking source, room type, guest type, country, and payment method. Setup takes under 10 minutes — paste your reservations into the Data Sheet, click Refresh All, and every chart, KPI card, and pivot updates automatically. This is built specifically for independent bed-and-breakfast owners and small-inn operators who need clear booking, revenue, and channel analytics without a $70+ per-month property management subscription.
🌍 Join 8,400+ teams in 40+ countries using NextGenTemplates to replace paid SaaS tools with one-time-purchase Excel, Google Sheets, Power BI, and HTML templates.
✅ Instant download · One-time payment · No subscription · No per-user fees · Lifetime access
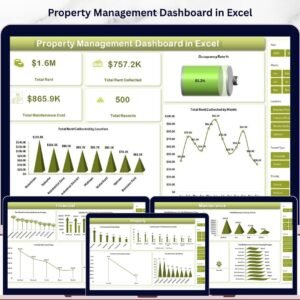
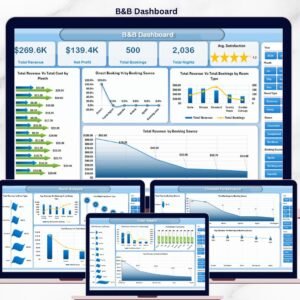
B&B Dashboard in Excel — Overview Page
Key Features of B&B Dashboard in Excel
📊 Five Interactive Dashboard Pages – The Overview, Booking Trend, Room Analysis, Guest Insights, and Channel Performance pages give bed-and-breakfast owners a complete operational picture from a single workbook. Every page is wired to the same Data Sheet so data flows in once and reaches every chart.
🎚️ Multiple Slicers and Filters – Filter the entire dashboard by booking source, room type, guest type, country, and payment method with a single click. Slicers update charts and KPI cards instantly without writing a formula. Slicers are an Excel feature designed exactly for this kind of pivot-driven workflow — see the official Microsoft slicers documentation.
📈 Pivot-Powered Architecture – Every chart is connected to pivot tables on the Support Sheet. After updating bookings in the Data Sheet, click Refresh All on the Data tab and the entire workbook recalculates in seconds.
💰 Revenue and Profit Tracking – Monitors Total Revenue, Net Profit, Total Cost, Profit Margin %, and Avg. Revenue Per Booking across month, year, room type, and booking source. Designed to surface the metrics small B&B owners actually use to set rates and prioritize channels.
⭐ Guest Satisfaction Analysis – Avg. Satisfaction sits as a top-level KPI card and breaks down by room type and guest type, highlighting the segments most likely to leave 5-star reviews.
🌐 Channel Performance Reporting – Compares Direct Booking %, Total Cost, Total Bookings, and Avg. Revenue Per Booking across booking sources to optimize OTA spend versus direct channels.
Dashboard Pages Explanation
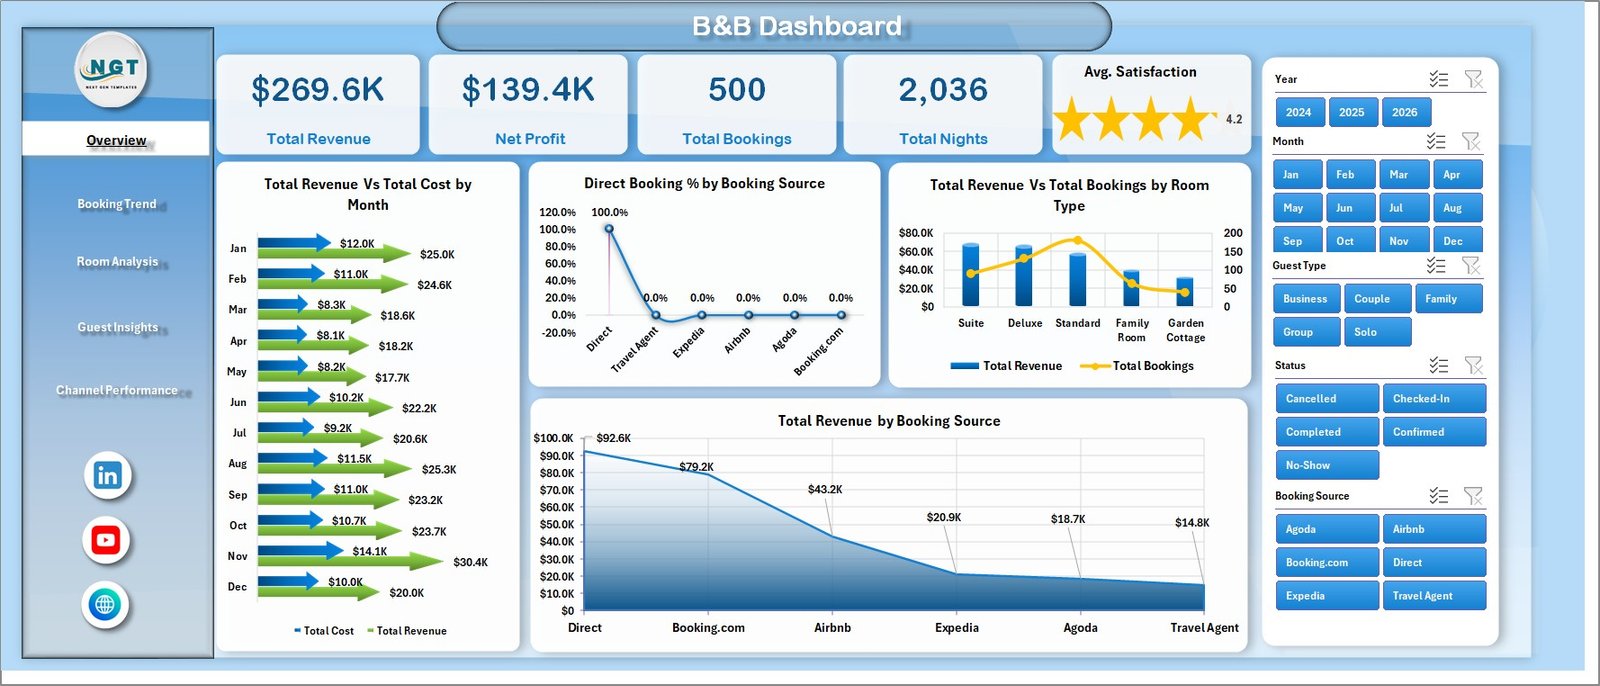
📌 1. Overview Page – Five high-level cards display Total Revenue, Net Profit, Total Bookings, Total Nights, and Avg. Satisfaction. Charts include Total Revenue Vs Total Cost by Month, Direct Booking % by Booking Source, Total Revenue Vs Total Bookings by Room Type, and Total Revenue by Booking Source. Slicers at the top filter the entire page in one click.
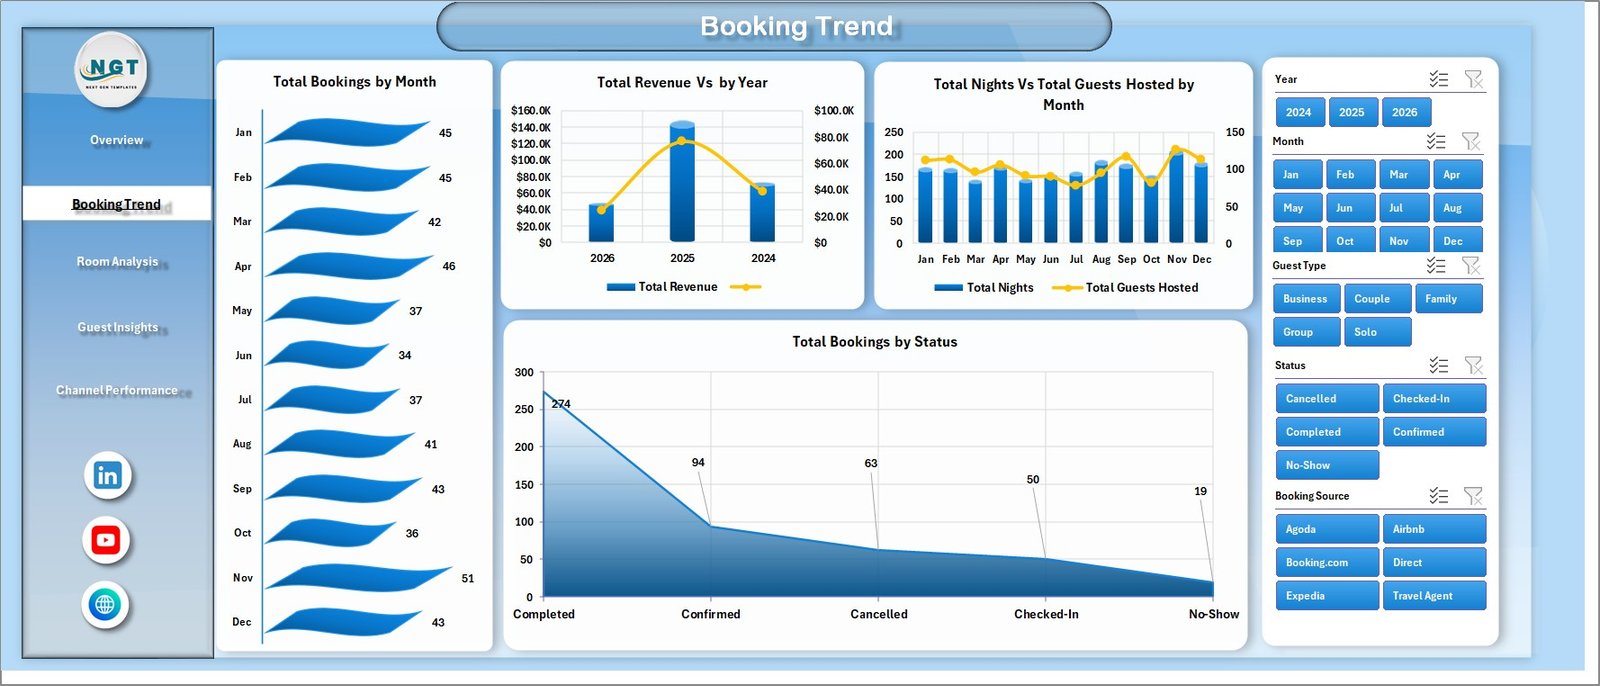
Booking Trend
📅 2. Booking Trend – Time-series view covering Total Bookings by Month, Total Revenue by Year, Total Nights Vs Total Guests Hosted by Month, and Total Bookings by Status. Use this page to spot peak seasons, no-show patterns, and year-over-year revenue trajectory.
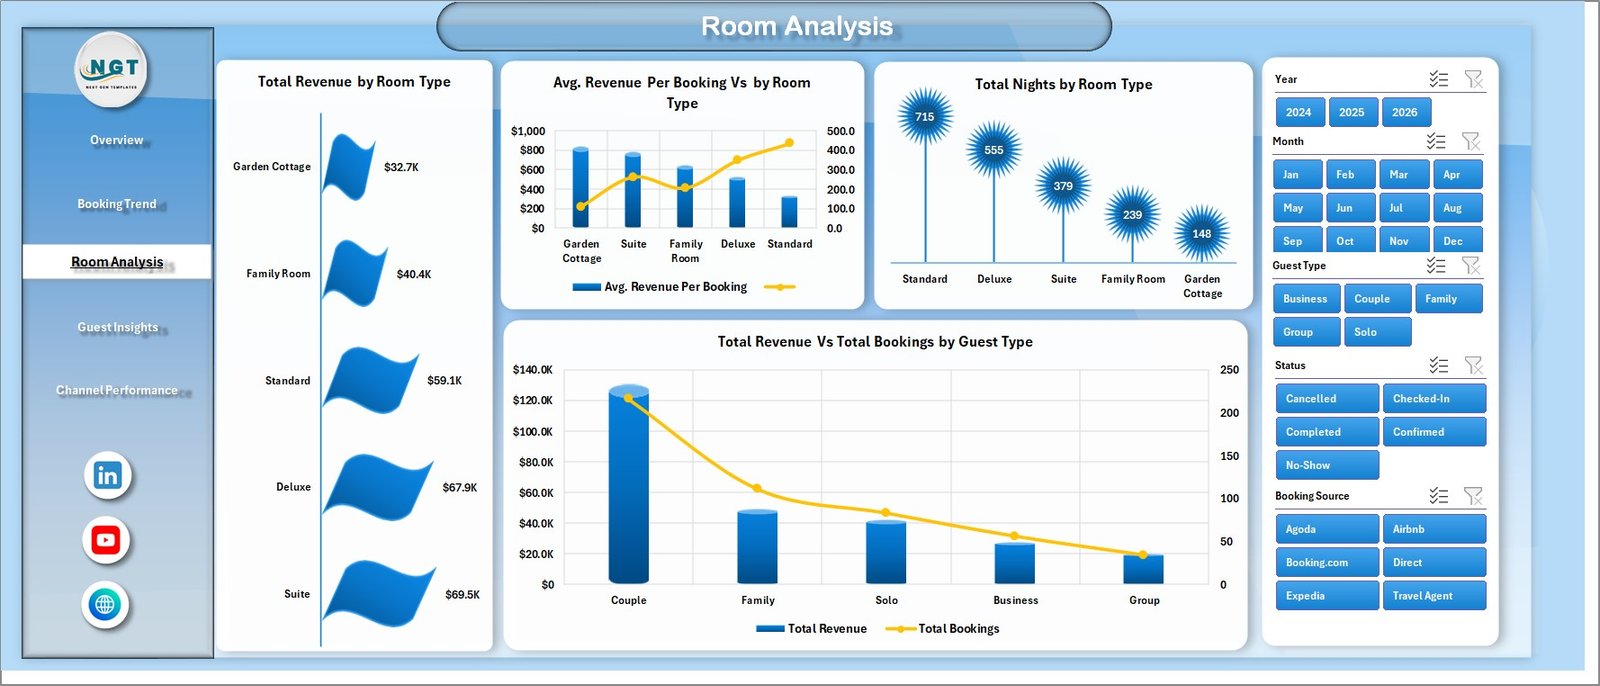
Room Analysis
🛏️ 3. Room Analysis – Room-level economics with Total Revenue by Room Type, Avg. Revenue Per Booking Vs by Room Type, Total Nights by Room Type, and Total Revenue Vs Total Bookings by Guest Type. Reveals which rooms generate the most revenue per stay so you can adjust pricing or marketing focus.

Guest Insights
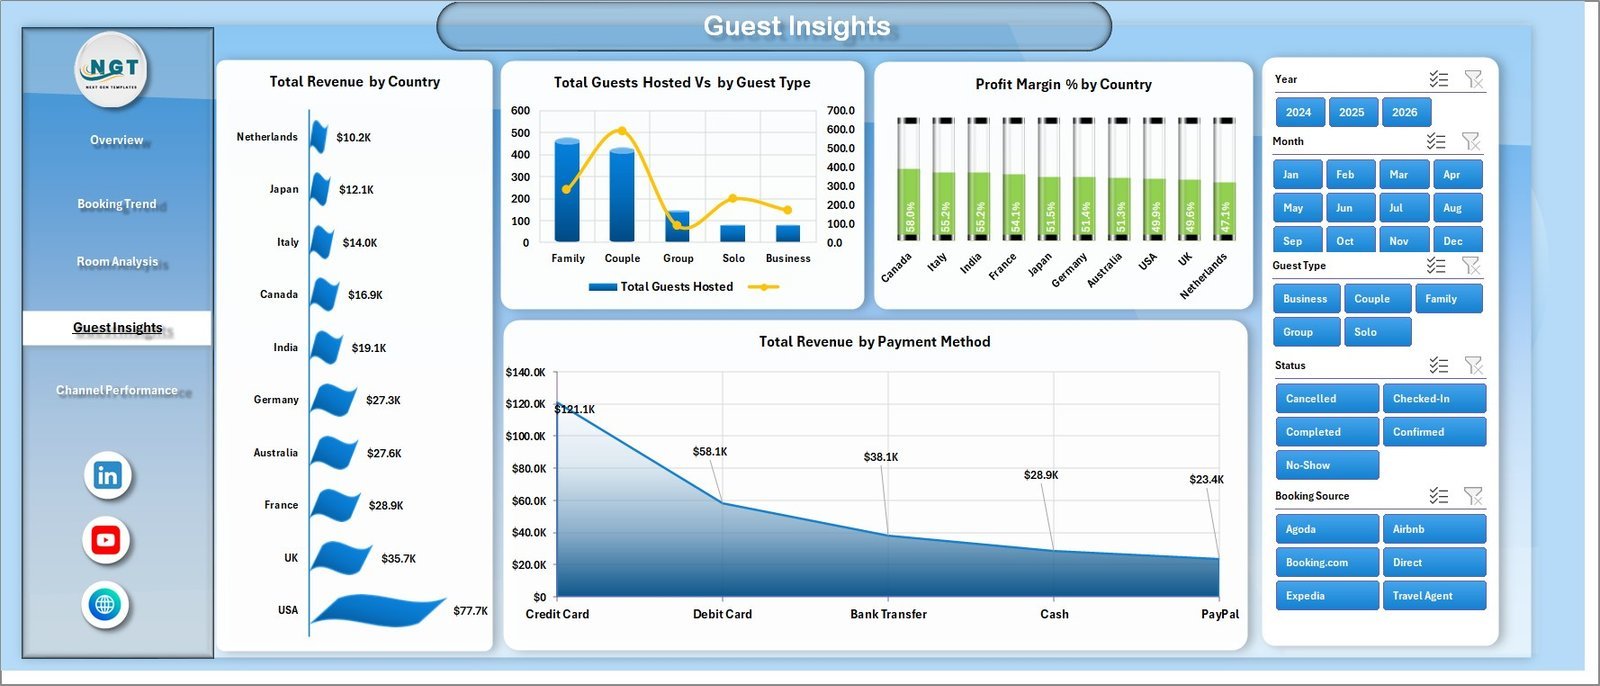
👥 4. Guest Insights – Guest-segment analytics with Total Revenue by Country, Total Guests Hosted by Guest Type, Profit Margin % by Country, and Total Revenue by Payment Method. Ideal for targeting marketing toward your most profitable source markets and preferred payment channels.
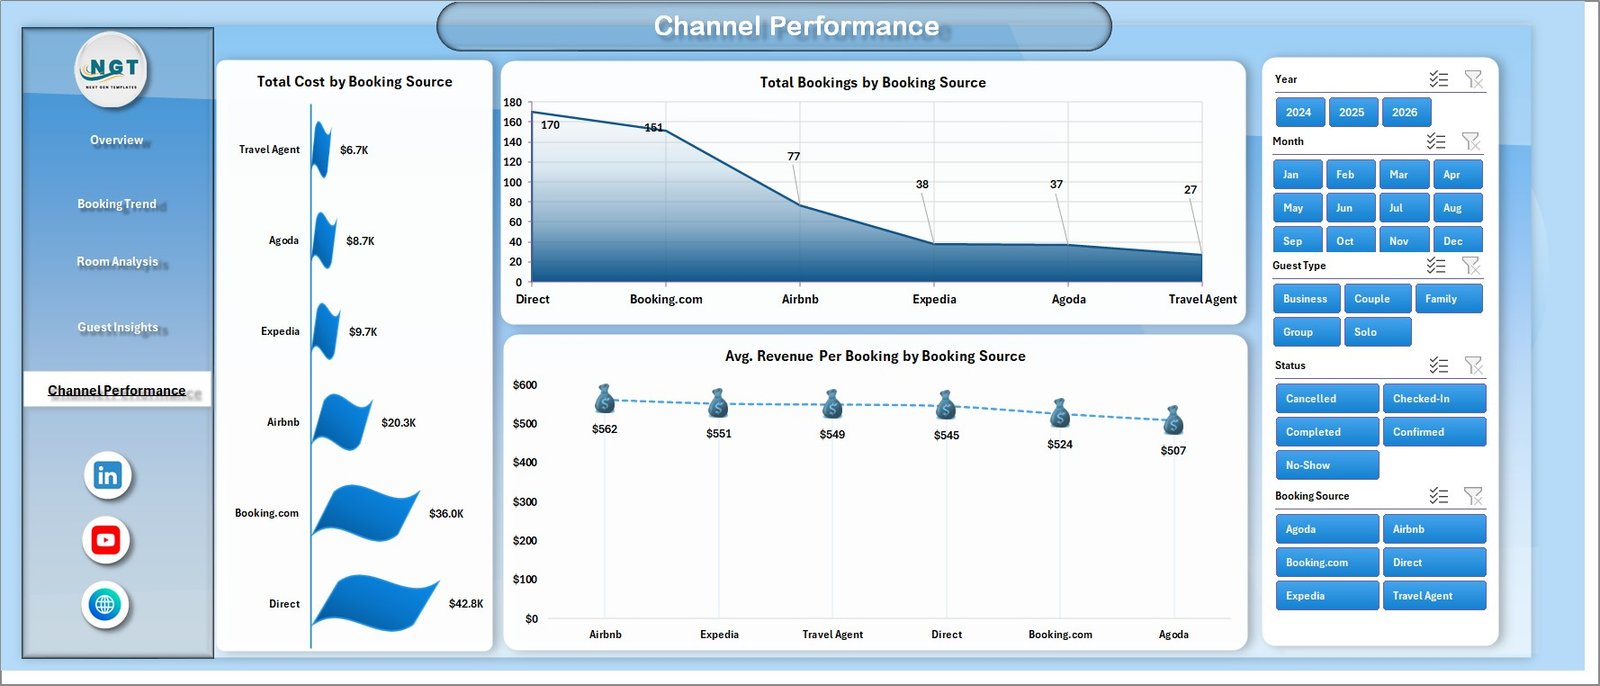
Channel Performance
🌐 5. Channel Performance – Booking-channel ROI with Total Cost by Booking Source, Total Bookings by Booking Source, and Avg. Revenue Per Booking by Booking Source. Identifies which OTA, direct, or referral channels deliver the highest per-booking margin.
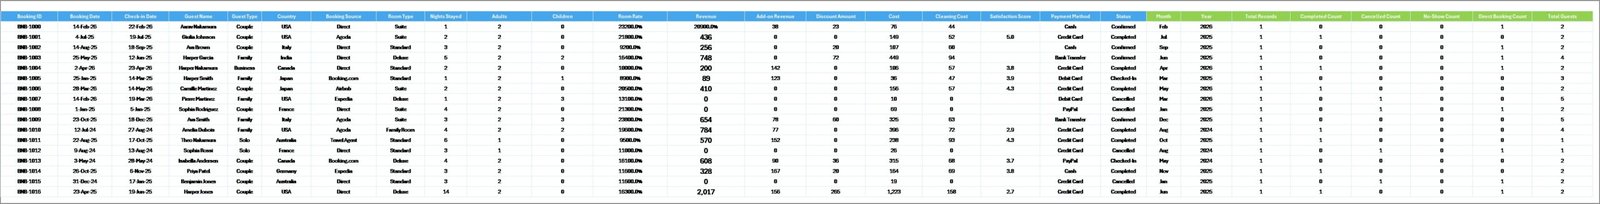
Data Sheet tab
📋 6. Data Sheet Tab – The data entry tab. Add reservations in the same column structure (dates, guest, room type, source, revenue, cost, country, payment method, satisfaction). Each row represents one booking.

Support sheet tab
⚙️ 7. Support Sheet – Contains all pivot tables that drive the dashboard. After updating bookings in the Data Sheet, go to the Data tab in Excel’s Ribbon and click Refresh All. All pivots and charts refresh automatically. You can keep this sheet hidden in production. To learn more about pivot tables, refer to the official Microsoft pivot table guide.
B&B Dashboard in Excel vs. Google Sheets Hospitality Dashboard vs. Cloudbeds / Little Hotelier — Feature Comparison
| Feature | B&B Dashboard in Excel | Google Sheets Hospitality Dashboard | Cloudbeds / Little Hotelier |
|---|---|---|---|
| Cost | $17.99 one-time | $9.99 one-time | $70-$300 / property / month |
| Platform | Microsoft Excel (offline) | Google Sheets (cloud) | Cloud SaaS PMS |
| Setup time | Under 10 minutes | Under 10 minutes | 2-4 weeks onboarding |
| Real-time team collaboration | Limited (OneDrive) | ✅ Native | ✅ Native |
| Mobile access | Excel mobile app | ✅ Browser | ✅ Native app |
| Customizable fields | ✅ Fully editable | ✅ Fully editable | Limited / paid add-ons |
| Booking-source breakdown | ✅ Built-in | Manual setup | ✅ Built-in |
| Year-1 cost (1 property) | $17.99 | $9.99 | $840-$3,600 |
| Channel manager / OTA sync | ❌ (manual data entry) | ❌ (manual data entry) | ✅ Automated |
For independent B&B owners and small-inn operators who want clear booking-and-revenue analytics without paying $70+ per month for a full PMS, the B&B Dashboard in Excel sits in the sweet spot.
Who Should Use This Template
✅ Perfect for:
- Independent B&B owners running 1-10 rooms who track bookings in spreadsheets, email, or paper
- Small inn and guesthouse operators wanting monthly revenue, profit, and channel performance reports
- Hospitality consultants delivering quick-turnaround analytics decks to small-property clients
- Vacation-rental hosts managing a handful of listings outside Airbnb’s reporting tools
- Hospitality students and instructors learning pivot-driven booking analysis with Excel
❌ Not a fit if:
- You run a hotel chain with 50+ rooms needing real-time channel-manager OTA sync (use Cloudbeds or similar full PMS)
- You need automated guest messaging, payment processing, or front-desk workflows
- Your team has zero Excel experience — pivot tables and slicers must be at least familiar
Real-World Use Cases
Maria runs a 6-room countryside B&B in Tuscany. She uses the B&B Dashboard in Excel to compare monthly revenue across Booking.com, Airbnb, and direct website bookings — and discovered that direct bookings carried a 22% higher profit margin. After redirecting a portion of her marketing budget toward her own website and email list, she saved roughly €4,200 annually in OTA commissions while keeping occupancy steady through the next two seasons.
James operates a 4-room coastal guesthouse in Cornwall. He pasted 18 months of reservations into the Data Sheet and used the Booking Trend page to confirm his peak season runs May to September. With that pattern in front of him, he negotiated a flexible off-season rate with his housekeeping contractor and now uses the Guest Insights page to plan targeted email campaigns to past UK and German guests in February — turning his slowest months into profitable ones.
Priya, a hospitality consultant in Mumbai, uses the dashboard for client work. She loads each B&B client’s last 12 months of bookings, exports the Channel Performance and Guest Insights pages to PDF, and presents quarterly reviews — without paying for a $1,200 BI license. Two of her clients have used the country-revenue breakdown to refine multilingual landing pages on their own websites.
Advantages of B&B Dashboard in Excel
💵 One-time cost vs. recurring SaaS fees – At $17.99 with lifetime access, the dashboard pays for itself within the first month versus a $70+ per-month PMS subscription.
⏱️ Fast setup – Under 10 minutes from download to a fully working dashboard. No onboarding calls, no implementation fees, no integration sprints.
🔧 Full editability – Every chart, KPI, slicer, and pivot is fully editable. Add new room types, payment methods, booking sources, or country breakdowns without breaking the file.
💾 Works offline – The dashboard runs entirely on Microsoft Excel desktop, which is essential if your B&B operates in a region with patchy internet or if you prefer keeping booking data off cloud servers.
🧠 Decision-grade visibility – Five pages cover the four decisions B&B owners actually make every quarter: which rooms to keep priced higher, which channels to expand, which guest segments to target, and which months to run promotions.
Opportunities for Improvement
To be transparent, the B&B Dashboard in Excel has scope limits worth knowing before you buy. It does not include automated channel-manager OTA sync — bookings still need to be entered or pasted manually into the Data Sheet. There is no built-in guest messaging, payment processing, or housekeeping workflow. Real-time multi-user collaboration is limited compared to a cloud PMS or Google Sheets equivalent. For a 50+ room hotel or chain, a full property-management system is the right choice. For 1-10 room B&Bs that simply need clear analytics on top of manual booking entry, this dashboard is built exactly for that scenario.
Best Practices
📥 Export bookings monthly, not daily – Most OTAs and direct booking systems let you export bookings as CSV. Doing it monthly keeps the workflow simple while still giving you up-to-date analytics.
🧹 Keep column structure intact – Don’t reorder or rename Data Sheet columns. The pivot tables on the Support Sheet rely on the existing structure to refresh correctly.
🔄 Click Refresh All before each review – Make it a habit: open the file, hit Refresh All, then explore the dashboard. This guarantees every chart and KPI reflects the very latest entries.
👁️ Hide the Support Sheet in production – Right-click the tab and choose Hide so the Support Sheet stays out of view when you share screenshots or PDFs with stakeholders.
📊 Use the slicers as your primary filter UX – Instead of filtering each chart manually, use the slicers at the top of each page. One click filters every chart, KPI, and pivot on that page.
Explore Relevant Templates
📊 Hotel and Hospitality Revenue Dashboard in Excel – Similar architecture for full-service hotels with broader revenue and operations analytics.
🏠 Airbnb Host Dashboard in Excel – Specialized version for Airbnb hosts tracking listings, occupancy, and guest reviews.
🌟 Airbnb-style Rentals Dashboard in Excel – For short-term-rental hosts managing multiple listings with stay-length and channel analytics.
📈 Hotel and Hospitality Revenue Dashboard in Power BI – If you prefer Power BI’s modeling and DAX flexibility, this is the same domain in a different tool.
Also available as: Browse the full Dashboard Templates collection on NextGenTemplates for more analytics tools across Excel, Google Sheets, Power BI, and HTML.
Frequently Asked Questions
What KPIs does the B&B Dashboard in Excel track?
The B&B Dashboard in Excel tracks five primary KPIs — Total Revenue, Net Profit, Total Bookings, Total Nights, and Avg. Satisfaction — plus 19 charts across booking trends, room analysis, guest segments, country revenue, payment methods, and channel performance.
How long does setup take for the B&B Dashboard in Excel?
Setup takes under 10 minutes. Open the workbook in Excel, paste your bookings into the Data Sheet using the existing column structure, click Refresh All on the Data tab, and the entire B&B Dashboard in Excel updates automatically with no formula edits required.
How does this compare to Cloudbeds or Little Hotelier?
Cloudbeds and Little Hotelier are full property-management systems costing $70-$300 per property per month with channel-manager OTA sync. The B&B Dashboard in Excel is a one-time $17.99 analytics layer for owners who manage bookings manually but want professional reporting and trend analysis on top.
Can I customize the room types, booking sources, and countries?
Yes. Add or rename any room type, booking source, country, payment method, or guest type directly in the Data Sheet, click Refresh All, and the B&B Dashboard in Excel adapts automatically. No formula or pivot edits are needed for new categories.
Does the B&B Dashboard in Excel work on Mac?
Yes. The B&B Dashboard in Excel works on Excel for Mac, Excel for Windows, and Microsoft 365. Slicers, pivot tables, and Refresh All are fully supported across all three. No macros are required, so there are no security prompts when opening the file.
Can I add my own KPIs or charts to the B&B Dashboard in Excel?
Yes. The Support Sheet contains all pivot tables, so you can build new pivots from the Data Sheet, add custom charts, and link them to the existing slicers. The B&B Dashboard in Excel is fully editable with no protection or hidden formulas.
Is this template a one-time payment?
Yes. The B&B Dashboard in Excel is a one-time $17.99 purchase with lifetime access — no subscription, no per-user fees, and no recurring charges. You receive an instant download immediately after checkout.
About the Author
Built by PK — Microsoft Certified Professional with 15+ years of Excel, Google Sheets, and Power BI experience. Founder of NextGenTemplates, reaching 300K+ subscribers across YouTube channels. Every template is hand-built and tested before release.
Conclusion
If you run a small B&B, inn, guesthouse, or vacation rental and you’ve been making pricing and channel decisions on instinct rather than data, the B&B Dashboard in Excel gives you 5 KPIs, 19 charts, and 5 slicer-driven pages of insights for the price of one night’s stay at most properties. It pays for itself the first time you reallocate a marketing dollar from a low-margin OTA to a higher-margin channel.
👉 Click here to Purchase B&B Dashboard in Excel
✅ Instant download · One-time payment · No subscription
🎥 Visit our YouTube channel for step-by-step video tutorials: YouTube.com/@PK-AnExcelExpert
📅 Last updated: April 2026


Reviews
There are no reviews yet.