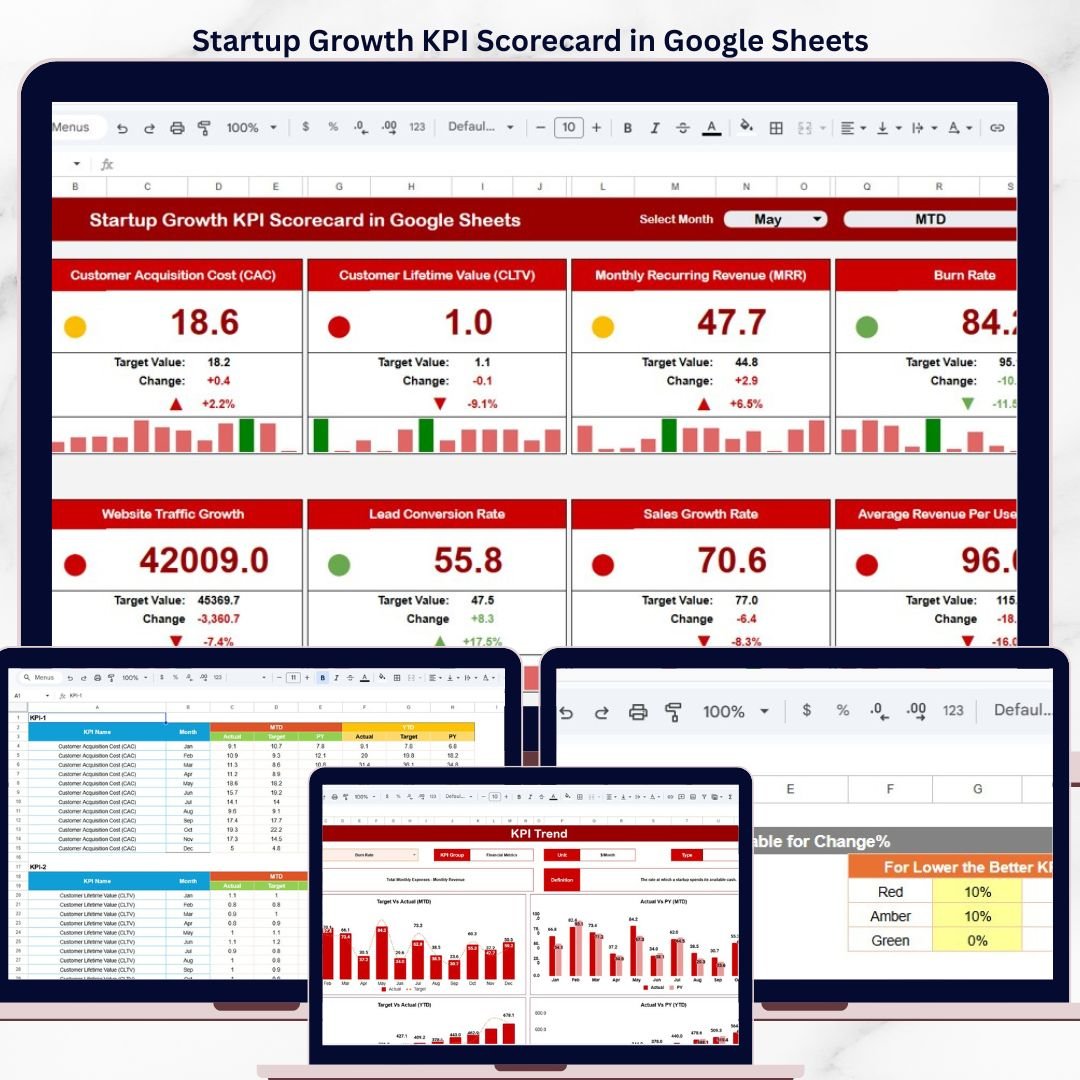
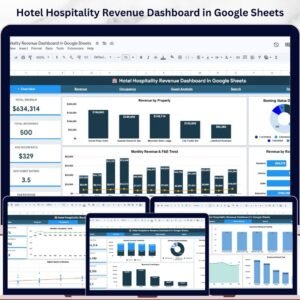
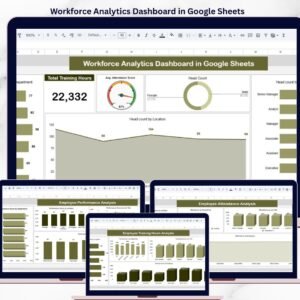
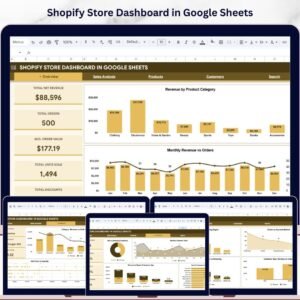
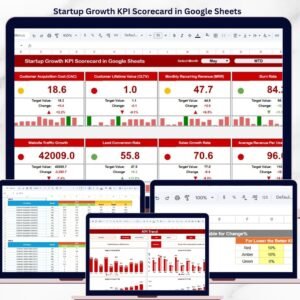
The Startup Growth KPI Scorecard in Google Sheets tracks 20+ startup KPIs across 4 interactive sheets, with month-to-date and year-to-date trend analysis, dropdown-driven filters, and automatic target-vs-actual comparisons. Setup takes under 10 minutes — just paste your numbers into the Input Data sheet and every scorecard metric updates instantly.Startup Growth KPI Scorecard in Google Sheets
🌍 Join 8,400+ teams in 40+ countries using NextGenTemplates to replace paid SaaS tools with one-time-purchase Excel, Google Sheets, Power BI, and HTML templates.Startup Growth KPI Scorecard in Google Sheets
✅ Instant download · One-time payment · No subscription · No per-user fees · Lifetime access
🔑 Key Features of Startup Growth KPI Scorecard in Google Sheets
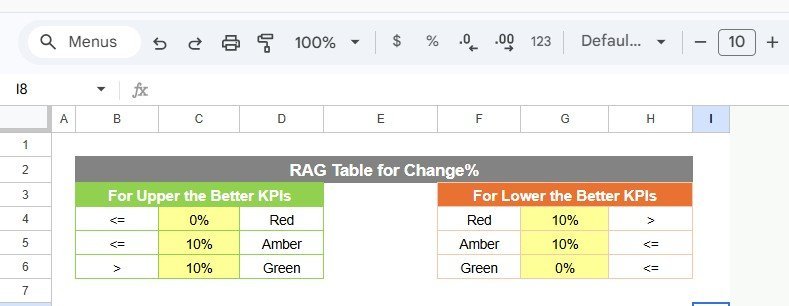
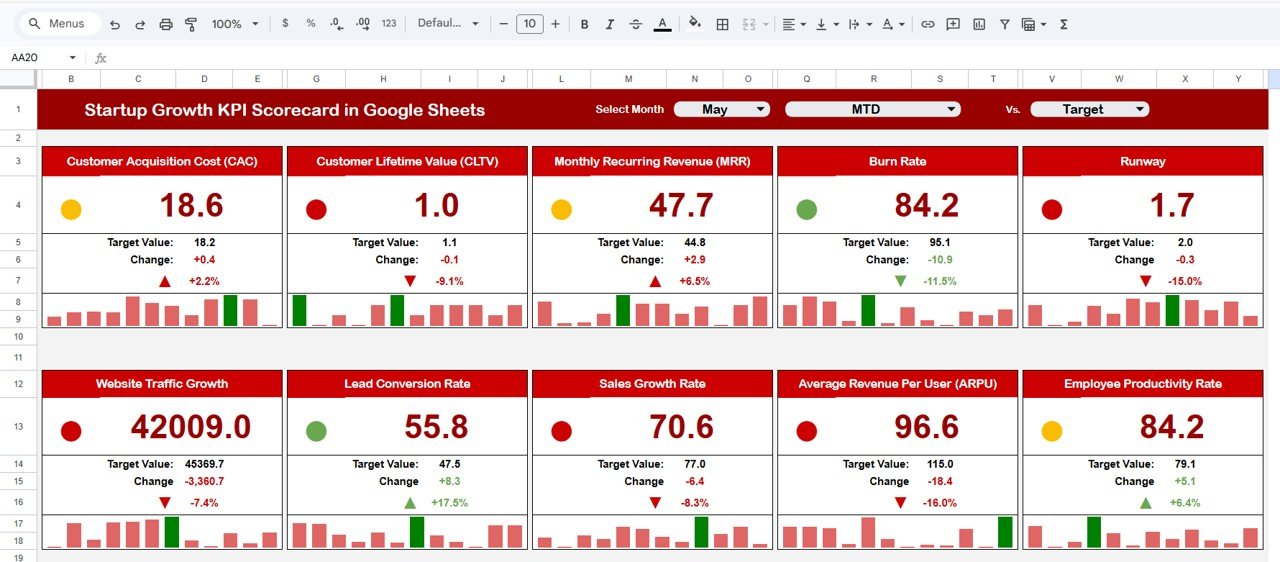
📊 Scorecard Sheet with Visual Indicators – The main scorecard displays all KPIs with actual vs. target values, MTD and YTD performance comparisons, and color-coded conditional formatting that flags underperforming metrics in red and on-track metrics in green. Select any month from the dropdown to instantly switch the view.
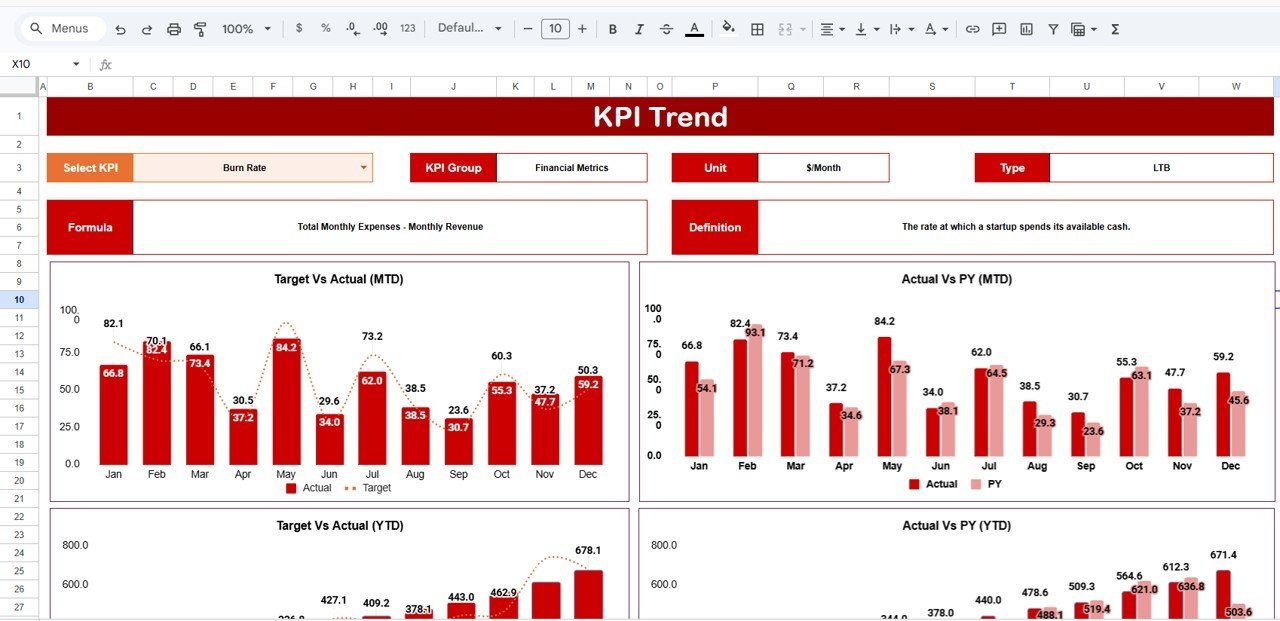
📈 KPI Trend Analysis with Interactive Charts – Pick any KPI from the dropdown on the Trend sheet to see its MTD and YTD trend charts for Actual, Target, and Prior Year numbers side by side. Each KPI also shows its group, unit, type (Lower the Better or Upper the Better), formula, and definition — all in one view.
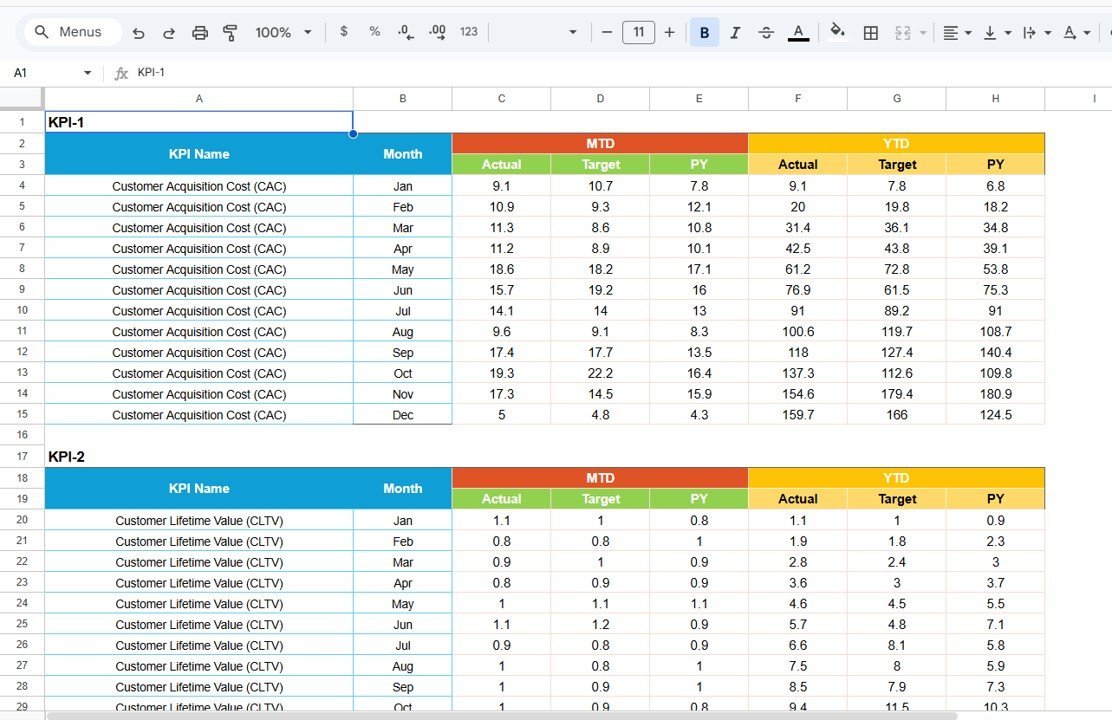
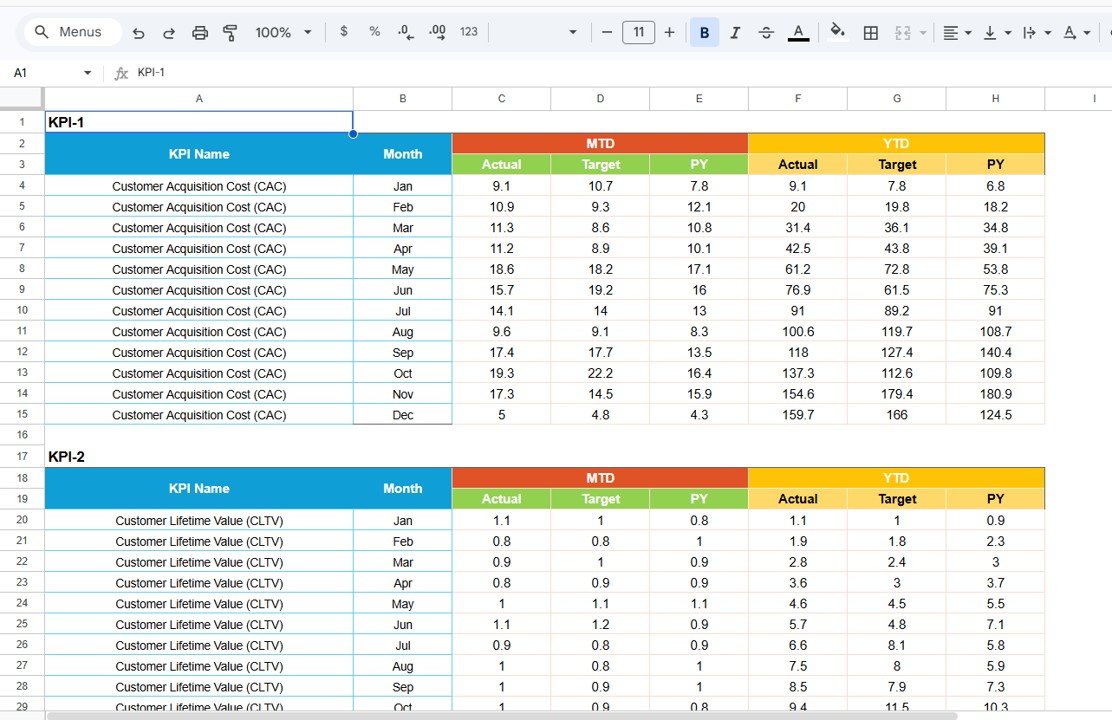
📝 Structured Input Data Sheet – Enter monthly actual values, targets, and prior-year figures in a clean tabular layout. The sheet feeds all calculations to the Scorecard and Trend pages automatically, so you never touch a formula.
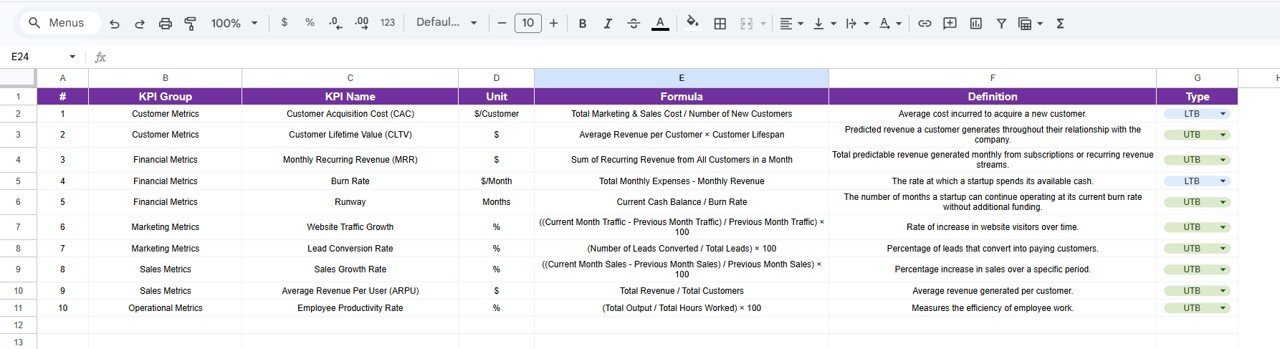
📋 KPI Definition Sheet – Document every KPI’s name, group, unit of measurement, formula, and business definition in one place. This becomes your team’s single source of truth for metric standards across departments.
🔄 Dropdown-Driven Navigation – Month selector, MTD/YTD toggle, and KPI name dropdowns let any team member filter the scorecard without editing cells or breaking formulas.Startup Growth KPI Scorecard in Google Sheets
🎯 Prior Year Benchmarking – Compare current performance against prior-year actuals alongside targets, giving founders a three-way view of growth trajectory.Startup Growth KPI Scorecard in Google Sheets
📦 What’s Inside the Startup Growth KPI Scorecard
This Google Sheets scorecard template includes 4 worksheets designed for startup founders and operations leads:
📌 Scorecard Sheet – The primary interface showing all KPIs with dropdown menus for month, MTD, and YTD selection. Displays actual vs. target values with visual performance indicators using conditional formatting.Startup Growth KPI Scorecard in Google Sheets
 Startup Growth KPI Scorecard in Google Sheets
📌 KPI Trend Sheet – Select any KPI from the dropdown on cell C3 to view its trend over time. Displays the KPI Group, Unit, Type (Lower the Better or Upper the Better), Formula, and Definition. Includes MTD and YTD trend charts comparing Actual, Target, and Prior Year data.
 KPI Trend Sheet
📌 Input Data Sheet – Enter all KPI data here — actual values, targets, and prior-year metrics. Easily update as new results come in to keep the scorecard current.
 Input Data Sheet
📌 KPI Definition Sheet – Enter KPI Name, KPI Group, Unit, Formula, and KPI Definition for every metric tracked in the scorecard.
 KPI Definition Sheet
📊 Startup Growth KPI Scorecard vs. Microsoft Excel vs. Paid SaaS — Where This Fits
| Feature | Startup Growth KPI Scorecard (Google Sheets) | Microsoft Excel Dashboard | Baremetrics / ChartMogul |
|---|---|---|---|
| Cost | $8.99 one-time | $14.99+ one-time (separate purchase) | $49–249 / month |
| Platform | Google Sheets (browser-based) | Desktop Excel required | Cloud SaaS |
| Setup Time | Under 10 minutes | 10–15 minutes | 30–60 minutes + API integration |
| Real-Time Team Collaboration | ✅ Built-in (Google Sheets) | Limited (OneDrive required) | ✅ Yes |
| Mobile Access | ✅ Google Sheets app | Limited on mobile | ✅ Browser / app |
| Customizable KPIs | ✅ Add/edit any KPI | ✅ With formula edits | ❌ Fixed to integrations |
| Share with Link | ✅ One click | ❌ Requires file sharing | ✅ Yes |
| Year-1 Cost (5 users) | $8.99 total | $14.99 total | $588–$2,988 |
| Prior Year Benchmarking | ✅ Built-in PY column | ✅ With manual setup | Varies by plan |
For startup founders who want KPI tracking without paying $49+/month for analytics SaaS, the Startup Growth KPI Scorecard in Google Sheets sits in the sweet spot.
👥 Who This Template Is For — and Who It’s Not For
✅ This template is built for:
- Seed-to-Series-A startup founders tracking monthly growth metrics across revenue, users, and burn rate
- Operations leads at 5–100 person startups who report KPIs to investors or board members monthly
- Startup accelerator managers monitoring cohort performance across multiple portfolio companies
- Finance managers at early-stage companies who need actual-vs-target tracking without dedicated BI tools
❌ This template is NOT for:
- Enterprise teams needing real-time API integrations with Stripe, Mixpanel, or HubSpot — use Baremetrics or ChartMogul instead
- Startups tracking 100+ KPIs across 10+ departments — consider a dedicated Power BI or Tableau setup
- Teams requiring SOC 2 compliance and audit trails for investor reporting
⚙️ How to Use the Startup Growth KPI Scorecard
1️⃣ Step 1: Open the PDF guide included in your download and click the Google Sheets copy link to create your own editable version in Google Drive.
2️⃣ Step 2: Go to the KPI Definition sheet and enter your startup’s KPI names, groups, units, formulas, and definitions.
3️⃣ Step 3: Navigate to the Input Data sheet and enter monthly actual values, targets, and prior-year numbers for each KPI.
4️⃣ Step 4: Switch to the Scorecard sheet, select a month from the dropdown, and toggle between MTD and YTD views to see performance at a glance.
5️⃣ Step 5: Use the KPI Trend sheet to deep-dive into any individual metric — select the KPI name from the dropdown on cell C3 to view trend charts and definitions.
6️⃣ Step 6: Share the Google Sheet link with co-founders, investors, or board members for real-time collaborative access.
💼 Real-World Use Cases
Ravi runs a 15-person fintech startup in Bangalore. He uses the Startup Growth KPI Scorecard to track MRR, customer acquisition cost, and churn rate monthly. Before board meetings, he toggles to YTD view and shares the Google Sheet link with his investors — replacing the $99/month Baremetrics subscription he was paying for basic metric tracking.
Jessica manages a startup accelerator in Austin with 12 portfolio companies. She duplicates the scorecard for each startup and uses the KPI Definition sheet to standardize metrics across the cohort. The prior-year benchmarking helps her compare each company’s Q1 2026 performance against Q1 2025 — a feature that cost her $200/month on ChartMogul.
Tomás is the COO of a 40-person edtech startup in Mexico City. He enters weekly user growth, NPS scores, and revenue per employee into the Input Data sheet every Monday. The color-coded scorecard flags any metric below 80% of target in red, so his leadership team spots issues before they become crises.
❓ Frequently Asked Questions
What KPIs does the Startup Growth KPI Scorecard track?
The Startup Growth KPI Scorecard in Google Sheets tracks 20+ customizable KPIs including MRR, ARR, customer acquisition cost, churn rate, burn rate, runway months, NPS, and revenue per employee. You define every KPI in the Definition sheet — add, remove, or rename any metric to match your startup’s stage.
How long does it take to set up this scorecard?
Setup takes under 10 minutes. Click the Google Sheets copy link from the PDF guide, enter your KPI definitions, paste your monthly data into the Input Data sheet, and the Scorecard and Trend pages update automatically. No formulas to write.
Can I share this scorecard with my investors?
Yes. Since it runs in Google Sheets, click Share and send a view-only or edit link to investors, board members, or co-founders. Everyone sees the same real-time data without installing anything.
How does this compare to Baremetrics or ChartMogul?
Baremetrics starts at $49/month and ChartMogul at $99/month — both require Stripe or billing API integration. The Startup Growth KPI Scorecard costs $8.99 one-time, works with any data you enter manually, and gives you full control over which KPIs to track without API dependencies.
Does this template work on mobile?
Yes. Google Sheets runs on the Google Sheets mobile app (iOS and Android) and any mobile browser. The dropdowns and conditional formatting work on mobile, though the desktop view offers the best experience for trend charts.
Can I add more KPIs beyond the defaults?
Yes. Go to the KPI Definition sheet, add a new row with the KPI name, group, unit, formula, and definition. Then add the corresponding data in the Input Data sheet. The Scorecard and Trend pages pick up the new KPI automatically.
Is this a one-time purchase or a subscription?
One-time purchase. Pay $8.99 once and get lifetime access. No monthly fees, no per-user charges, no renewal costs. Download the file, make a copy in Google Drive, and it is yours forever.
👤 About the Author
Built by PK — Microsoft Certified Professional with 15+ years of Excel, Google Sheets, and Power BI experience. Founder of NextGenTemplates, reaching 300K+ subscribers across YouTube channels (@PK-AnExcelExpert, @NextGenTemplates, @NeoTechNavigators). Every template is hand-built and tested before release.Startup Growth KPI Scorecard in Google Sheets
🔗 Explore Related Templates
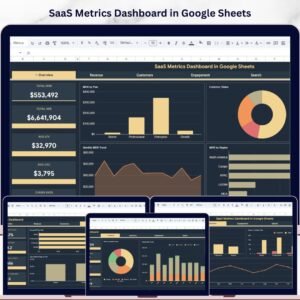
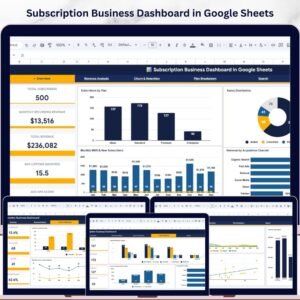
📌 SaaS Metrics Dashboard in Google Sheets – Track MRR, churn, LTV, and CAC with interactive charts and automated calculations built for SaaS founders.
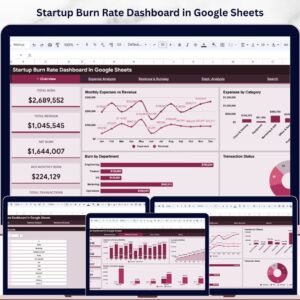
📌 Startup Burn Rate Dashboard in Google Sheets – Monitor monthly burn rate, cash runway, and expense breakdowns with visual trend analysis.
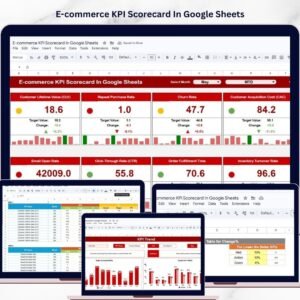
📌 E-commerce KPI Scorecard in Google Sheets – Similar scorecard structure for e-commerce businesses tracking conversion rates, AOV, and revenue metrics.
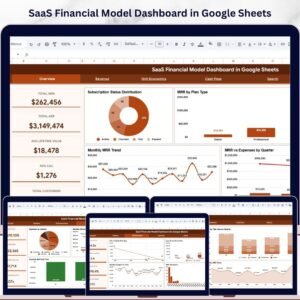
📌 SaaS Financial Model Dashboard in Google Sheets – Full financial modeling with revenue projections, scenario planning, and investor-ready outputs.
📌 Browse all Google Sheets Dashboard Templates
📖 Click here to read the Detailed Blog Post
🎥 Visit our YouTube channel for step-by-step video tutorials
👉 YouTube.com/@NextGenTemplates


Reviews
There are no reviews yet.