


Elevate your event planning and analysis with the Event Management Analysis Dashboard in HTML — a powerful, browser-based analytics solution built for event organizers, corporate planners, conference coordinators, and marketing teams. This interactive HTML dashboard transforms raw event data into clear, actionable insights across 5 beautifully designed pages. No Excel, no Power BI, no software installation — just open index.html in any modern browser and start analyzing revenue, attendees, sponsorship, budgets, and satisfaction instantly.Event Management Analysis Dashboard in HTML
Whether you manage corporate conferences, trade shows, workshops, weddings, fundraisers, or product launches, this HTML Dashboard template gives you a professional command center to track every metric that matters — from $84M+ in managed revenue to sponsorship performance, attendee satisfaction, and budget utilization.Event Management Analysis Dashboard in HTML
Event Management Analysis Dashboard Overview
🔑 Key Features of Event Management Analysis Dashboard in HTML
The Event Management Analysis Dashboard in HTML is a 5-page interactive web dashboard designed for event professionals who want enterprise-grade analytics without enterprise software. Built with pure HTML, CSS, and JavaScript, it runs directly in Chrome, Edge, Firefox, or Safari — making it accessible across any device without license fees.
🔹 5 Interactive Pages — Overview, Event Type Analysis, Regional Performance, Budget & Attendance, and Data View for a complete 360° view of your event portfolio.
🔹 6 Executive KPI Cards — Total Events, Total Revenue, Total Attendees, Avg Satisfaction, Sponsorship, and Avg Budget displayed at the top of the Overview page for instant executive summaries.
🔹 6 Built-in Slicers — Event Type, Category, Region, Status, Marketing Channel, and Year for instant one-click filtering.
🔹 20+ Dynamic Charts — Covering event type, category, status, region, venue, budget utilization, and attendance analysis.
🔹 Upload Excel & Reset Data — Load your own Excel data directly in the browser or reset to sample data with one click.
🔹 Smart Data View Page — Search, sort, paginate, and export filtered event data to CSV with a single click.
🔹 Dark & Light Mode — Toggle between light and dark themes for comfortable viewing any time of day.
🔹 No Software Needed — Works in any modern browser. Perfect for teams without Excel or Power BI licenses.
📦 What’s Inside the Event Management Analysis Dashboard in HTML
This dashboard is organized into 5 dedicated pages, each focused on a specific analytical angle:
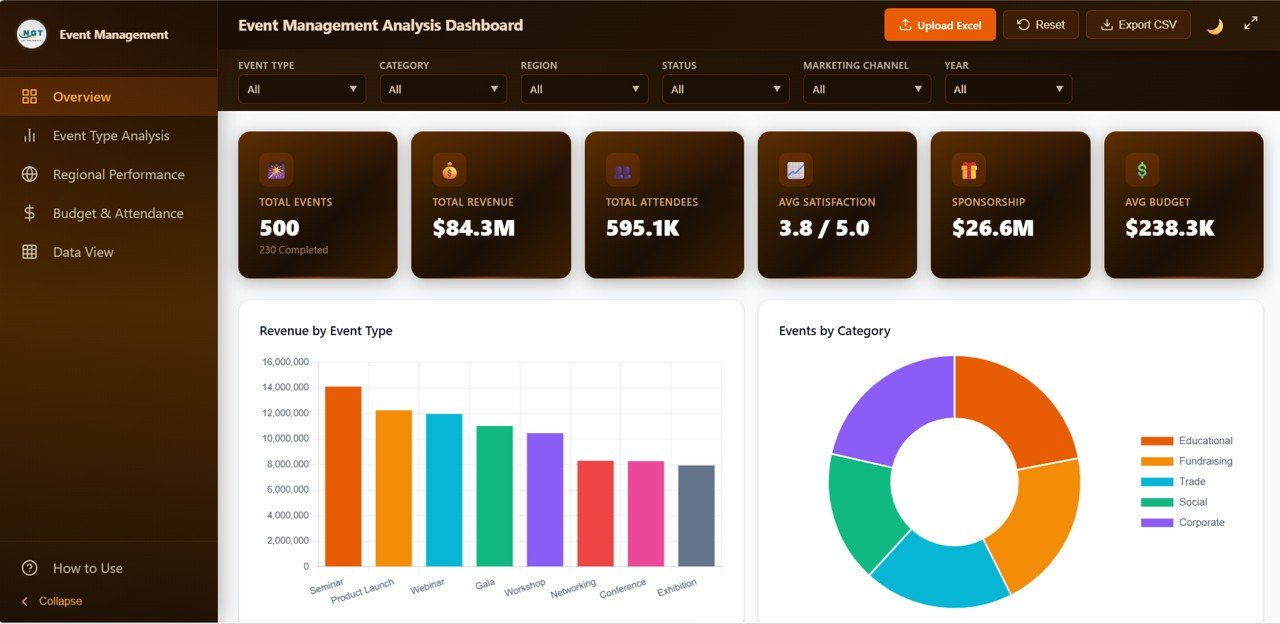
1️⃣ Overview Page
The executive home screen. At the top, 6 KPI cards surface the most critical metrics at a glance: Total Events, Total Revenue, Total Attendees, Avg Satisfaction, Sponsorship, and Avg Budget. Below the KPI cards, 6 slicers let you filter by Event Type, Category, Region, Status, Marketing Channel, and Year.
🔹 Revenue by Event Type — Shows which event formats (seminars, product launches, webinars, galas, workshops, networking, conferences, exhibitions) generate the most revenue so you can double down on winners.
🔹 Events by Category — A donut chart revealing the mix of Educational, Fundraising, Trade, Social, and Corporate events in your portfolio.
🔹 Attendees by Category — Reveals which event categories draw the biggest crowds, helping with capacity planning and marketing spend.
🔹 Revenue vs Expenses by Event Type — A side-by-side comparison of income and cost per event format to spotlight profitable versus loss-making events.
🔹 Satisfaction Score by Event Type — Benchmarks attendee satisfaction across event types to identify what delights — and what disappoints.
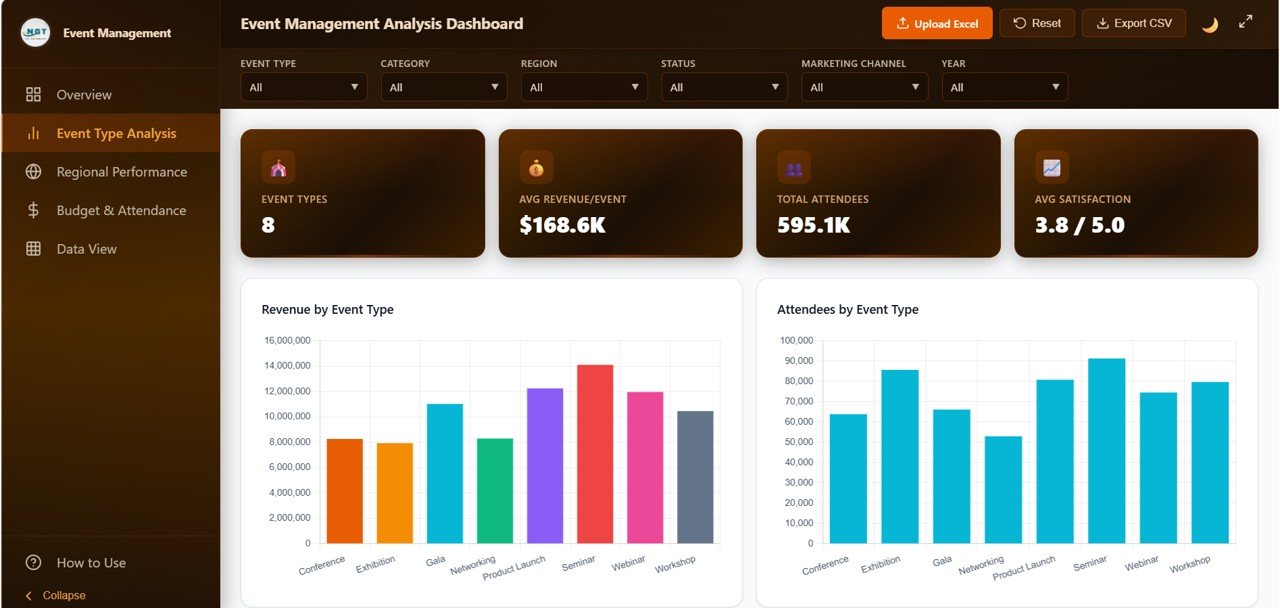
2️⃣ Event Type Analysis Page
Drill deeper into performance by event type (seminars, webinars, conferences, workshops, galas, and more):
🔹 Profit by Event Type — See which event formats deliver the highest margins.
🔹 Events by Event Type — Understand the distribution of events across every format you run.
🔹 Sponsorship by Event Type — Identify which event types attract the most sponsor dollars.
🔹 Speaker Count by Event Type — Plan your speaker roster by understanding historical event speaker needs.
🔹 Avg Ticket Price by Event Type — Optimize pricing strategy based on what attendees actually paid per format.

Event Type Analysis
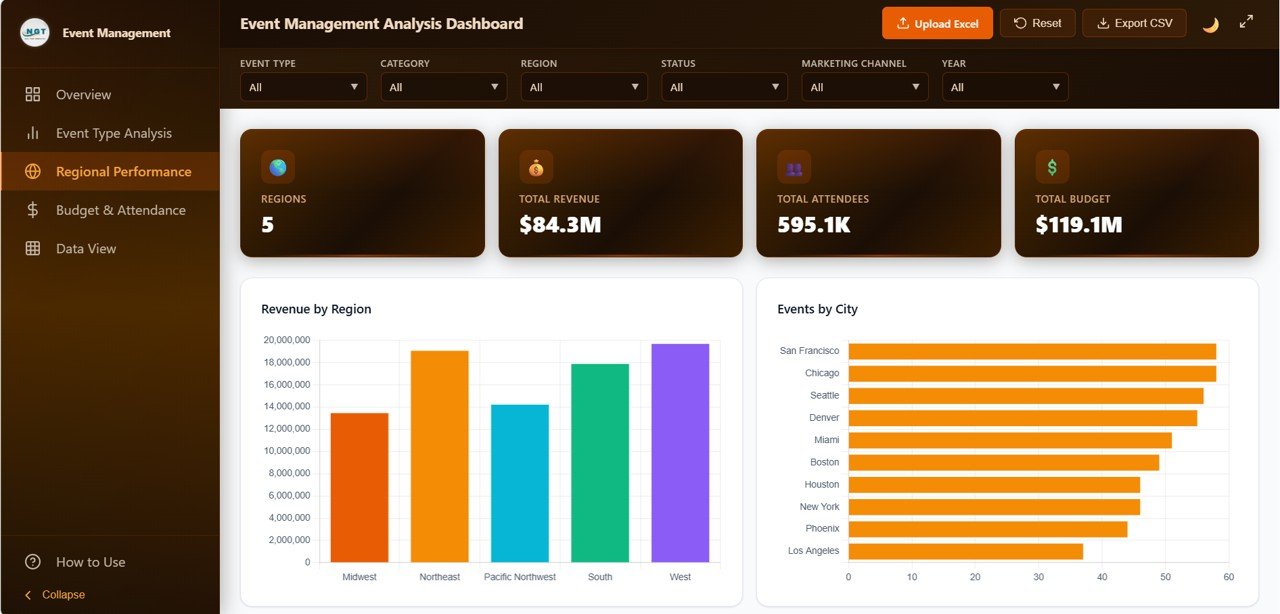
3️⃣ Regional Performance Page
Location-based intelligence for geographic expansion and venue partnerships:
🔹 Revenue by Region — Rank regions by revenue contribution to prioritize high-value markets.
🔹 Events by Region — See where your event volume is concentrated geographically.
🔹 Attendees by City — Zoom into city-level attendance data for micro-market analysis.
🔹 Revenue by Venue — Compare venue ROI to negotiate better partnerships.
🔹 Satisfaction by Region — Correlate location with attendee experience scores.

Regional Performance
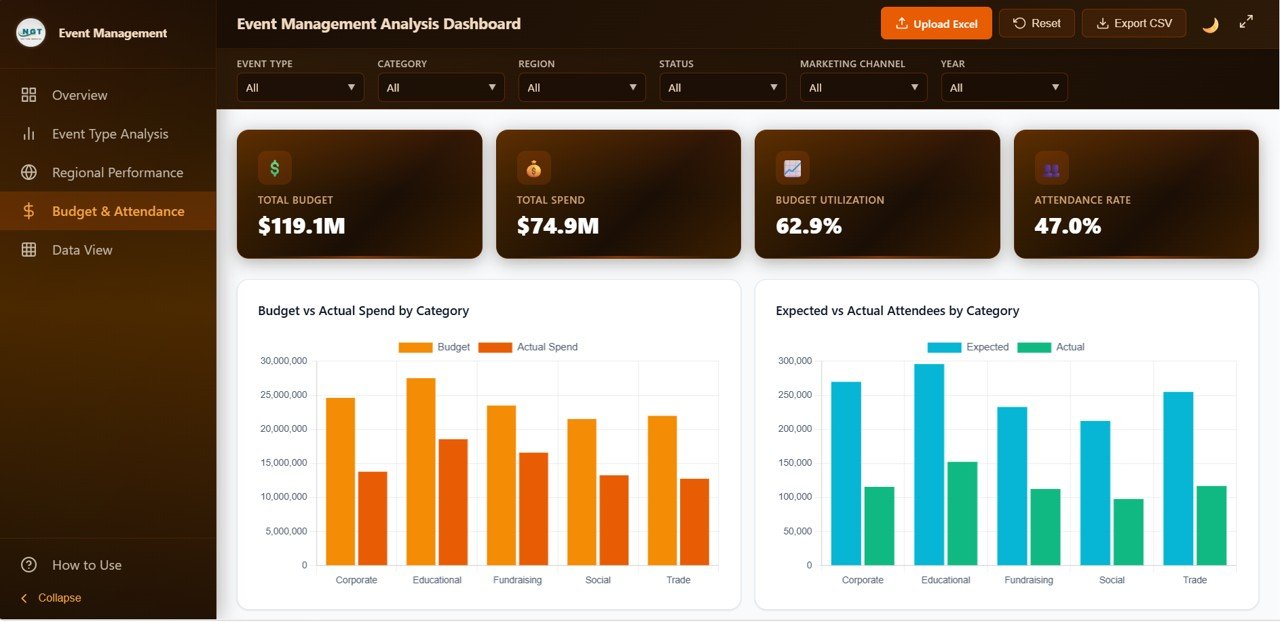
4️⃣ Budget & Attendance Page
Financial health and audience turnout in one unified view — essential for post-event reviews and next-year planning:
🔹 Budget Utilization by Event Type — Track planned budget vs actual spend across event formats.
🔹 Attendance Rate by Event Type — Compare registered vs actual attendees to spot no-show trends.
🔹 Avg Budget by Category — Benchmark budgets across Educational, Fundraising, Trade, Social, and Corporate events.
🔹 Attendees by Event Status — Audience turnout across planned, confirmed, completed, and cancelled events.
🔹 Budget vs Revenue — Profit pressure analysis by event format to protect margins.

Budget & Attendance
5️⃣ Data View Page
The power-user’s table view. Every single event record is listed here with:
🔹 Real-time search across all fields.
🔹 Column-wise sort (ascending or descending on any column).
🔹 Pagination for smooth navigation through thousands of rows.
🔹 Export to CSV for sharing filtered data with stakeholders.
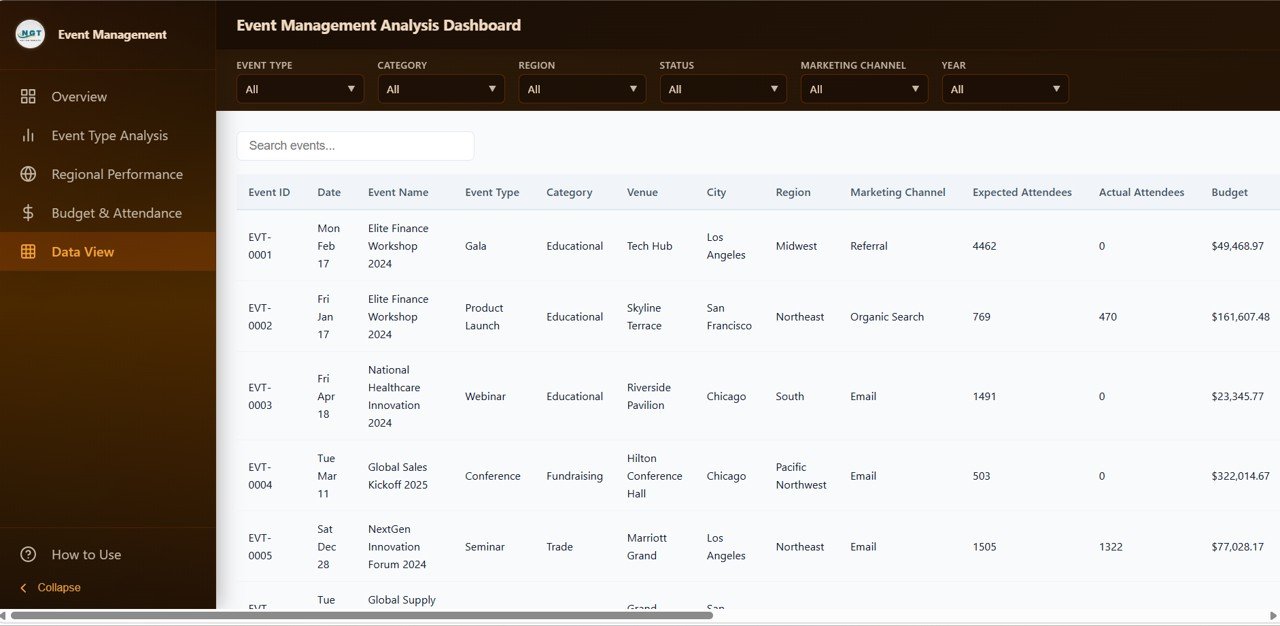
Data View tab
⚙️ How to Use the Event Management Analysis Dashboard in HTML
1. Download and unzip the template file from your purchase confirmation email.
2. Open index.html in Chrome, Edge, Firefox, or Safari — no installation needed.
3. Click Upload Excel in the top toolbar to load your own event data, or edit the data file directly.
4. Every chart and KPI updates automatically based on your data.
5. Use the 6 slicers (Event Type, Category, Region, Status, Marketing Channel, Year) to drill into specific segments.
6. Navigate between the 5 pages using the left-side navigation bar. Export filtered data to CSV from the Data View page.
👥 Who Can Benefit from This Event Management Analysis Dashboard
🔹 Event management companies and agencies
🔹 Corporate event planners and conference organizers
🔹 Marketing teams running brand activations and product launches
🔹 Non-profit fundraising coordinators
🔹 Trade show and expo organizers
🔹 Hotel and venue managers tracking event-driven revenue
🔹 Academic institutions managing conferences and seminars
🔹 Wedding planners and social event coordinators
❓ Frequently Asked Questions
What is the Event Management Analysis Dashboard in HTML?
The Event Management Analysis Dashboard in HTML is a browser-based analytics template that tracks 6 executive KPIs and 20+ charts across 5 interactive pages — Overview, Event Type Analysis, Regional Performance, Budget & Attendance, and Data View. It helps event organizers analyze revenue, attendees, sponsorship, budget, and satisfaction without needing Excel or Power BI.
Do I need any software to use this HTML dashboard?
No. You only need a modern web browser like Chrome, Edge, Firefox, or Safari. There is no Excel, Power BI, or server setup required — simply unzip the file and open index.html to run the complete dashboard locally.
Can I upload my own Excel data into the dashboard?
Yes. The dashboard has a built-in Upload Excel button in the top toolbar. Click it to load your own event data instantly, or use the Reset button to restore the sample dataset.
What KPIs does the Event Management Analysis Dashboard track?
The dashboard tracks 6 executive KPIs: Total Events, Total Revenue, Total Attendees, Avg Satisfaction, Sponsorship, and Avg Budget. It also includes 20+ supporting charts covering event type, category, region, venue, budget, and attendance.
Can I export filtered data from this dashboard?
Yes. The Data View page supports real-time search, column sorting, pagination, and CSV export — making it easy to share filtered event data with stakeholders or import into other analytics tools.
Is this dashboard suitable for both corporate and social events?
Absolutely. The Event Management Analysis Dashboard works equally well for corporate conferences, trade shows, workshops, weddings, charity events, and product launches — any event type where you track revenue, attendees, sponsorship, and satisfaction.
🔗 Explore Related Templates
Looking for more event analytics power? Check out the Event Management Analysis Dashboard in Excel for the spreadsheet-driven version with pivot tables and native Excel formulas. For celebration-focused planning, our Wedding Budget Dashboard in HTML is perfect. Browse our full library of HTML Dashboard templates for more browser-based analytics, or explore Excel Dashboard templates if you prefer spreadsheet-native tools.
📖 Click here to read the Detailed Blog Post
Watch the step-by-step video tutorial:


Reviews
There are no reviews yet.