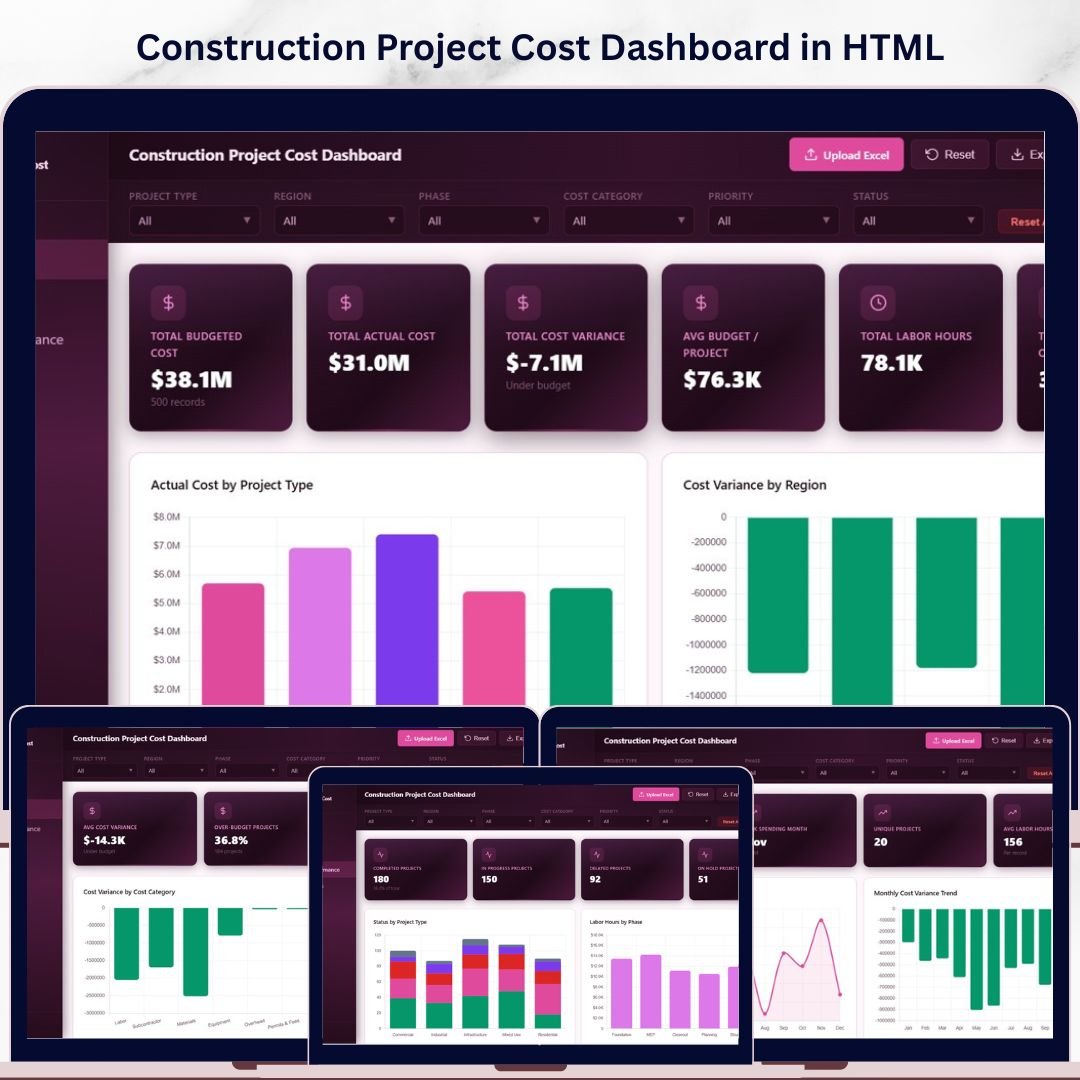


Construction Project Cost Dashboard in HTML is a powerful, browser-based analytics template built for construction project managers, contractors, cost engineers, and finance teams who need to monitor project budgets, track actual costs, analyze cost variances, and evaluate project performance — all from a single interactive dashboard. This HTML dashboard template includes 5 interactive pages covering cost overview, cost analysis, project performance, time and trends, and a full data view — opening directly in any modern web browser with zero software installation required.
This template tracks 6 key performance indicators including Total Budgeted Cost, Total Actual Cost, Total Cost Variance, Avg Budget per Project, Total Labor Hours, and Total Change Orders. With interactive slicers and multiple analysis pages, you can drill down into specific project types, regions, phases, cost categories, contractors, and time periods. Whether you manage residential, commercial, or industrial construction projects, this dashboard delivers the financial clarity you need to control costs and deliver projects on budget.
🔑 Key Features of Construction Project Cost Dashboard in HTML
📊 5 Interactive Dashboard Pages – Overview, Cost Analysis, Project Performance, Time and Trends, and Data View pages deliver a 360-degree view of your construction project cost performance across every dimension.
📈 6 High-Level KPI Cards – Instantly track Total Budgeted Cost, Total Actual Cost, Total Cost Variance, Avg Budget per Project, Total Labor Hours, and Total Change Orders on the Overview page for a quick executive summary.
🔍 Dynamic Slicers and Filters – Apply multiple slicers to filter by Project Type, Region, Phase, Status, Cost Category, Contractor, and Project Manager with a single click.
📉 Budget vs Actual Cost Comparison – Compare planned budgets against actual costs by phase and contractor to detect overruns early.
🏗️ Project Performance Tracking – Monitor project status distribution, labor hours by phase, priority distribution, and projects by project manager.
📅 Time and Trend Analysis – Track monthly actual cost trends, cost variance trends, projects by month, and yearly comparison 2024 vs 2025.
🧪 Full Data View with Export – Search, sort, paginate, and export all project records to CSV.
⚙️ Zero Installation Required – Simply unzip and open index.html in any modern browser.
📦 What’s Inside the Construction Project Cost Dashboard in HTML
📊 Overview Page — Your command center for construction cost monitoring. 6 KPI cards display Total Budgeted Cost, Total Actual Cost, Total Cost Variance, Avg Budget per Project, Total Labor Hours, and Total Change Orders. Charts include Actual Cost by Project Type showing how expenses distribute across construction categories, Cost Variance by Region highlighting where overruns or savings occur geographically, Budget vs Actual by Phase comparing planned versus actual spending across construction stages, Status Distribution revealing active completed and delayed project counts, and Top 10 Projects by Actual Cost identifying the highest-spending projects. Multiple slicers let you filter instantly.
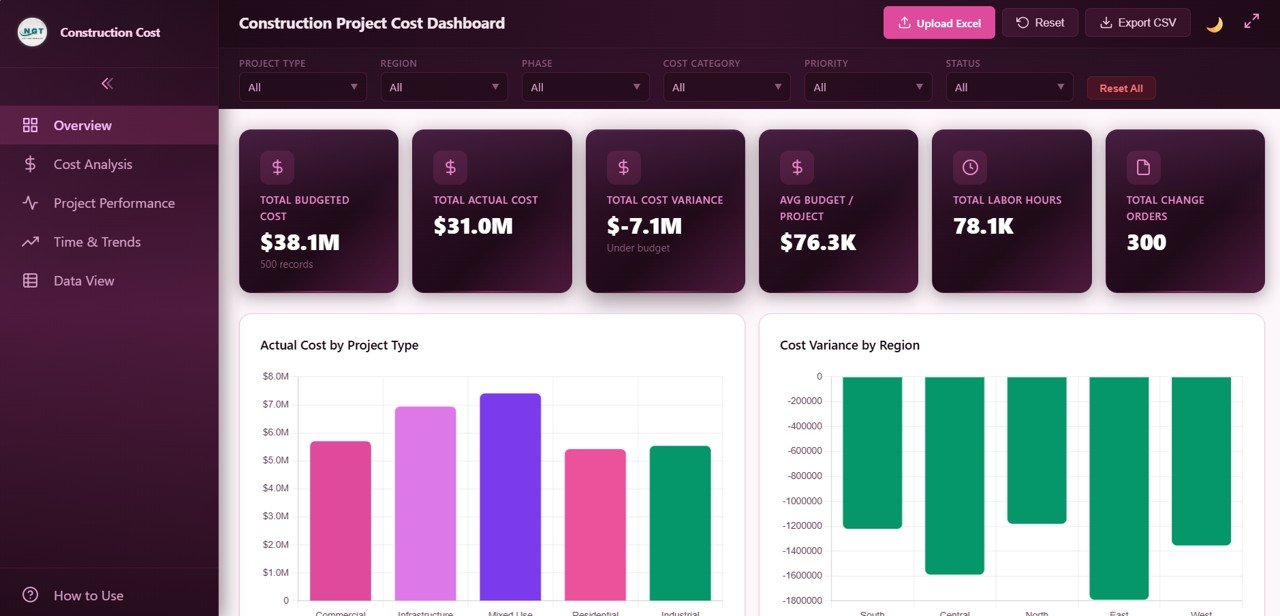 Construction Project Cost Dashboard Overview
💰 Cost Analysis Page — Dive deep into spending patterns with Cost Variance by Cost Category revealing where budget overruns or savings occur across material labor equipment and other categories, Budget vs Actual by Contractor comparing planned versus actual spending by contractor, Cost Category Distribution showing the percentage breakdown of total costs, and Monthly Cumulative Cost tracking how total expenditure accumulates over time.
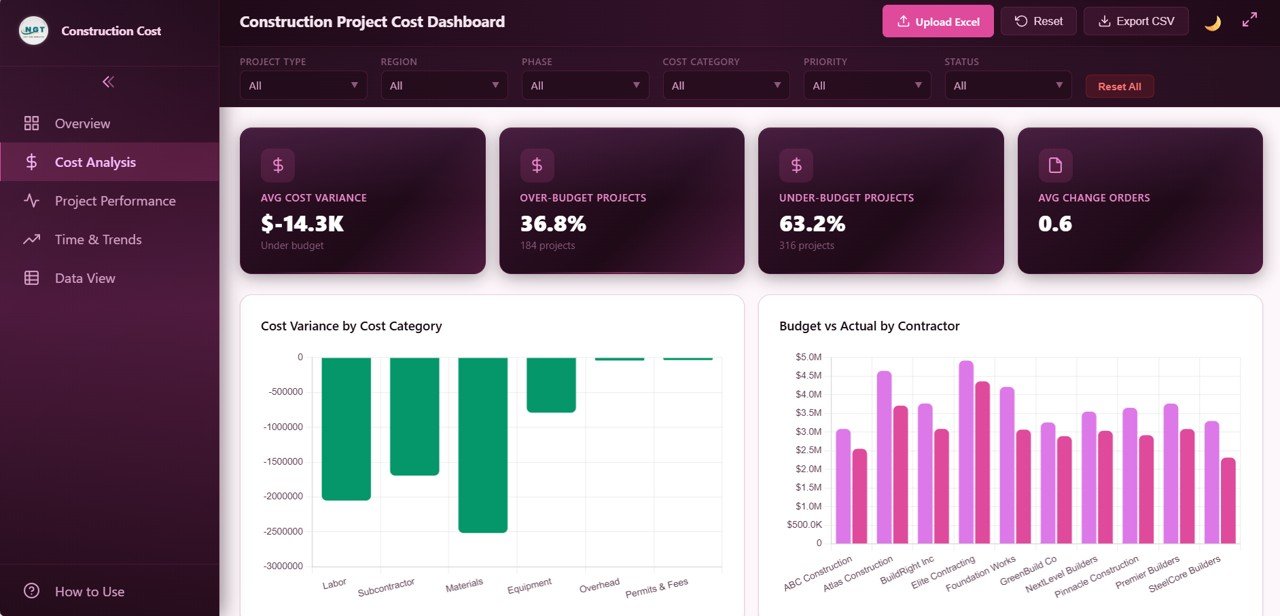 Cost Analysis Page
📋 Project Performance Page — Monitor project execution with Status by Project Type comparing on-time delivery rates across different construction categories, Labor Hours by Phase tracking workforce utilization across construction stages, Priority Distribution revealing how projects are distributed by urgency level, and Projects by Project Manager tracking individual manager workload and performance.
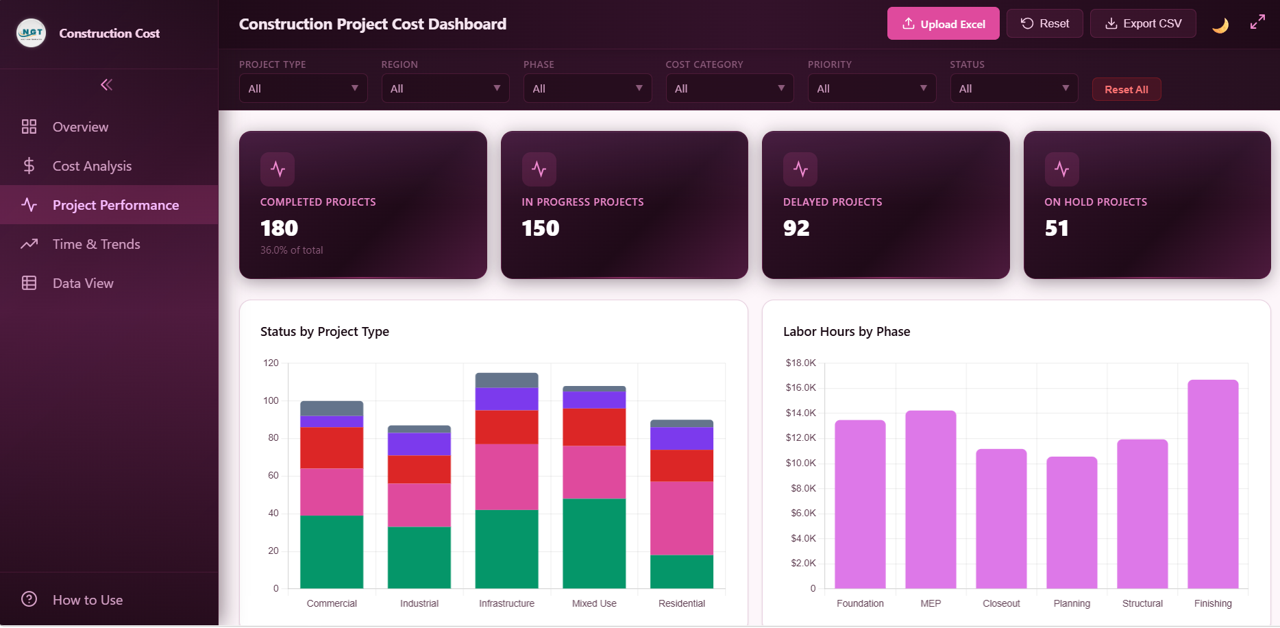 Project Performance Page
📅 Time and Trends Page — Track time-based financial and operational patterns with Monthly Actual Cost Trend for month-over-month expenditure tracking, Monthly Cost Variance Trend for monitoring budget compliance over time, Projects by Month showing project launch distribution, and Yearly Comparison 2024 vs 2025 for year-over-year cost analysis.
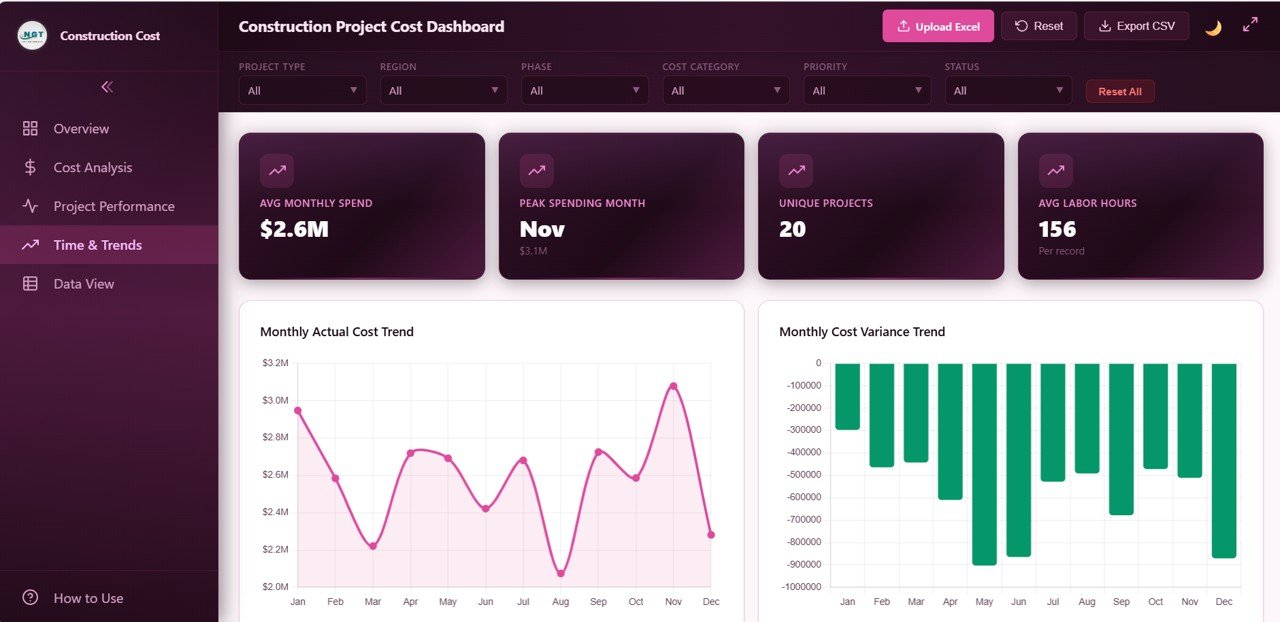 Time and Trends Page
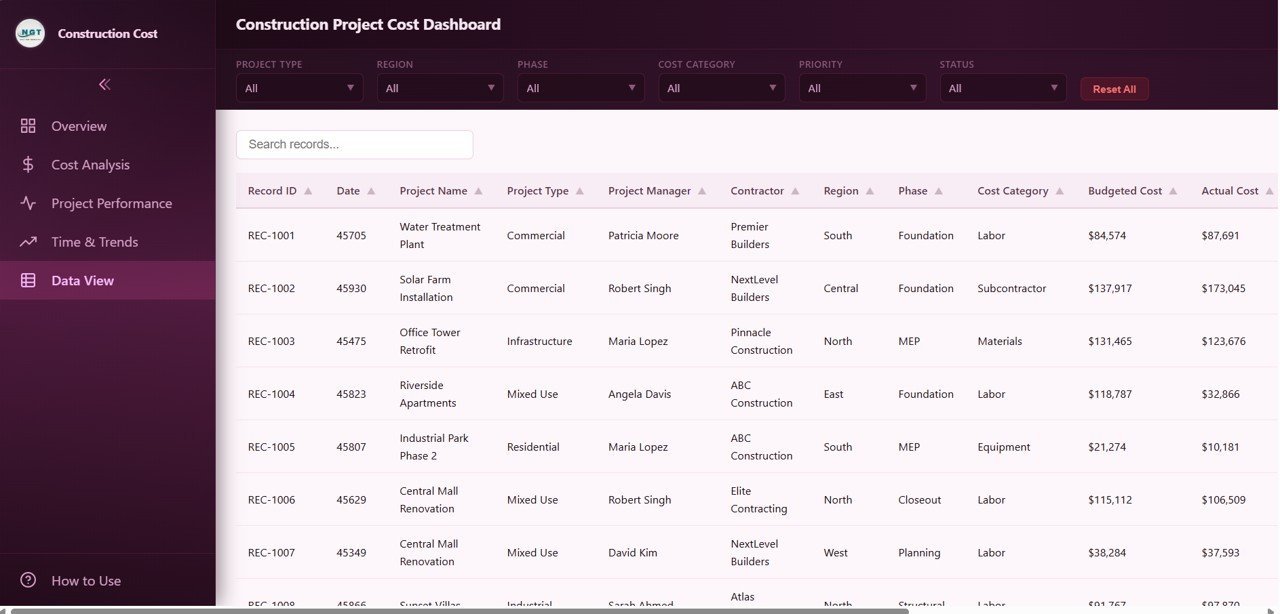
📋 Data View Page — This is the detailed data table page. Here you can see all the construction project cost records with powerful search, sort, and pagination features. You can also export the filtered data to CSV for further offline analysis and reporting.
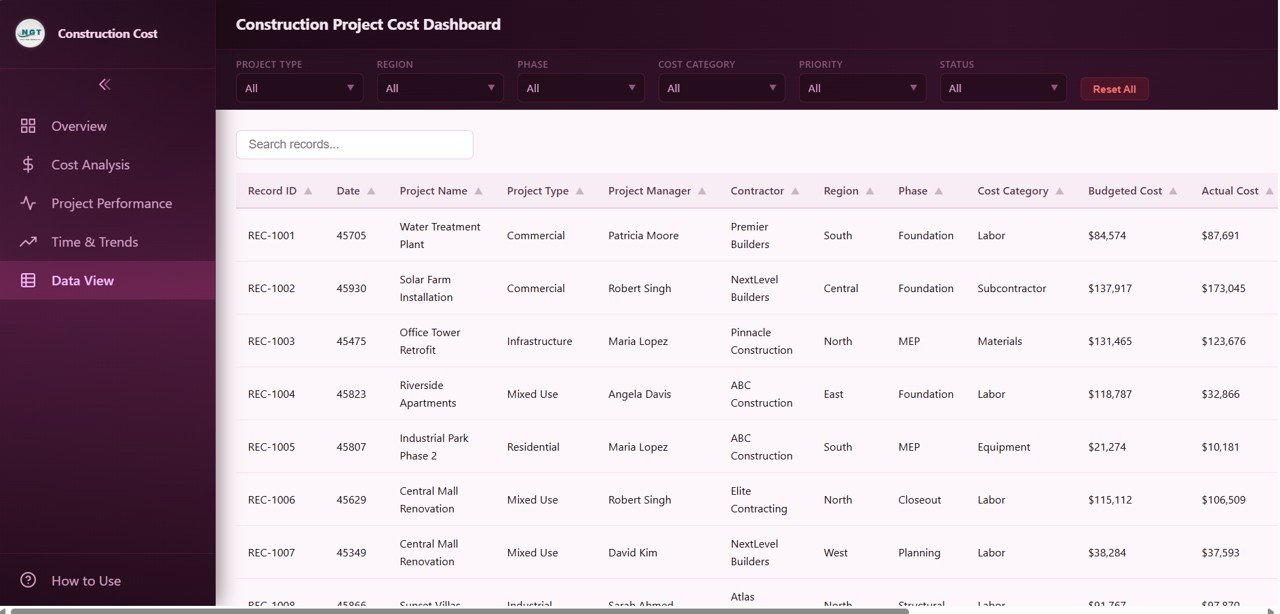 Data View Tab
⚙️ How to Use the Construction Project Cost Dashboard in HTML
1️⃣ Download and unzip the file to your computer.
2️⃣ Open index.html in any modern browser (Chrome, Edge, Firefox).
3️⃣ Replace the sample data in the data file with your own construction project cost records.
4️⃣ Use the interactive slicers and filters to analyze costs by project type, region, phase, or contractor.
5️⃣ Export data from the Data View page to CSV for sharing with stakeholders.
👥 Who Can Benefit from This Construction Project Cost Dashboard in HTML
🔹 Construction Project Managers – Monitor project budgets and identify overruns
🔹 Cost Engineers and Estimators – Compare actual vs budgeted costs across phases and contractors
🔹 General Contractors – Track multiple project costs simultaneously
🔹 Real Estate Developers – Monitor construction budgets for development projects
🔹 Government Infrastructure Agencies – Oversee public construction spending
🔹 Finance Teams – Analyze budget utilization and cost trends
Also check out our Construction Project Cost Dashboard in Excel, Construction Dashboard in HTML, and Construction Project Timeline Calendar in Excel.
❓ Frequently Asked Questions
What KPIs does the Construction Project Cost Dashboard in HTML track?
It tracks 6 KPIs: Total Budgeted Cost, Total Actual Cost, Total Cost Variance, Avg Budget per Project, Total Labor Hours, and Total Change Orders displayed across 5 interactive pages with 15+ charts.
Do I need coding skills to use this dashboard?
No. Unzip the file, open index.html in any browser, replace sample data with your own, and the dashboard updates automatically.
What is the best HTML dashboard for construction project costs?
The Construction Project Cost Dashboard in HTML by NextGenTemplates includes 5 pages covering cost overview, analysis, performance, trends, and data view with CSV export — all browser-based.
Can I filter by contractor or project phase?
Yes. Multiple slicers let you filter by Project Type, Region, Phase, Status, Cost Category, Contractor, and Project Manager instantly.
How does this compare to the Excel version?
The HTML version runs in any browser with no software. The Excel version uses pivot tables for dynamic analysis within Excel.
🔗 Explore Related Templates
🔹 Construction Project Cost Dashboard in Excel — Pivot-powered Excel cost analytics.
🔹 Construction Dashboard in HTML — Browser-based construction project tracking.
🔹 Construction Project Timeline Calendar in Excel — Timeline and milestone tracking.
📖 Click here to read the Detailed Blog Post
Watch the step-by-step video tutorial:


Reviews
There are no reviews yet.