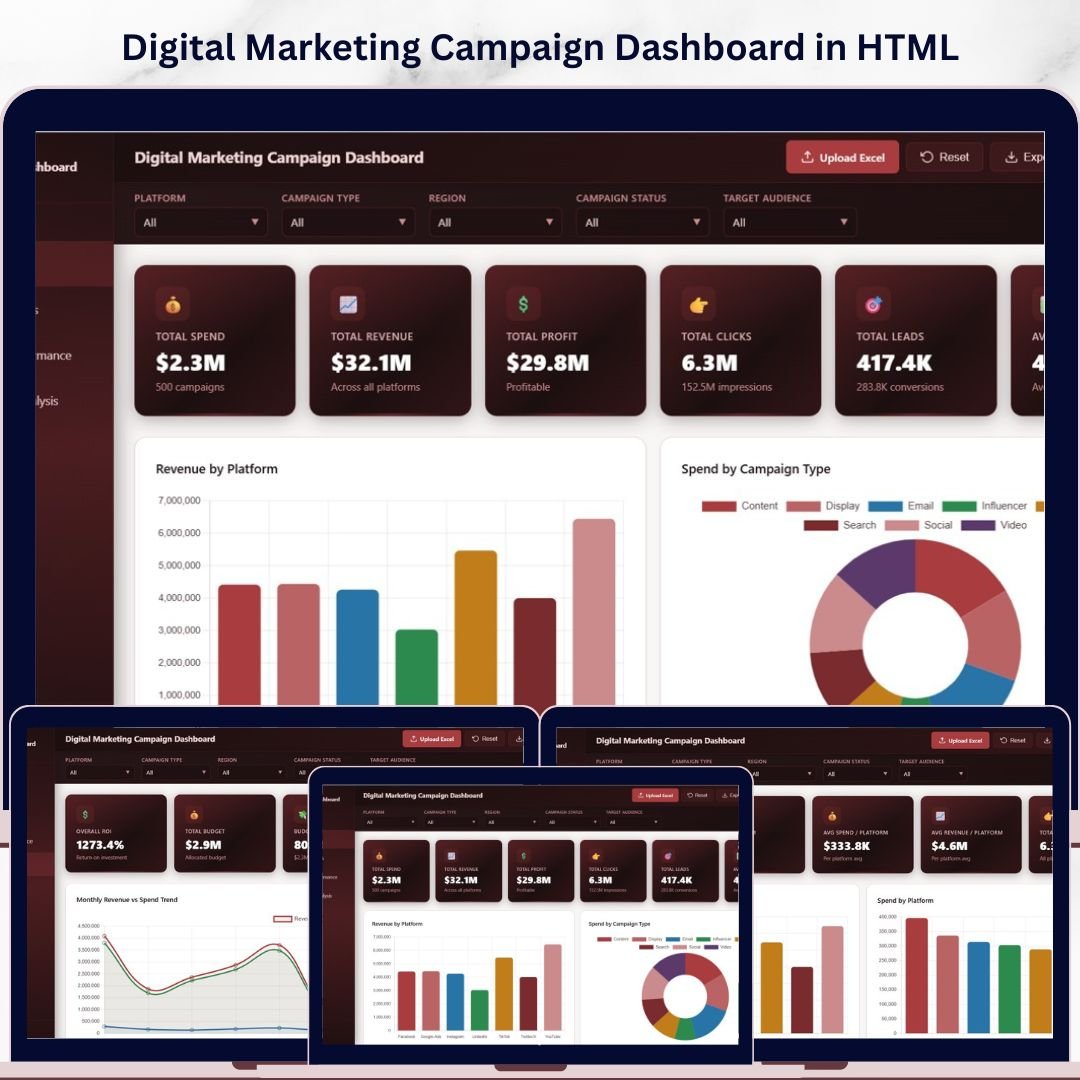


🔑 Key Features of the Digital Marketing Campaign Dashboard in HTML
The Digital Marketing Campaign Dashboard in HTML is a powerful, browser-based analytics template designed for marketing managers, digital agencies, and business owners who want to visualize every aspect of their marketing campaign performance in one centralized view. This template includes 5 interactive dashboard pages tracking critical marketing metrics including Total Spend, Total Revenue, Total Profit, Total Clicks, Total Leads, and Average Bounce Rate. Whether you manage campaigns across Google Ads, Facebook, Instagram, or LinkedIn, this HTML Dashboard transforms raw campaign data into clear, actionable visual insights.
Built entirely in HTML, CSS, and JavaScript, this digital marketing analytics template features dynamic slicers for instant filtering, interactive cross-highlighting across all visuals, and a professional multi-tab design that makes data easy to navigate. Explore more marketing analytics templates in our Marketing Templates collection.
📦 What’s Inside the Digital Marketing Campaign Dashboard in HTML
📌 5 Interactive Dashboard Pages – Overview, Platform Analysis, Campaign Performance, ROI and Trend Analysis, and Data View, each packed with dynamic visuals and KPI cards.
📌 6 KPI Summary Cards – Total Spend, Total Revenue, Total Profit, Total Clicks, Total Leads, and Avg Bounce Rate displayed prominently on the Overview page for instant campaign health assessment.
📌 Dynamic Slicers and Filters – Multiple slicers on the Overview page let you filter the entire dashboard by platform, campaign type, region, and more for quick drill-down analysis.
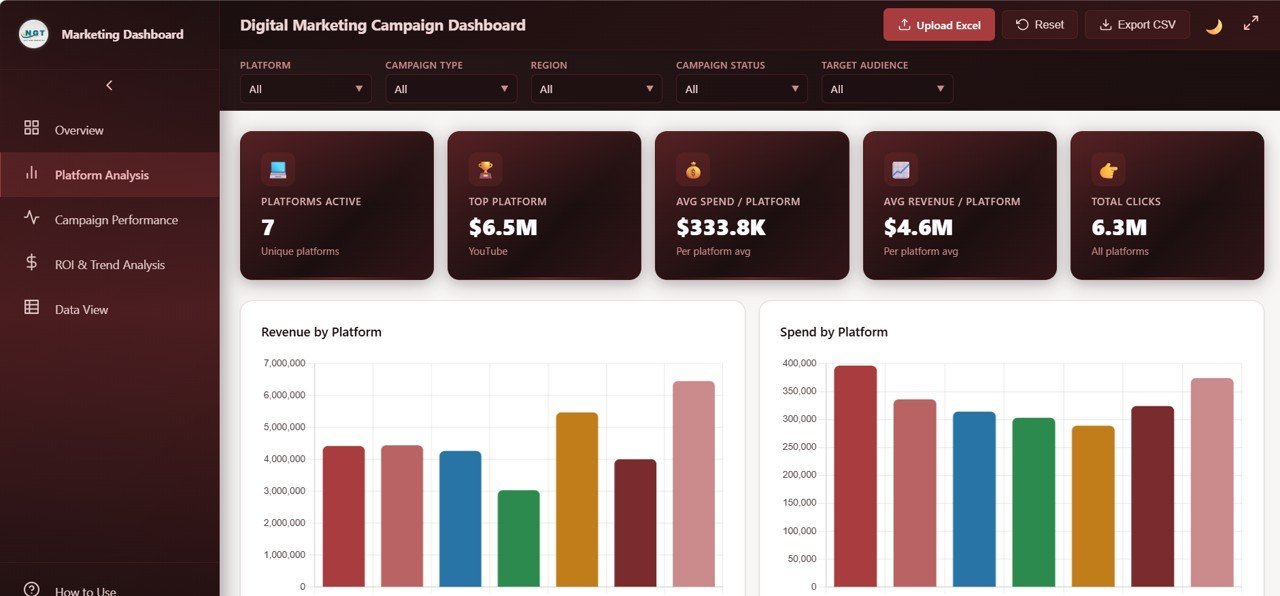
📌 Platform-Level Breakdown – The Platform Analysis page provides Revenue by Platform, Spend by Platform, Clicks by Platform, Conversions by Platform, and Profit by Platform so you can compare channel performance side by side.
📌 Campaign Performance Insights – Analyze Revenue by Campaign Type, Conversions by Target Audience, Leads by Ad Format, Revenue by Manager, and Spend by Target Audience to understand which strategies drive results.
📌 ROI and Trend Analysis – Track Monthly Revenue vs Spend Trend, Profit by Region, Budget vs Spend by Platform, ROI by Campaign Type, and Cost Per Lead by Platform for deep financial insights.
📌 Data View with Export – The detailed data table page lets you see all records with search, sort, and pagination features. Export filtered data to CSV for further analysis.
📌 Works in Any Modern Browser – No software installation needed. Simply open the HTML file in Chrome, Edge, Firefox, or Safari and start analyzing your campaigns instantly.
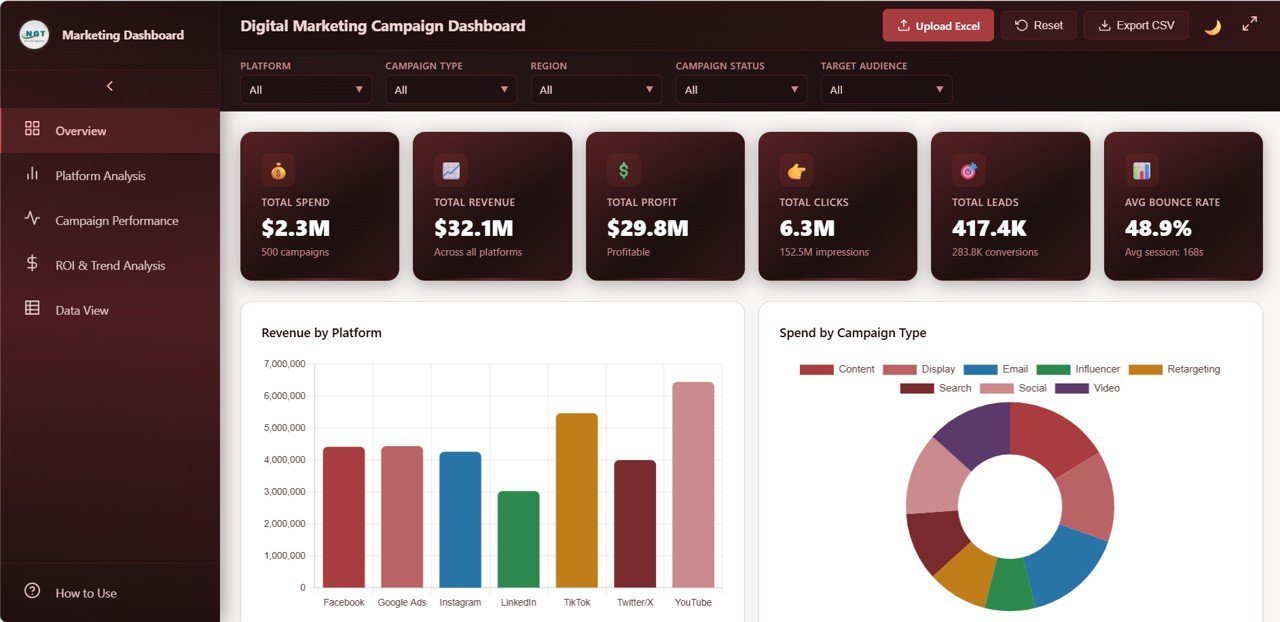 Digital Marketing Campaign Dashboard – Overview
 Digital Marketing Campaign Dashboard – Platform Analysis
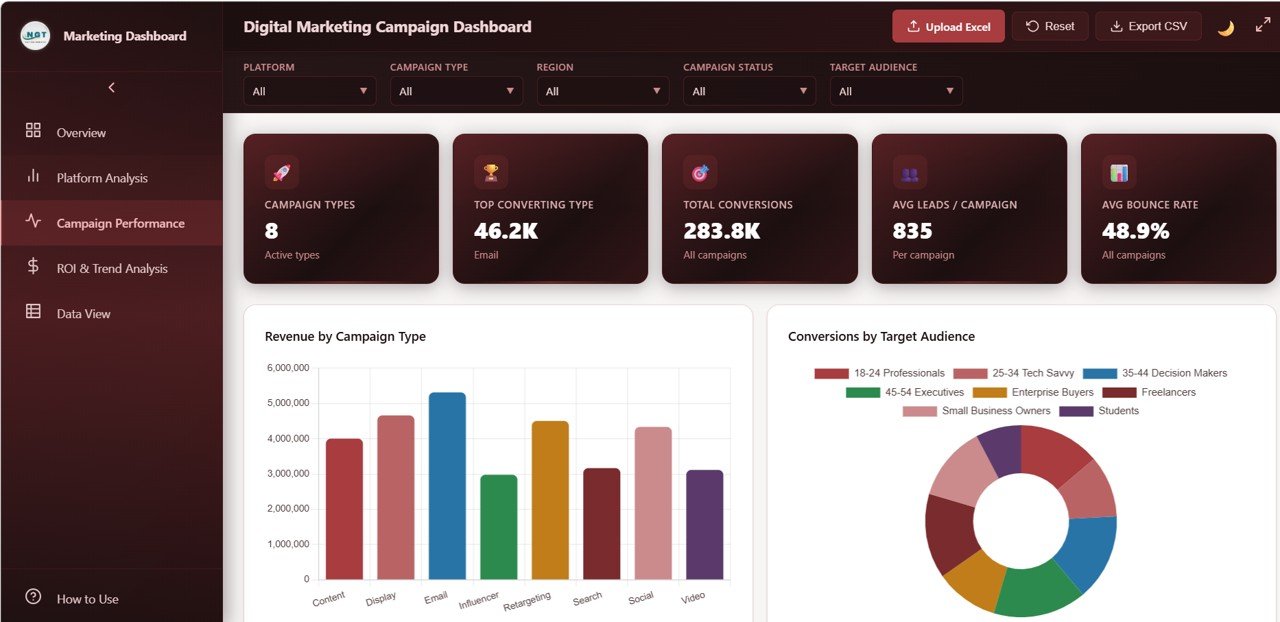 Digital Marketing Campaign Dashboard – Campaign Performance
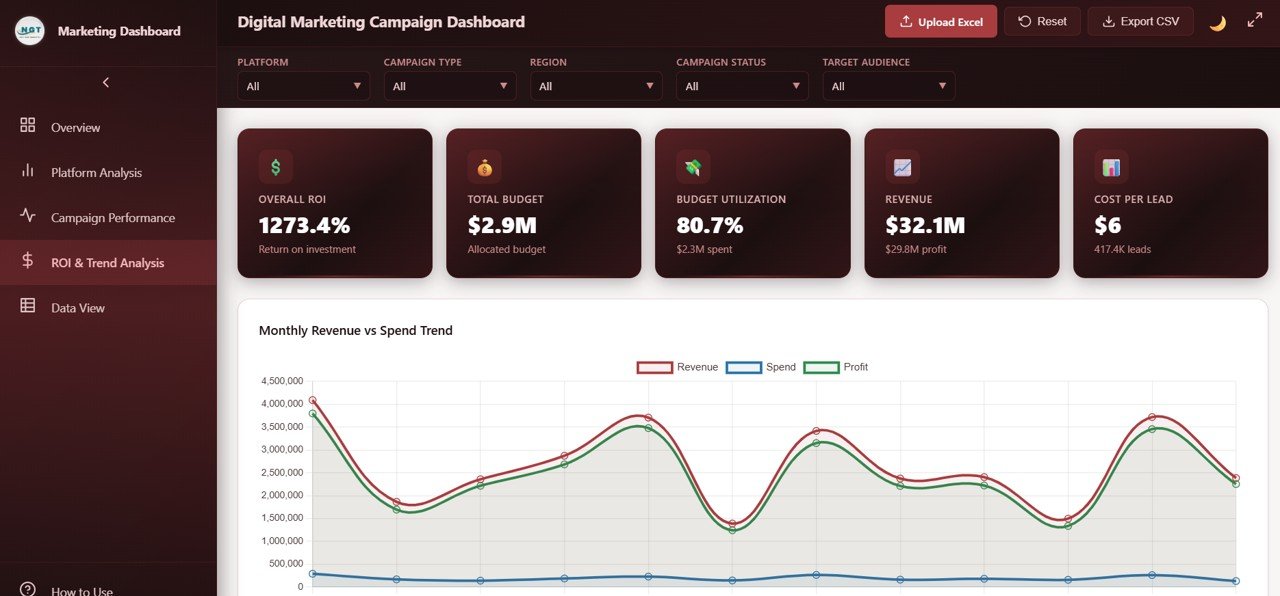 Digital Marketing Campaign Dashboard – ROI and Trend Analysis
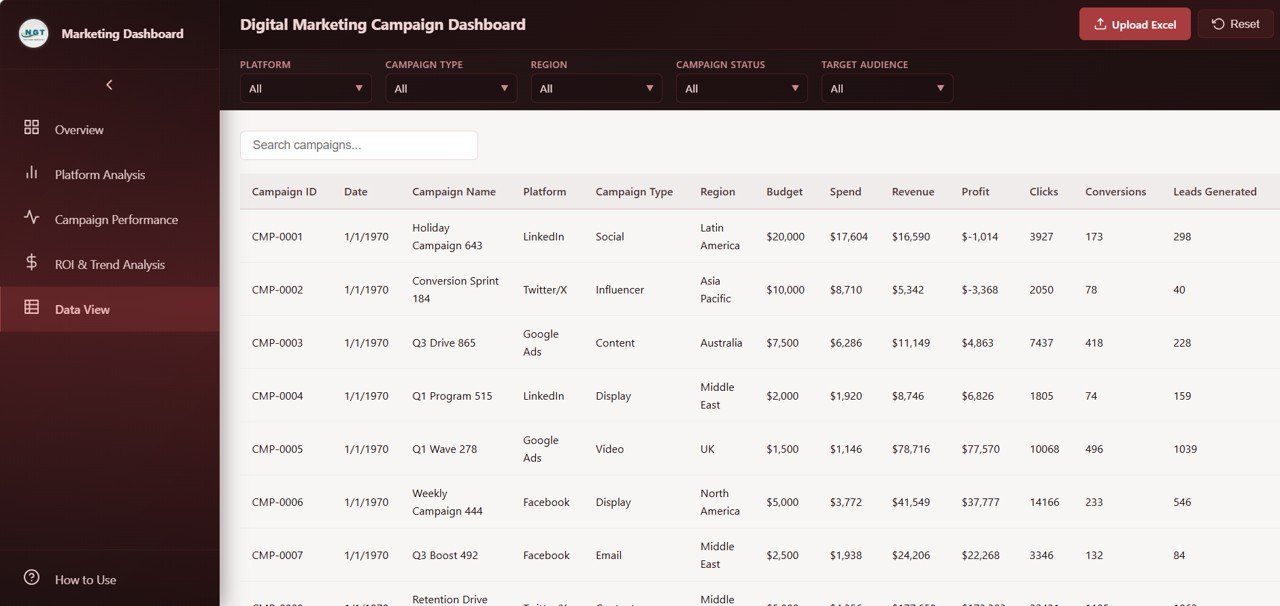 Digital Marketing Campaign Dashboard – Data View
⚙️ How to Use the Digital Marketing Campaign Dashboard in HTML
1️⃣ Download and unzip the file to your computer.
2️⃣ Open the index.html file in any modern web browser such as Chrome, Edge, or Firefox.
3️⃣ Explore the 5 dashboard tabs — Overview, Platform Analysis, Campaign Performance, ROI and Trend Analysis, and Data View.
4️⃣ Use the dynamic slicers and filters to drill down into specific platforms, regions, campaign types, or time periods.
5️⃣ Replace the sample data in the data file with your own marketing campaign data and the dashboard updates automatically.
6️⃣ Export filtered data from the Data View tab to CSV for reporting or sharing with your team.
👥 Who Can Benefit from This Digital Marketing Campaign Dashboard
🎯 Digital Marketing Managers – Track campaign ROI, spend allocation, and lead generation across all platforms in one dashboard.
🎯 Marketing Agencies – Present client campaign performance with professional visuals and exportable data.
🎯 Small Business Owners – Monitor advertising spend and revenue without expensive BI tools or subscriptions.
🎯 CMOs and Marketing Directors – Get high-level overviews with the ability to drill down into platform and campaign details.
🎯 Freelance Marketers – Impress clients with a polished, interactive campaign performance report. Check out the Freelancer Business Dashboard in Google Sheets for managing your freelance business too.
❓ Frequently Asked Questions
What KPIs does the Digital Marketing Campaign Dashboard in HTML track?
The Digital Marketing Campaign Dashboard in HTML tracks 6 key performance indicators including Total Spend, Total Revenue, Total Profit, Total Clicks, Total Leads, and Average Bounce Rate. It also provides detailed breakdowns by platform, campaign type, region, ad format, target audience, and campaign manager.
Do I need any special software to use this HTML dashboard?
No. Simply open the index.html file in any modern web browser like Chrome, Edge, Firefox, or Safari. No installation, licenses, or subscriptions required.
Can I replace the sample data with my own marketing data?
Yes. The dashboard comes with a structured data file. Replace the sample records with your own campaign data and all charts, KPIs, and tables update automatically.
How many dashboard pages does this template include?
This template includes 5 interactive pages: Overview, Platform Analysis, Campaign Performance, ROI and Trend Analysis, and Data View with search, sort, pagination, and CSV export features.
Is this dashboard available in other platforms like Excel or Power BI?
Yes. We also offer the Digital Marketing Campaign Dashboard in Excel, Digital Marketing Campaign Dashboard in Power BI, and Digital Marketing Campaign Dashboard in Google Sheets.
What is the best HTML dashboard template for tracking digital marketing campaigns?
The Digital Marketing Campaign Dashboard in HTML from NextGenTemplates is one of the best options available. It provides 5 interactive pages covering campaign overview, platform comparison, campaign performance analysis, ROI trends, and a full data view with export capability — all running directly in your browser with no software needed.
🔗 Explore Related Templates
📊 Digital Marketing Campaign Dashboard in Excel – The same powerful marketing analytics in Microsoft Excel format with pivot tables and charts.
📊 Digital Marketing Campaign Dashboard in Power BI – Advanced interactive marketing dashboard with Power BI Desktop.
📊 Sales and Revenue Command Center Dashboard in HTML – Track your sales pipeline and revenue trends in a browser-based dashboard.
📖 Click here to read the Detailed Blog Post about the Digital Marketing Campaign Dashboard in HTML
🎥 Visit our YouTube channel to learn step-by-step video tutorials
👉 YouTube.com/@NextGenTemplates


Reviews
There are no reviews yet.