



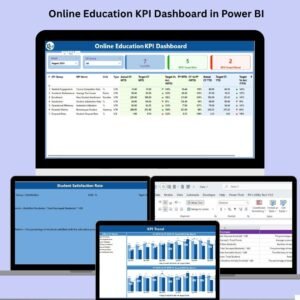
The Education KPI Dashboard in Power BI is a robust tool designed for educational institutions, administrators, and educators who want to track and optimize performance across various metrics. This customizable Power BI dashboard provides real-time insights into key performance indicators (KPIs) such as student performance, attendance rates, course completion rates, faculty performance, and budget utilization.
With the Education KPI Dashboard in Power BI, you can easily monitor student progress, faculty efficiency, and institutional financials, helping you make informed decisions that improve educational outcomes, optimize resource allocation, and ensure operational efficiency. Whether you’re managing a K-12 school, a college, or a training center, this dashboard provides an intuitive and powerful solution for tracking and enhancing educational performance.
Key Features of the Education KPI Dashboard in Power BI
📊 Comprehensive Education Tracking
Track essential KPIs such as student grades, attendance rates, dropout rates, and course completion. Gain insights into student performance and overall academic success across various metrics.
⚡ Real-Time Performance Monitoring
Monitor academic performance, attendance, and faculty metrics in real time, allowing you to address any issues promptly and make data-driven decisions to improve educational outcomes.
📈 Faculty & Course Performance Insights
Evaluate faculty performance, student engagement, and course completion rates. Analyze how different courses are performing and identify areas where improvements can be made.
📅 Student & Enrollment Trends
Track student enrollment patterns, retention rates, and demographic trends to better understand your student population and identify any gaps in student achievement or engagement.
🖥️ Interactive & User-Friendly Interface
The Power BI dashboard offers an interactive and user-friendly interface, featuring dynamic charts, filters, and slicers to explore data and track performance across multiple educational metrics.
Why You’ll Love the Education KPI Dashboard in Power BI

✅ Track Student Performance & Progress
Monitor student grades, course completion rates, and overall academic performance. Identify students at risk and ensure that necessary interventions are implemented.
✅ Optimize Faculty & Course Delivery
Track faculty performance, engagement, and course effectiveness. Identify high-performing faculty and underperforming courses to optimize instructional strategies and improve teaching outcomes.
✅ Improve Attendance & Retention
Analyze student attendance rates and retention trends to ensure that students stay engaged and complete their courses on time. Make proactive decisions to address any attendance-related issues.
✅ Streamline Budget & Resource Management
Monitor budget utilization and resource allocation within educational institutions. Ensure that financial resources are being used effectively to improve educational delivery.
✅ Make Data-Driven Educational Decisions
Use insights from the dashboard to make informed decisions on curriculum development, faculty training, student support services, and operational improvements.
What’s Inside the Education KPI Dashboard Template?
- Student Performance Tracking: Monitor student grades, course completion rates, and academic progress.
- Attendance & Retention Analysis: Track student attendance rates and identify at-risk students.
- Faculty & Course Performance: Evaluate faculty performance, student engagement, and course delivery success.
- Budget & Resource Allocation: Analyze institutional budget utilization and resource management.
- Real-Time Data Insights: Access real-time updates on all KPIs, ensuring timely decision-making.
- Customizable KPIs: Adjust the dashboard to track educational metrics specific to your institution or program.
How to Use the Education KPI Dashboard in Power BI
1️⃣ Download the Template: Get instant access to your Education KPI Dashboard in Power BI.
2️⃣ Input Data: Enter academic, attendance, faculty, and financial data into the dashboard.
3️⃣ Track & Monitor KPIs: Use the dashboard to monitor performance, track student progress, and analyze faculty efficiency in real time.
4️⃣ Analyze & Optimize: Leverage insights from the dashboard to make data-driven decisions about curriculum design, student engagement, and resource allocation.
Who Can Benefit from the Education KPI Dashboard in Power BI?
🔹 School & College Administrators
🔹 Educators & Faculty Members
🔹 Student Support & Engagement Teams
🔹 Curriculum Designers & Educational Consultants
🔹 Data Analysts in Educational Institutions
🔹 Anyone Involved in Managing and Enhancing Educational Performance
Track, analyze, and optimize educational performance with the Education KPI Dashboard in Power BI. Monitor student outcomes, faculty performance, and financial metrics to ensure that your institution is delivering the best possible education and achieving academic success.
Click here to read the Detailed blog post
Visit our YouTube channel to learn step-by-step video tutorials
Youtube.com/@PKAnExcelExpert
Compatibility and Requirements
- Opens in Power BI Desktop, which is free to download from Microsoft.
- Microsoft has the download and setup steps in Get Power BI Desktop.
Frequently Asked Questions
What does the Education KPI Dashboard track?
It tracks student grades, course completion and academic progress, attendance and retention, faculty and course performance, and budget and resource use.
Can I change the KPIs?
Yes. You can adjust the dashboard to track educational metrics specific to your institution or program.
What data do I enter?
You enter academic, attendance, faculty and financial data. The dashboard then shows the results in its charts.
What software do I need?
Power BI Desktop, which is free to download from Microsoft.
Is there an Excel or Google Sheets version?
Yes. See the Education KPI Dashboard in Excel and the Education KPI Dashboard in Google Sheets.
Related Education Templates
- Education KPI Dashboard in Excel: the same KPIs in Excel
- Education KPI Dashboard in Google Sheets: the Google Sheets edition
- Education KPI Scorecard in Excel: a scorecard view of education KPIs
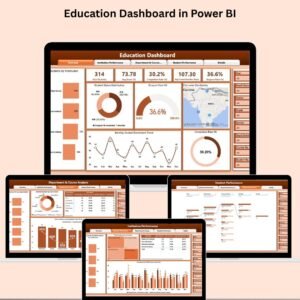
- Education Dashboard in Power BI: a full education dashboard in Power BI
- Education & School Management Bundle: 8 school templates for Excel and Google Sheets
Browse all Power BI KPI dashboards.























Reviews
There are no reviews yet.