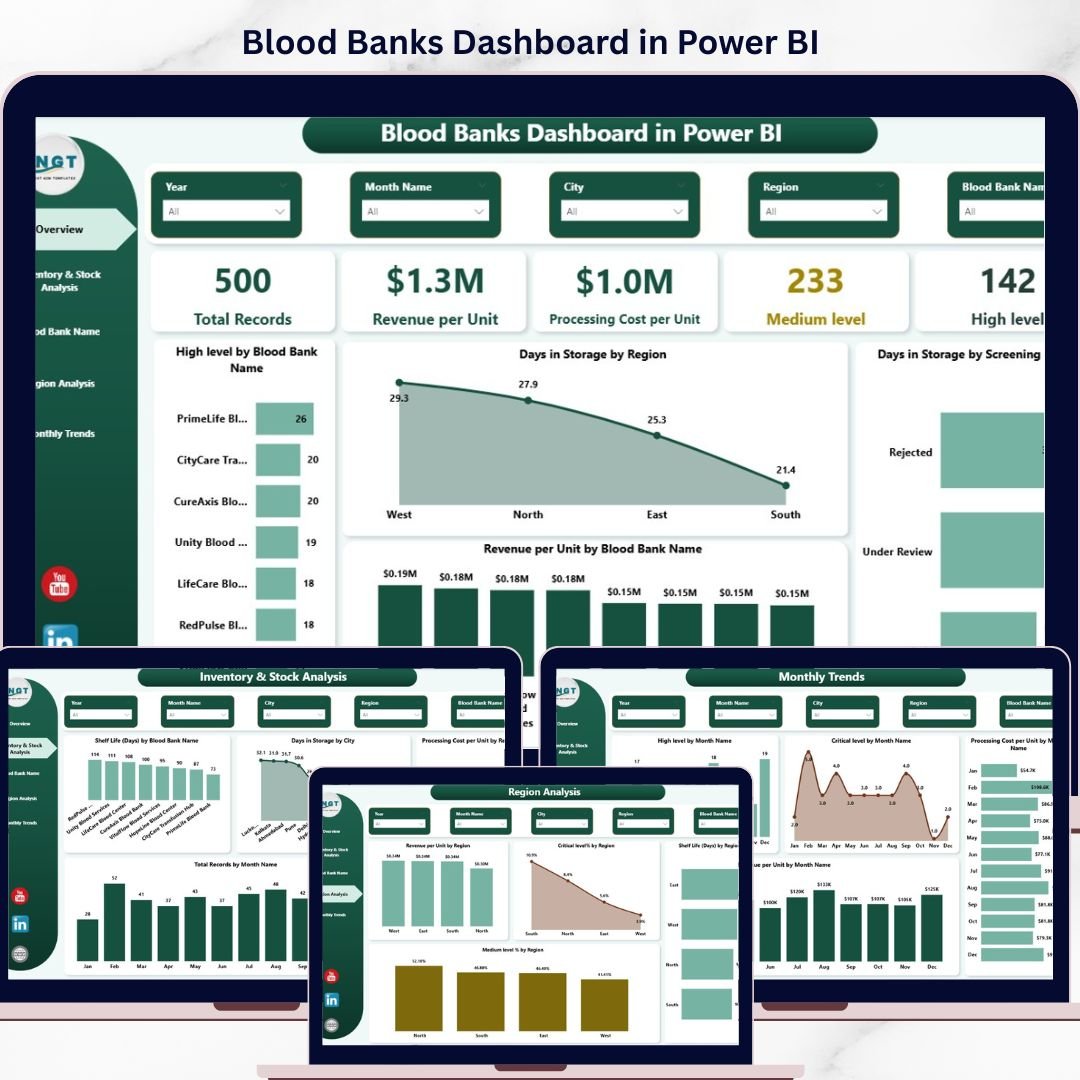

Blood Banks Dashboard in Power BI is the ultimate data analytics solution designed for healthcare professionals and blood bank administrators who want to monitor operations with precision. If you are managing donor data, tracking inventory levels, analyzing revenue trends, or overseeing multiple blood bank locations — this Power BI dashboard delivers everything you need in one interactive report. 🚀
With five beautifully designed analytical pages, this dashboard transforms raw blood bank data into actionable insights. Every chart, card, and visual element is designed to help you make faster, more confident decisions. From high-level overviews to deep-dive analysis by region and blood bank — you get a 360-degree view of your operations instantly.
Whether you run a standalone blood bank or manage multiple locations across different cities, this healthcare dashboard adapts perfectly to your needs without requiring expensive custom software.
🔑 Key Features of Blood Banks Dashboard in Power BI
📊 Dynamic KPI Cards for Instant Insights
Monitor Total Records, Revenue per Unit, Processing Cost per Unit, and urgency levels (Medium Level and High Level) at a single glance.
📈 Interactive Charts and Visuals
Explore trends like storage duration, revenue distribution, shelf life, and cost variations across regions, blood banks, and time periods effortlessly.
🎯 Advanced Slicers and Filters
Quickly filter data by region, blood bank name, screening status, city, or time period for targeted analysis and deeper operational insights.
⚡ 5 Comprehensive Analytical Pages
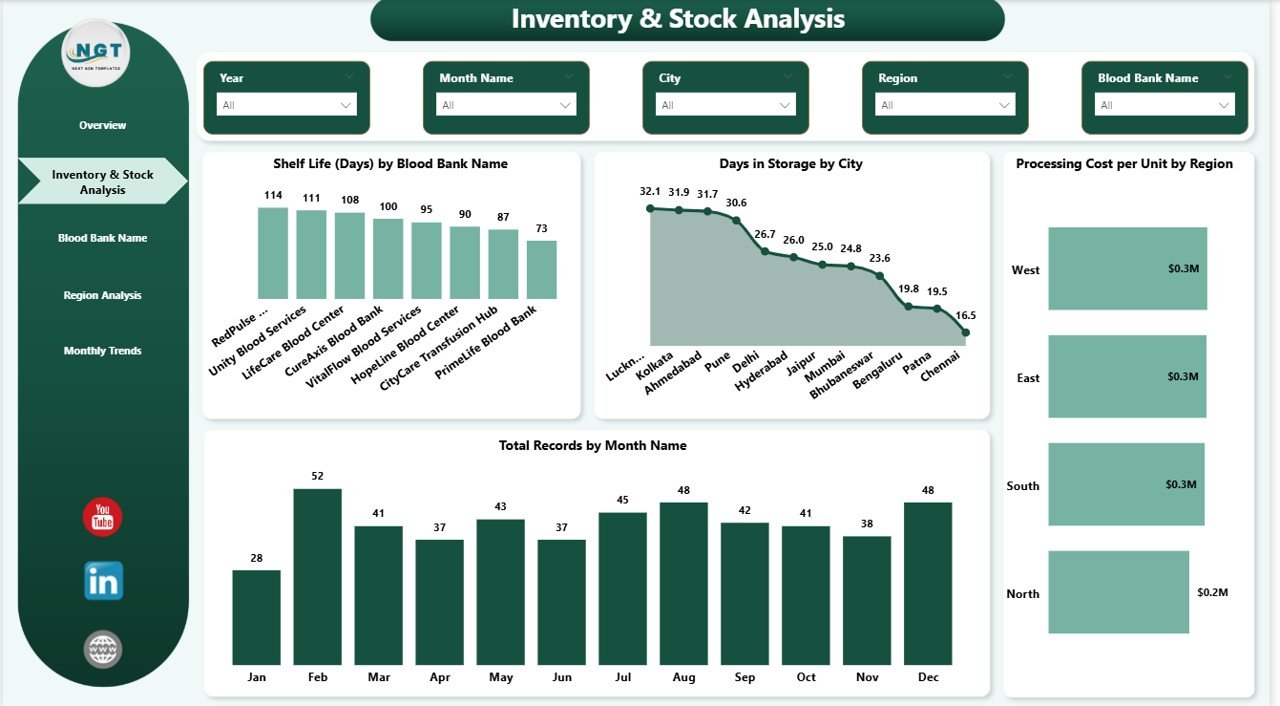
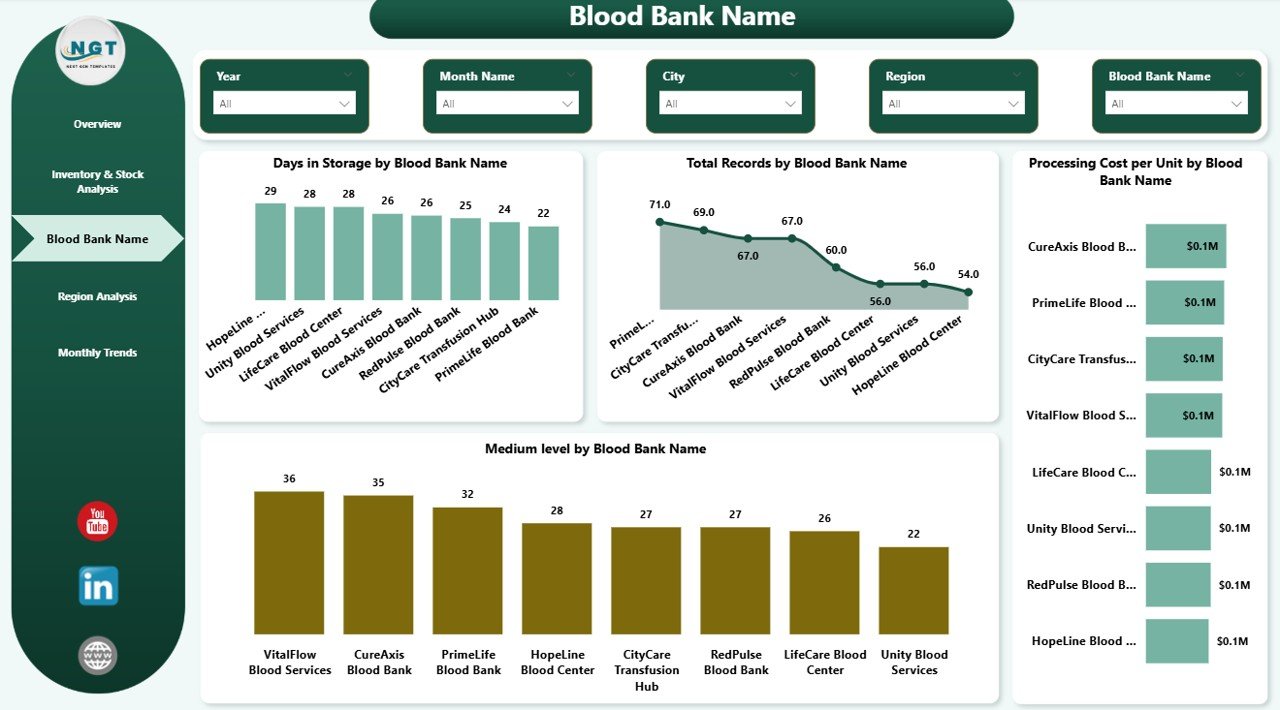
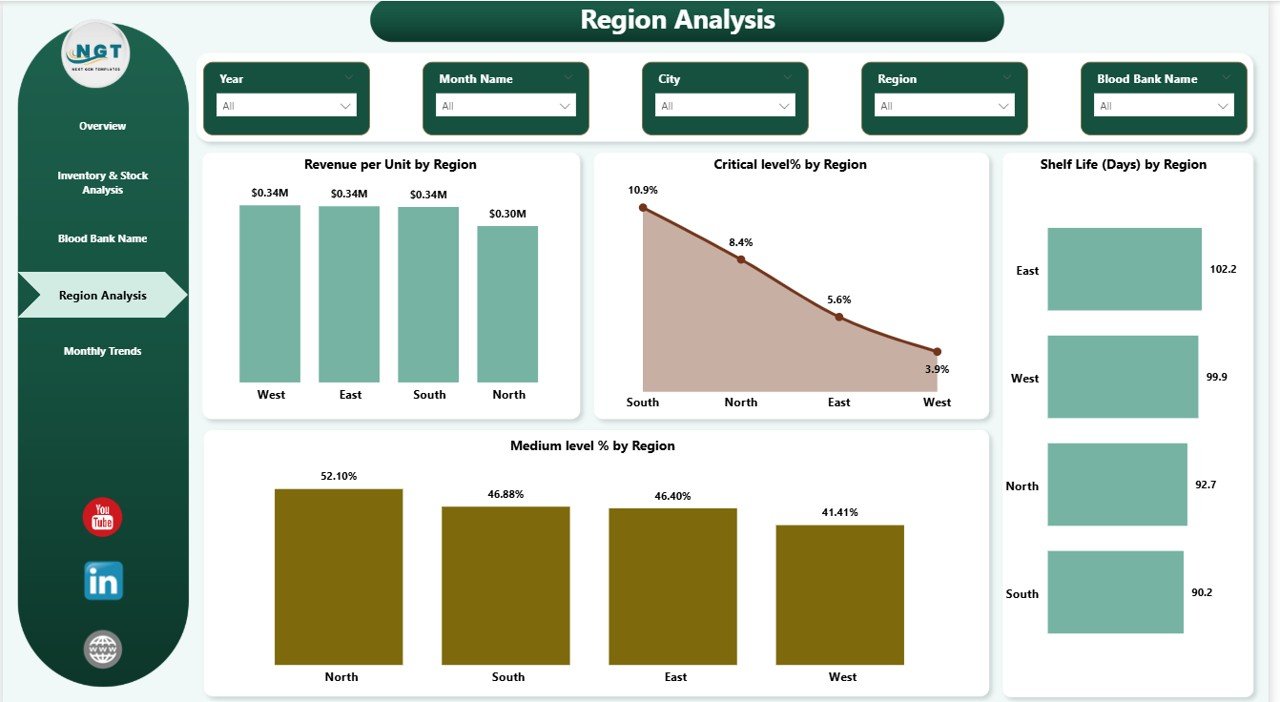
Includes Overview, Inventory & Stock Analysis, Blood Bank Analysis, Region Analysis, and Monthly Trends — each designed for a specific analytical purpose.
🧩 Multi-Dimensional Analysis
Compare performance across hospital partners, cities, regions, and individual blood banks with visually compelling breakdowns.
💡 Fully Customizable Design
Easily modify the dashboard visuals, color themes, and data connections to match your organization’s specific reporting needs.
🔄 Seamless Data Connectivity
Connect to Excel, SQL databases, or cloud sources — Power BI refreshes the entire dashboard automatically with a single click.
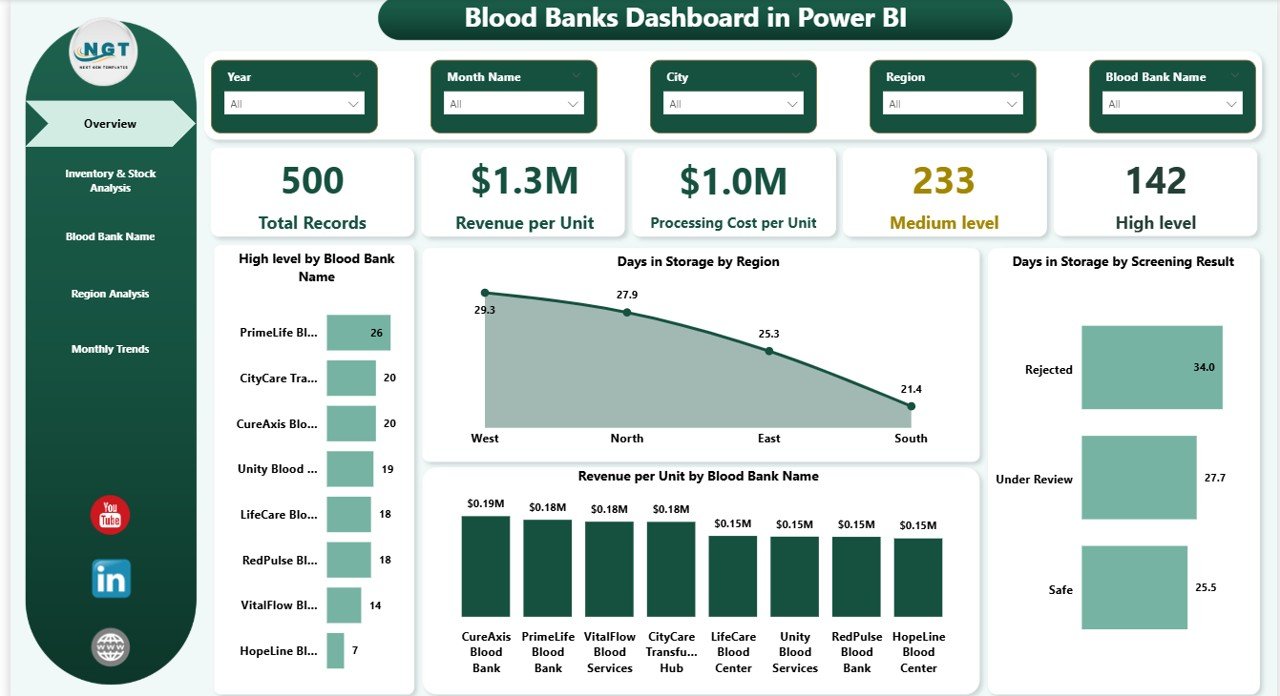
Blood Banks Dashboard in Power BI — Overview Page
📦 What’s Inside the Blood Banks Dashboard in Power BI
📁 5 Structured Report Pages
Includes Overview, Inventory & Stock Analysis, Blood Bank Name Analysis, Region Analysis, and Monthly Trends — each packed with insightful visuals.
📊 Pre-Built Charts and KPI Cards
Ready-to-use visuals covering revenue, cost, storage duration, shelf life, screening status, and urgency level metrics.
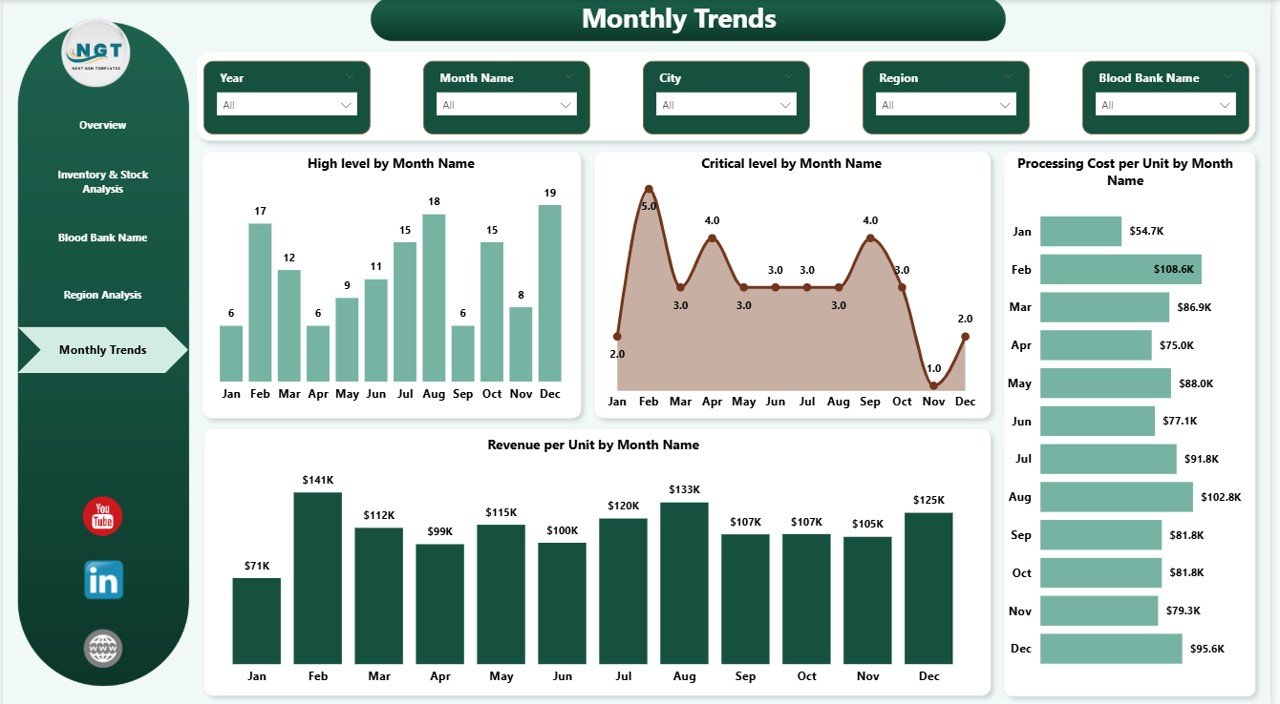
📅 Time-Based Trend Analysis
Track monthly performance patterns including total records, high-level counts, critical-level counts, and revenue variations over time.
📍 Region and City-Level Insights
Drill down into regional and city-level trends to identify operational strengths and areas for improvement.
🏥 Hospital Partner Revenue Tracking
Understand which hospital collaborations generate the highest revenue per unit and optimize partnerships accordingly.
🔒 Screening Status Analysis
Analyze storage duration by screening outcomes to improve quality control and compliance reporting.
⚙️ How to Use the Blood Banks Dashboard in Power BI
1️⃣ Download and open the .pbix file in Microsoft Power BI Desktop.
2️⃣ Connect your own data source (Excel, CSV, or database) using the Power BI data import wizard.
3️⃣ Map your data columns to the existing data model structure.
4️⃣ Hit Refresh to update all visuals with your latest data instantly.
5️⃣ Use the slicers and filters on each page to drill down into specific data segments for targeted analysis.
No advanced Power BI skills required — this dashboard template is designed to be intuitive and user-friendly. 😊
👥 Who Can Benefit from This Blood Banks Dashboard in Power BI
🏥 Blood Bank Managers looking to track inventory, costs, and performance across locations
📊 Healthcare Data Analysts who need powerful visualizations for operational reporting
🏢 Hospital Administrators managing partnerships with multiple blood banks
📈 Regional Health Officers tracking blood supply chain metrics across cities and regions
🎓 Students and Professionals learning Power BI dashboarding with real-world healthcare data
💼 NGOs and Government Health Departments aiming to improve blood bank management efficiency
This dashboard is not just a reporting tool — it is a complete decision-making solution that empowers you to optimize inventory, reduce processing costs, and improve operational efficiency across your entire blood bank network. 💡
Stop relying on manual reports and start making smarter, data-driven decisions with this powerful Power BI dashboard today. 🚀
📖 Click here to read the Detailed Blog Post
Watch the step-by-step video tutorial:


Reviews
There are no reviews yet.