


Key Features of Upselling KPI Dashboard in Google Sheets
Unlock the power of data-driven decision-making with our Upselling KPI Dashboard in Google Sheets – a comprehensive, ready-to-use template designed to track and optimize your upselling strategies effortlessly. This dashboard is crafted specifically for businesses aiming to boost sales performance by closely monitoring key performance indicators (KPIs) with clarity and precision.
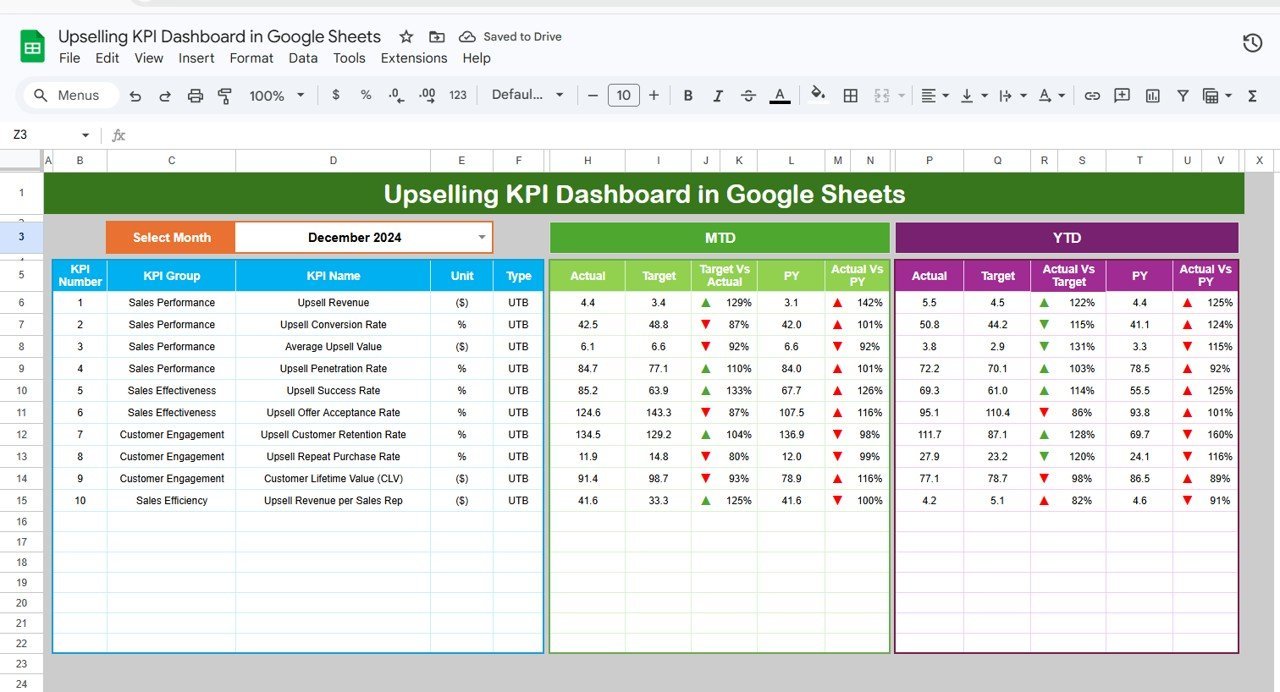
With six meticulously designed worksheets, you gain a clear visualization of your upselling KPIs, making it easier than ever to pinpoint opportunities and measure success. The Dashboard sheet offers an interactive month selector that dynamically updates all KPI metrics, including Month-to-Date (MTD) Actual, Target, and Previous Year data, alongside Year-to-Date (YTD) comparisons. Conditional formatting with intuitive up/down arrows highlights performance trends instantly.
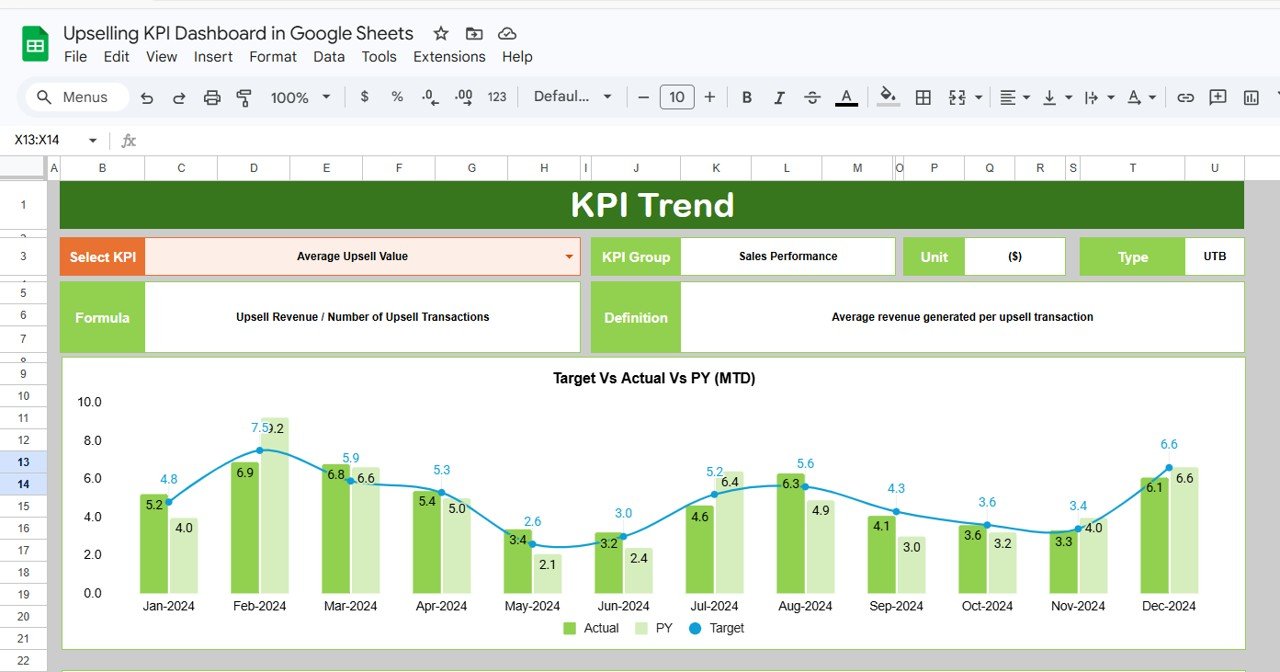
The KPI Trend sheet provides a deep dive into individual KPIs, displaying essential details such as KPI Group, Unit, KPI Type (Lower the Better or Upper the Better), Formula, and Definition. Interactive MTD and YTD trend charts visualize Actual, Target, and Previous Year numbers for quick insights.
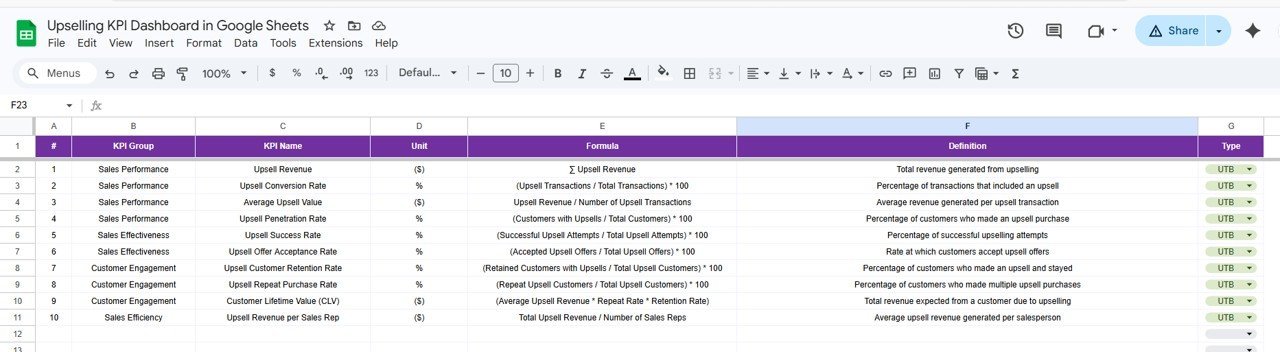
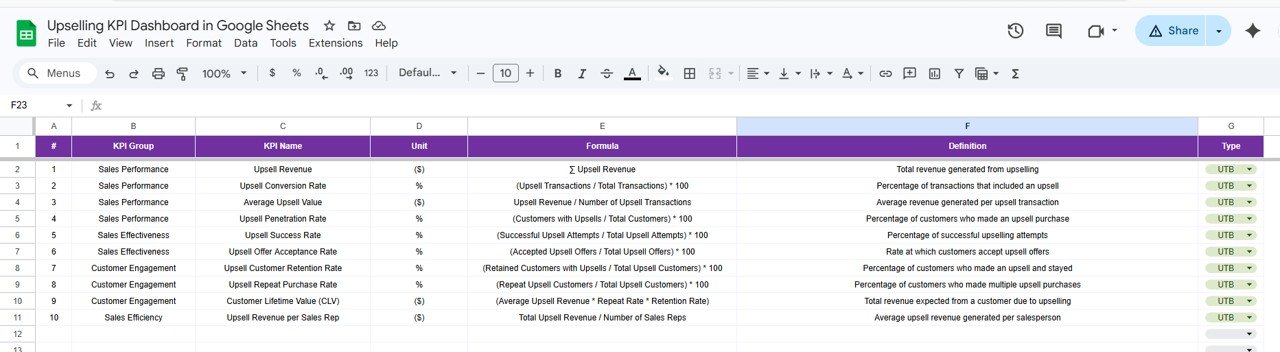
Input sheets for Actual Numbers, Target Numbers, and Previous Year Numbers allow seamless, organized data entry. Easily adjust months and update figures to keep your dashboard current and relevant. The KPI Definition sheet ensures all KPIs are clearly defined and categorized, supporting accurate data interpretation and reporting.
What’s Inside the Upselling KPI Dashboard in Google Sheets
- 📊 Dashboard Sheet: Central hub displaying all KPIs with dynamic month selection and conditional formatting for quick visual insights.
- 📈 KPI Trend Sheet: Detailed KPI analysis with definitions, formulas, and trend charts for MTD and YTD performance.
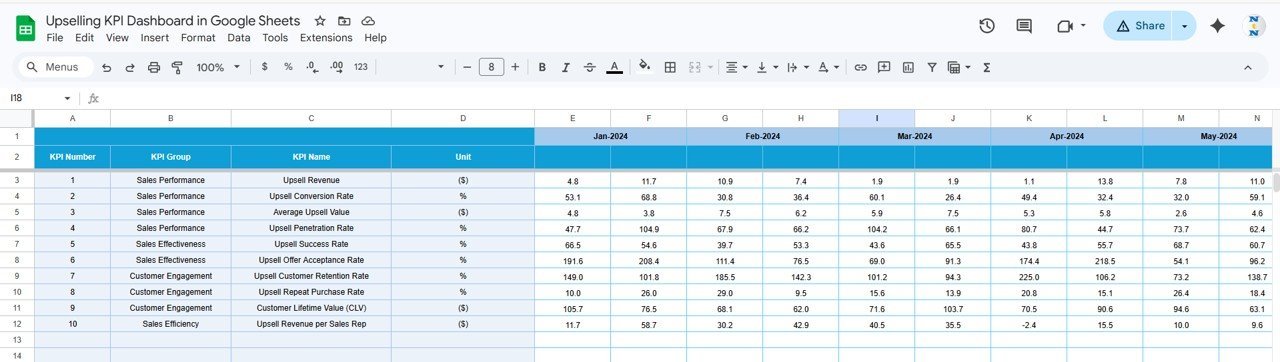
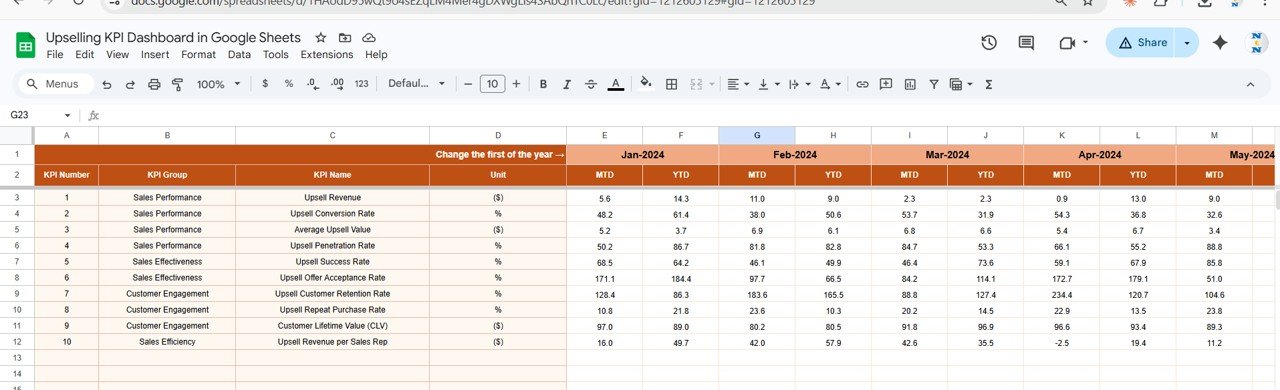
- ✍️ Actual Numbers Input: User-friendly data entry for current year’s MTD and YTD actuals with flexible month settings.
- 🎯 Target Number Input: Input target values for each KPI, enabling precise performance tracking against goals.
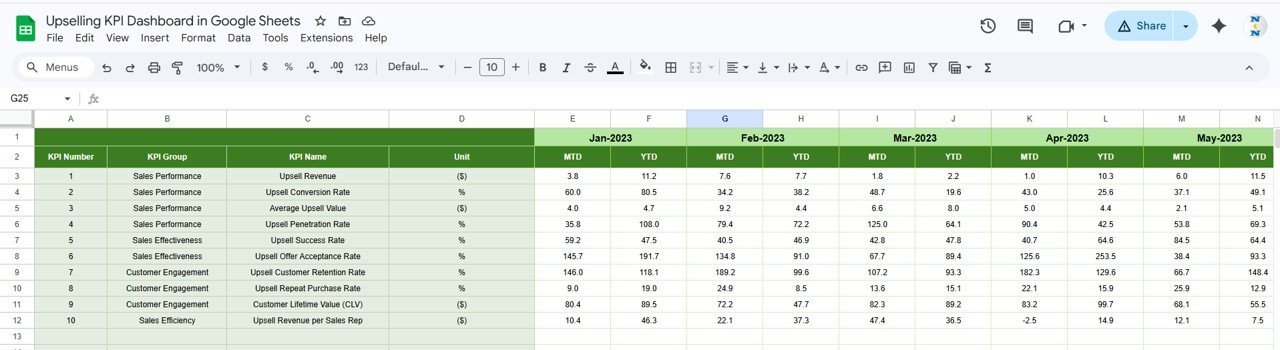
- 📅 Previous Year Number Input: Enter last year’s data for meaningful year-over-year comparisons.
- 📚 KPI Definition Sheet: Maintain clear KPI names, groups, units, formulas, and specify whether lower or upper values are better.
How to Use the Upselling KPI Dashboard in Google Sheets
Getting started with the Upselling KPI Dashboard is straightforward and user-friendly. Follow these simple steps to harness the full potential of this tool:
- 🗓️ Select the Month: Use the dropdown on the Dashboard sheet (cell D3) to choose the month you want to analyze. The entire dashboard updates automatically.
- ✏️ Enter Actual Numbers: Input your Month-to-Date and Year-to-Date real sales data in the Actual Numbers Input sheet, adjusting the starting month if needed.
- 🎯 Set Targets: Fill in your monthly and yearly target figures for each KPI on the Target Number Input sheet to establish benchmarks.
- 📊 Input Previous Year Data: Add last year’s numbers for accurate comparison and trend analysis.
- 🔍 Review KPI Trends: Explore the KPI Trend sheet to analyze individual KPIs with detailed insights and visual trend charts.
- 📝 Define or Edit KPIs: Use the KPI Definition sheet to add or modify KPI details, ensuring your dashboard reflects the latest business metrics.
- 📈 Analyze and Act: Monitor the dashboard regularly to identify upselling opportunities, track progress, and make informed decisions that fuel growth.
Who Can Benefit from This Upselling KPI Dashboard in Google Sheets
- 🏢 Sales Managers: Track team performance, set realistic targets, and motivate upselling efforts with clear KPI insights.
- 📊 Business Analysts: Gain a robust data visualization tool that simplifies complex upselling metrics into actionable intelligence.
- 📈 Marketing Teams: Understand how upselling KPIs intersect with campaigns to optimize customer engagement and revenue.
- 🧑💼 Small to Medium Enterprises: Affordable, easy-to-use dashboard solution for businesses seeking to improve sales without expensive software.
- 👩💻 Freelancers & Consultants: Provide clients with a professional upselling KPI tracking system that adds value and drives results.
- 💼 Executives & Decision Makers: Quickly assess company health and upselling effectiveness to steer strategic planning.
Designed for simplicity yet rich in functionality, this Upselling KPI Dashboard in Google Sheets empowers you to stay ahead of sales targets, boost profitability, and make smarter business decisions with confidence.
Upselling KPI Dashboard in Google Sheets
KPI Trend Sheet

Actual Numbers Input Sheet

Target Number Input Sheet
Previous Year Number Input Sheet
KPI Definition Sheet
Click here to read the Detailed blog post.
Visit our YouTube channel to learn step-by-step video tutorials.


Reviews
There are no reviews yet.