

The IT Infrastructure KPI Dashboard in Excel is an essential tool for IT managers, system administrators, and business owners who want to track, monitor, and optimize the performance of their IT infrastructure. This customizable dashboard allows you to measure key performance indicators (KPIs) such as server uptime, network performance, incident response times, system health, and resource utilization, ensuring that your IT systems run smoothly and efficiently.
With real-time data tracking and comprehensive reporting, the dashboard helps you identify potential issues, monitor system health, and optimize resource allocation. Whether you’re managing on-premises infrastructure, cloud services, or hybrid systems, this Excel-based dashboard provides the insights you need to ensure that your IT infrastructure supports business continuity and growth.
Key Features of the IT Infrastructure KPI Dashboard in Excel
🖥️ Comprehensive IT Infrastructure Tracking
Track critical KPIs related to IT infrastructure, including server uptime, network health, storage usage, and system performance. Gain a holistic view of your infrastructure’s effectiveness and reliability.
⚡ Real-Time System Monitoring
Monitor system health and performance metrics in real-time, identifying issues such as server downtimes, network outages, or storage bottlenecks. Proactively address problems before they impact business operations.
📈 Incident Management & Response Tracking
Analyze incident response times, downtime causes, and recovery efforts. Track the efficiency of your IT support team and improve service delivery to minimize disruptions to business operations.
📅 Customizable KPIs for IT Operations
Adjust the dashboard to track KPIs specific to your IT infrastructure, such as cloud service metrics, hardware performance, or incident resolution times, tailoring the dashboard to your unique infrastructure setup.
🖥️ Interactive & User-Friendly Interface
The dashboard is designed with simplicity and ease of use in mind, offering an interactive interface with visual charts, filters, and slicers to drill down into detailed data and track your IT infrastructure’s performance effectively.
Why You’ll Love the IT Infrastructure KPI Dashboard in Excel

✅ Track System Health & Performance
Monitor critical metrics like uptime, network health, and server performance in real-time. Stay ahead of potential issues and ensure that your IT systems are operating smoothly.
✅ Optimize Resource Allocation
Track resource usage (such as storage, bandwidth, and server capacity) to optimize allocation and reduce unnecessary costs, ensuring that your infrastructure is running efficiently.
✅ Improve Incident Management
Track incident response times, resolutions, and downtime to improve your IT team’s efficiency and ensure minimal disruption to operations.
✅ Enhance IT Support & Service Delivery
Use real-time insights to optimize your IT support team’s performance, reduce response times, and improve incident resolution, ensuring better service delivery to internal users or customers.
✅ Make Data-Driven IT Decisions
Leverage insights from the dashboard to make informed decisions about infrastructure upgrades, system optimizations, and the allocation of IT resources to support business growth.
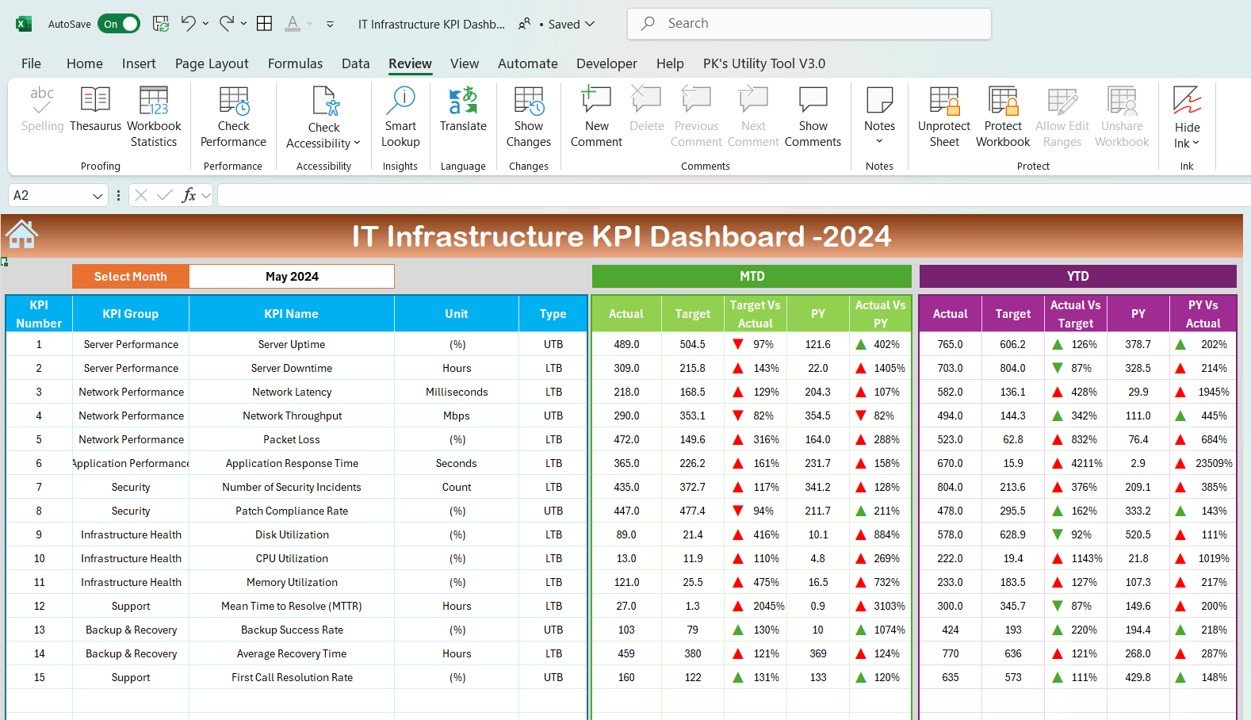
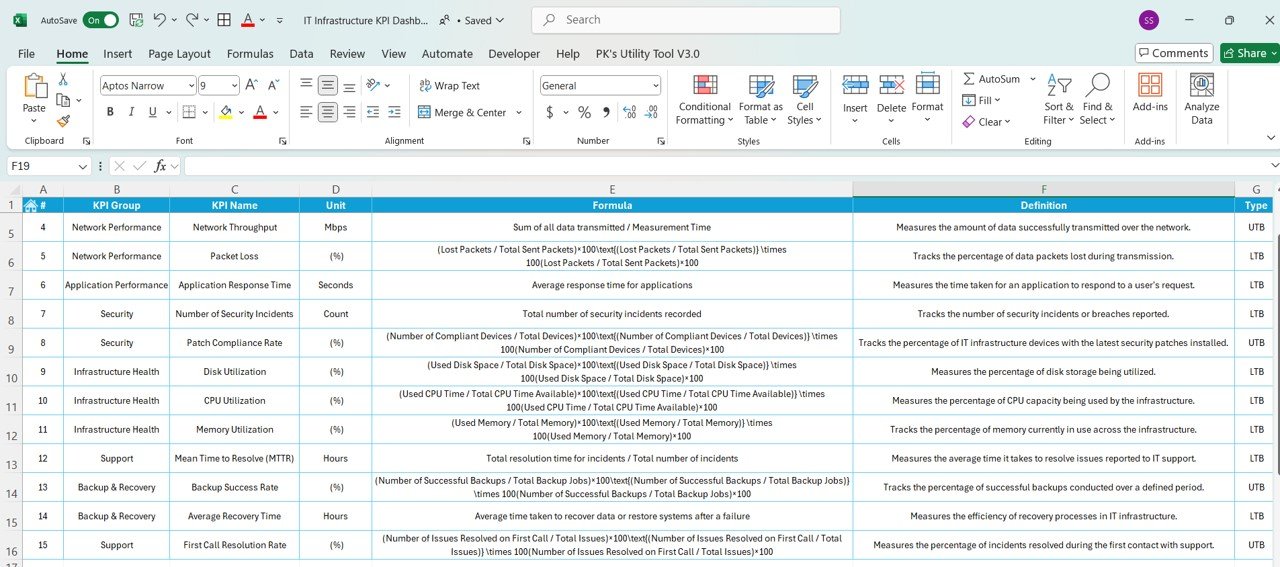
What’s Inside the IT Infrastructure KPI Dashboard Template?
- Server & Network Performance Tracking: Monitor system uptime, network performance, and service availability.
- Resource Utilization: Track storage, bandwidth, and CPU usage to optimize resource allocation.
- Incident Response Monitoring: Track incident reports, downtime causes, and resolution times to improve service levels.
- Customizable KPIs: Tailor the dashboard to monitor specific IT infrastructure KPIs, including cloud and on-premise performance metrics.
- Interactive Reporting: Use dynamic charts and filters to gain deeper insights into your infrastructure’s performance.
How to Use the IT Infrastructure KPI Dashboard in Excel
1️⃣ Download the Template: Instantly access your IT Infrastructure KPI Dashboard.
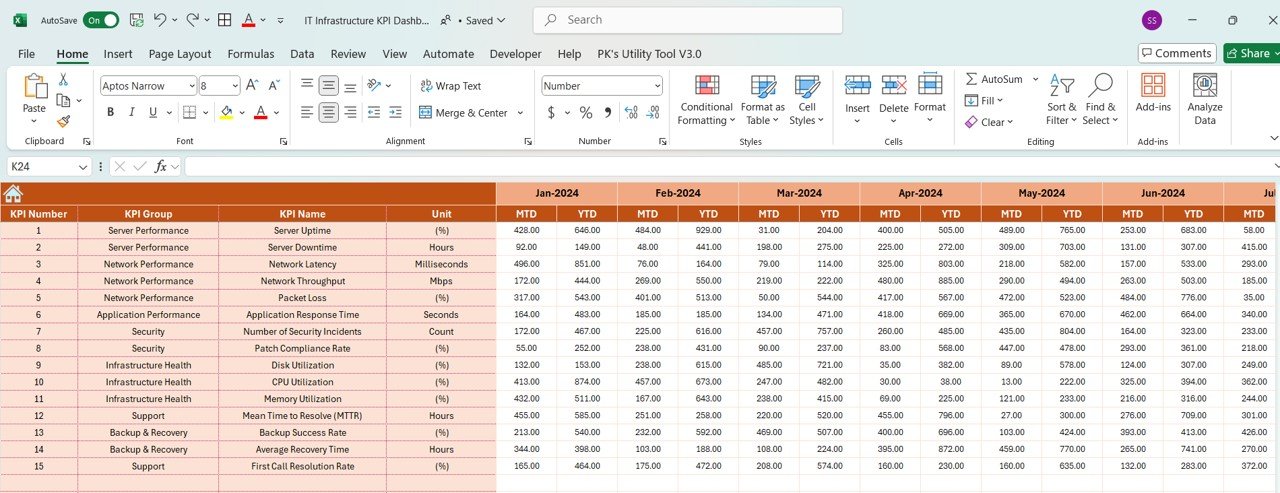
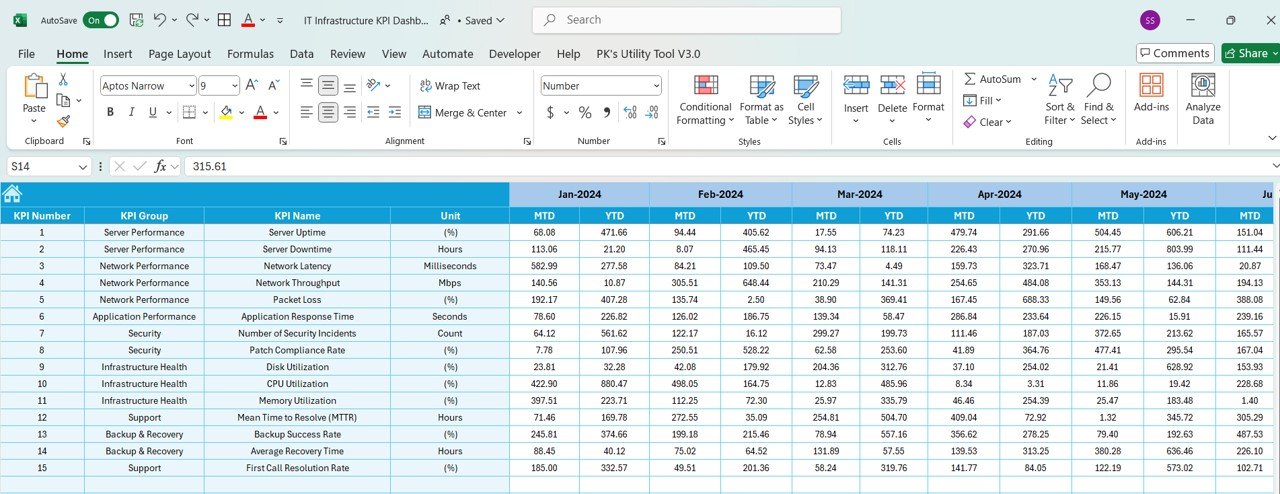
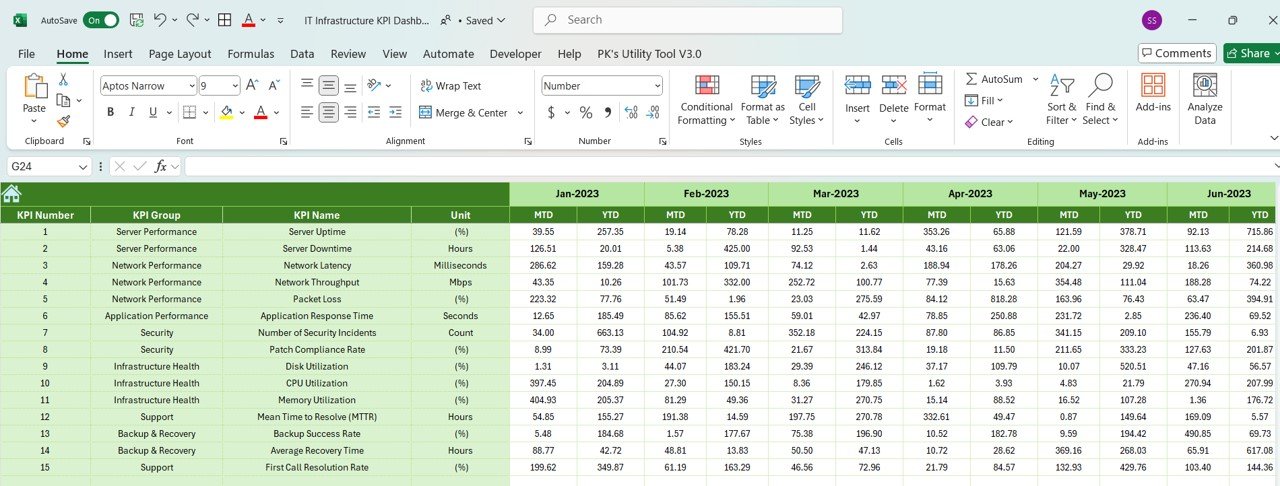
2️⃣ Input Infrastructure Data: Enter data such as server uptime, network performance, incident logs, and resource usage.
3️⃣ Track & Monitor KPIs: Use the dashboard to monitor real-time performance and health of your IT infrastructure.
4️⃣ Analyze & Optimize: Leverage insights to optimize resource allocation, improve incident management, and maintain system reliability.
Who Can Benefit from the IT Infrastructure KPI Dashboard in Excel?
🔹 IT Managers & System Administrators
🔹 Network Engineers & Infrastructure Teams
🔹 Business Owners & Operations Managers
🔹 IT Support Teams & Help Desk Managers
🔹 Cloud Service Providers & IT Consultants
🔹 Anyone Responsible for IT Operations & Infrastructure Management
Track, analyze, and optimize your IT infrastructure performance with the IT Infrastructure KPI Dashboard in Excel. Ensure system reliability, improve resource allocation, and make data-driven decisions to support business growth.
Click here to read the Detailed blog post
Visit our YouTube channel to learn step-by-step video tutorials
Youtube.com/@PKAnExcelExpert


Reviews
There are no reviews yet.