Modern manufacturing facilities increasingly rely on Automation Units Dashboard technologies to improve productivity, precision, and operational efficiency. Automation units such as robotic arms, CNC machines, automated packaging systems, and smart production equipment play a crucial role in ensuring consistent product quality and optimized production processes. However, managing and monitoring these automation systems requires continuous tracking of performance metrics such as maintenance activities, machine efficiency, downtime, defect rates, and energy consumption.
In many organizations, automation data is still managed using disconnected spreadsheets or manual reporting systems. As a result, operations managers often struggle to identify equipment failures, analyze maintenance trends, or monitor operational efficiency across departments and production lines. When data is scattered across multiple reports, it becomes difficult to make timely and informed decisions.
To overcome this challenge, companies increasingly adopt data-driven dashboards that centralize automation performance data. One effective solution is the Automation Units Dashboard in Excel.
The Automation Units Dashboard in Excel is a ready-to-use analytics solution designed to monitor the performance of automated machines and equipment in a centralized and visual format. The dashboard converts raw operational data into interactive charts, KPI indicators, and analytical reports, allowing managers to quickly understand how automation systems perform across departments, vendors, and unit types.
Because Microsoft Excel provides powerful analytical tools such as formulas, pivot tables, slicers, and dynamic charts, organizations can easily monitor automation performance and identify potential operational issues.
The dashboard consolidates data related to several important automation metrics, including:
-
Maintenance activities and schedules
-
Equipment efficiency scores
-
Downtime hours and operational disruptions
-
Defect rates and production quality indicators
-
Vendor performance and service reliability
-
Energy consumption and operational costs
-
Maintenance expenses across departments
Instead of manually analyzing multiple reports, managers can quickly evaluate automation performance through visual dashboards and data summaries.
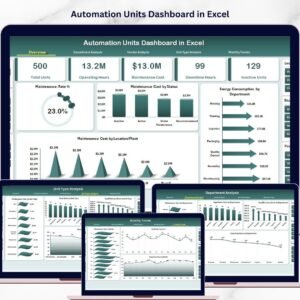
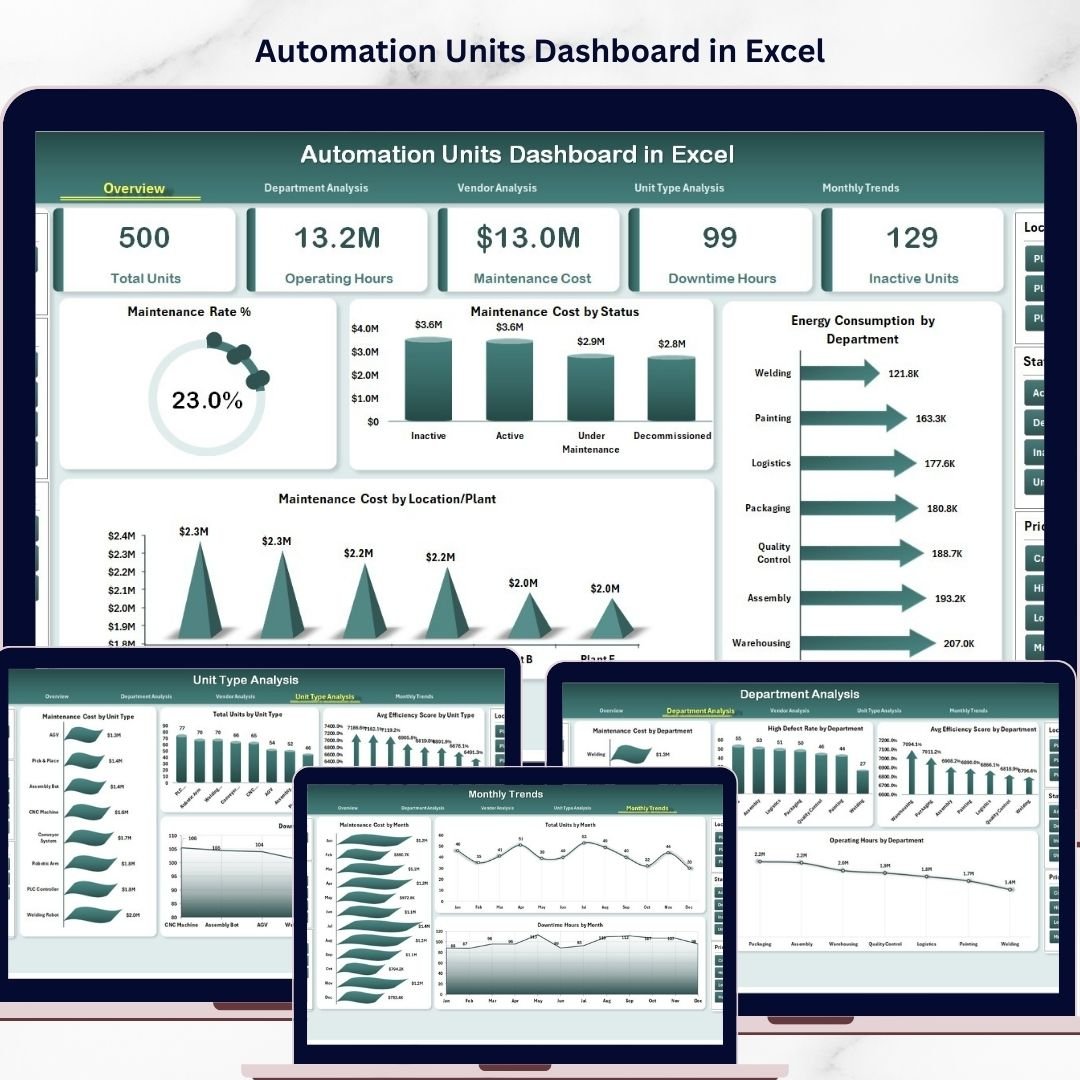
The Automation Units Dashboard in Excel includes five analytical pages, each designed to analyze automation performance from a different perspective. These pages include Overview, Department Analysis, Vendor Analysis, Unit Type Analysis, and Month Analysis.
The Overview Page acts as the central summary of the dashboard. It provides a high-level view of automation system performance through KPI cards and interactive charts. This page allows managers to quickly understand maintenance rates, maintenance costs, energy consumption, and system conditions across different departments and locations.
The dashboard also includes interactive slicers that allow users to filter data dynamically. Managers can analyze performance based on departments, vendors, locations, or other operational parameters.
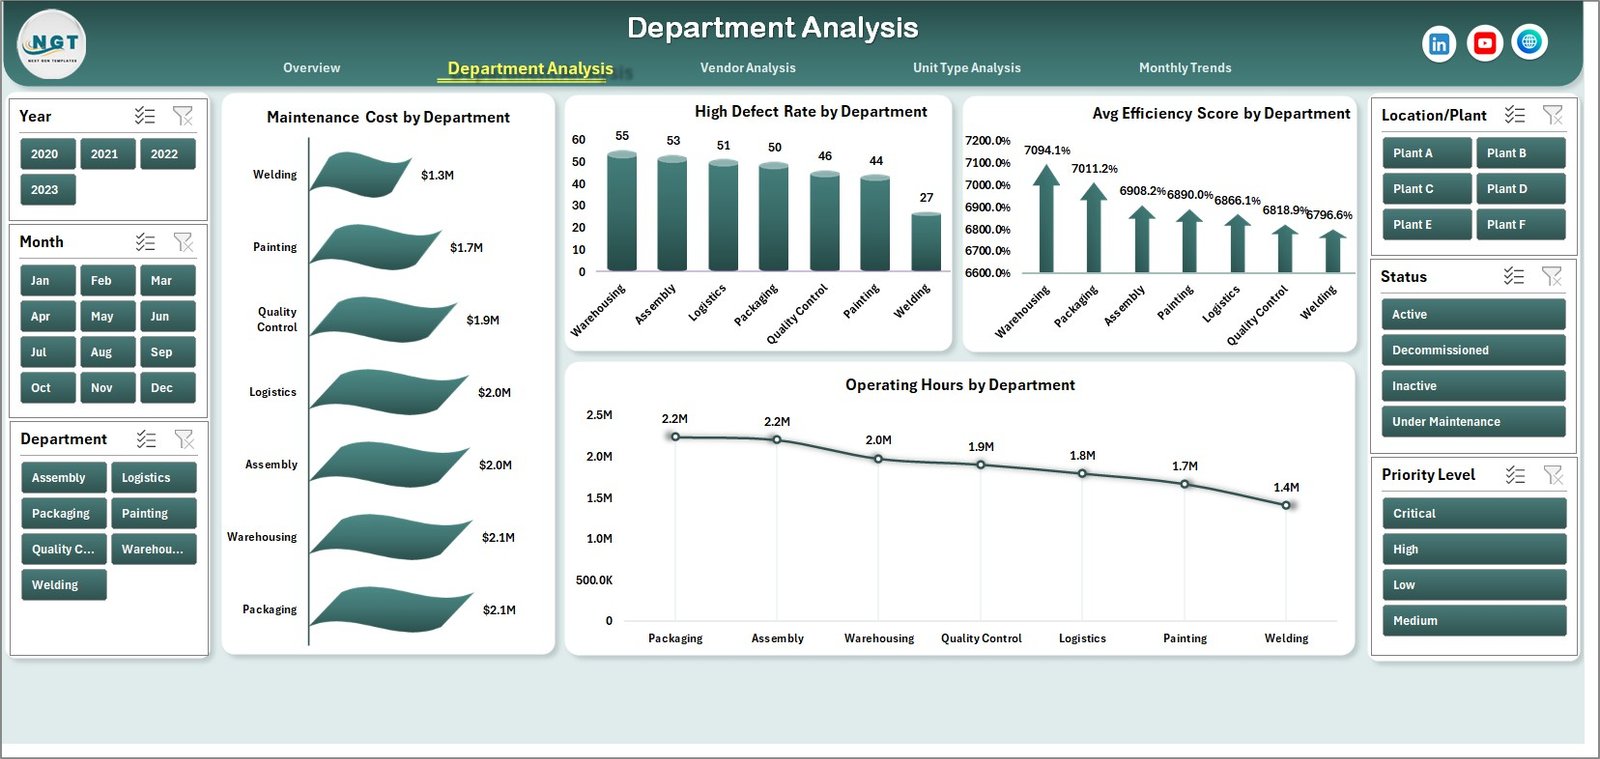
The Department Analysis Page focuses on analyzing automation performance across different departments within the organization. Since each department may use different automation equipment, performance levels can vary significantly. This page includes charts that display maintenance costs, defect rates, efficiency scores, and operating hours by department. These insights help managers identify departments that require operational improvements or preventive maintenance.
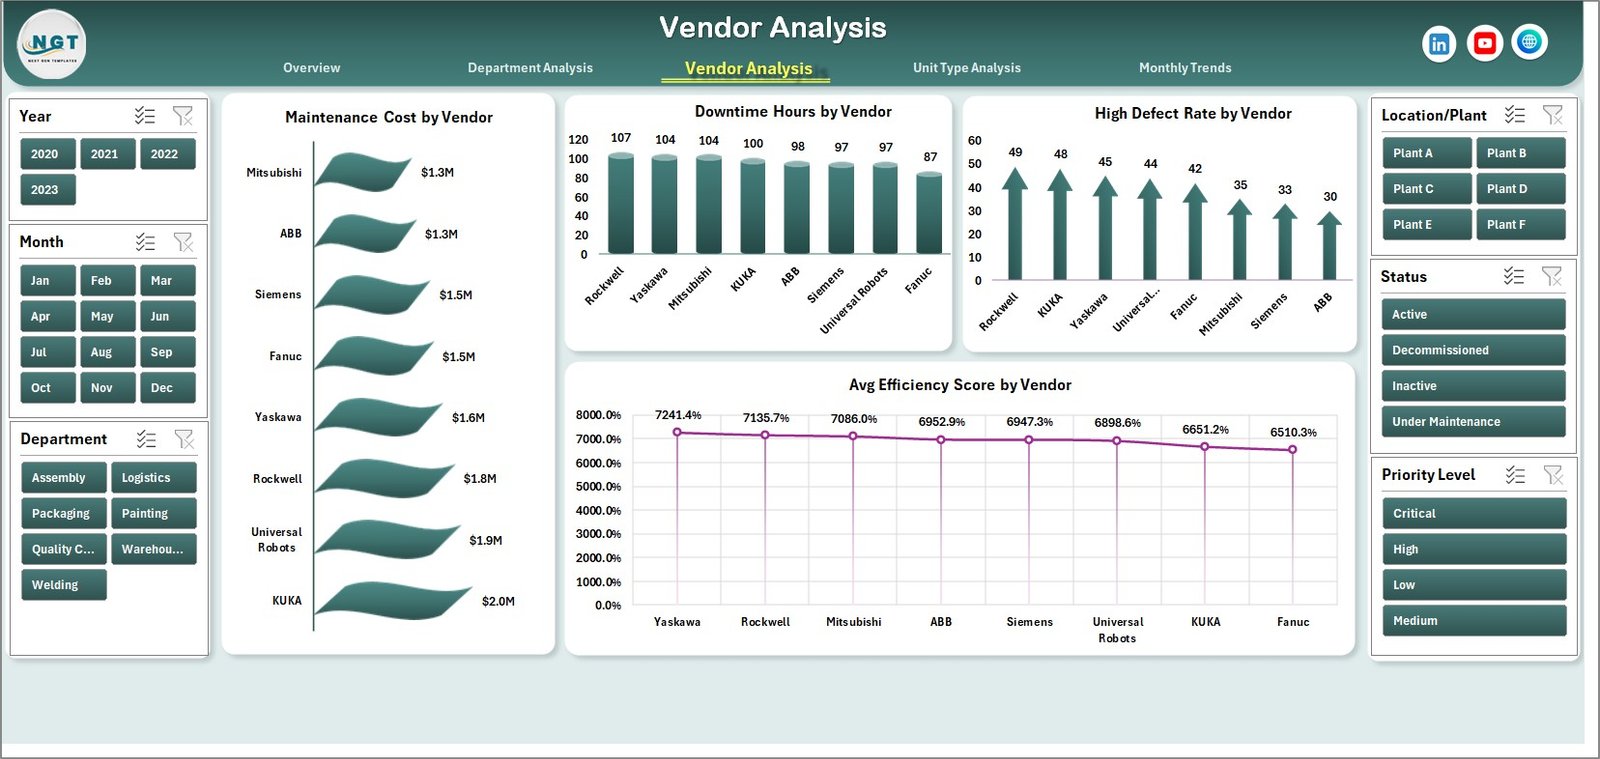
The Vendor Analysis Page evaluates the performance of external vendors responsible for maintenance services, spare parts, or automation system upgrades. Organizations often rely on vendors for critical maintenance tasks, so monitoring vendor performance becomes essential. The dashboard displays maintenance costs, downtime hours, defect rates, and efficiency scores by vendor, helping managers assess vendor reliability and service quality.
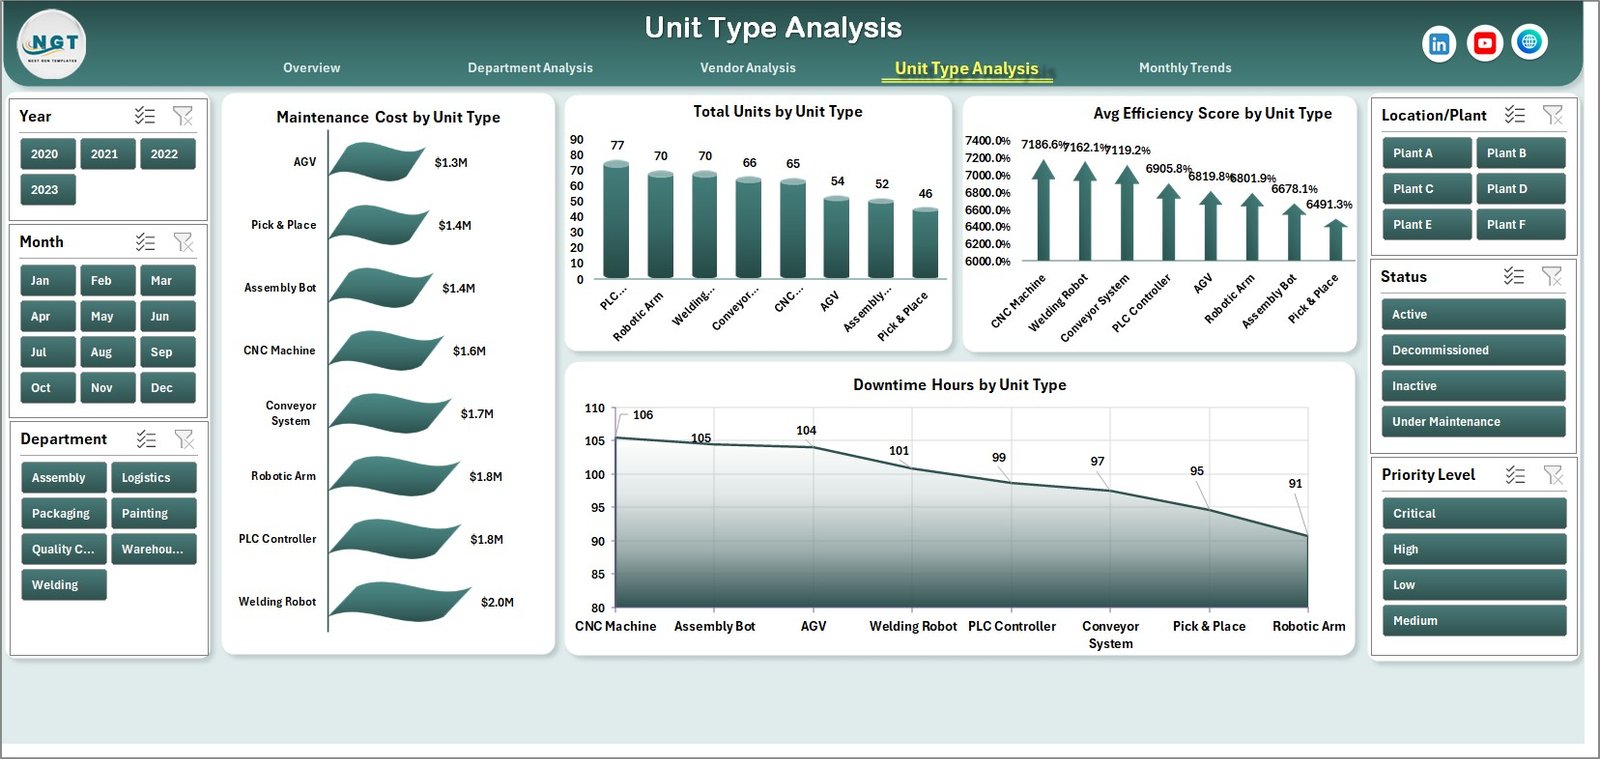
The Unit Type Analysis Page focuses on analyzing automation performance based on equipment type. Manufacturing environments often use various machine types such as robotic arms, CNC machines, automated assembly units, and packaging automation systems. This page helps managers understand how each machine type performs in terms of maintenance cost, operational efficiency, and downtime hours. These insights support better equipment planning and resource allocation.
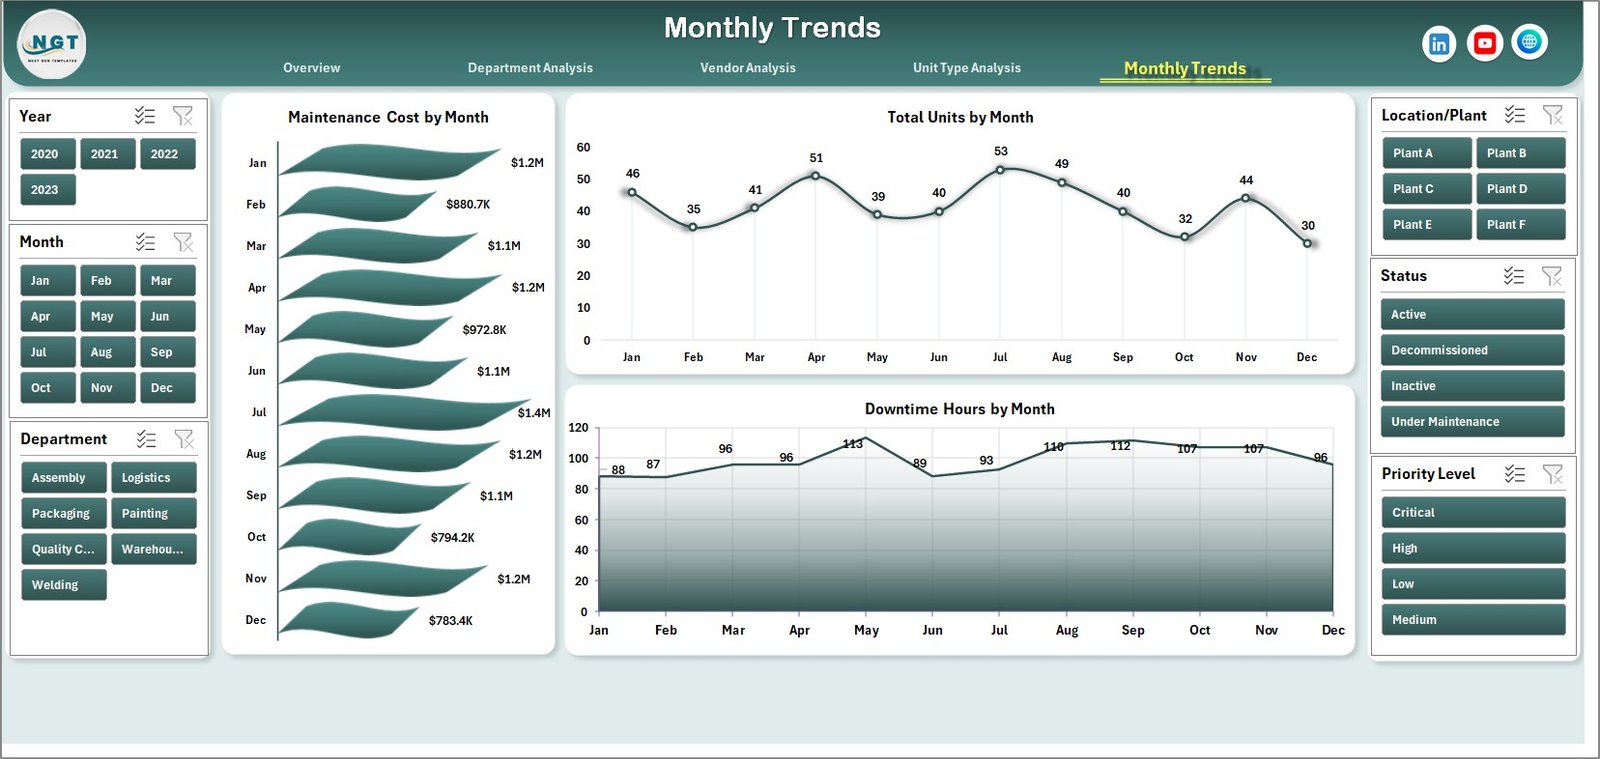
The Month Analysis Page provides time-based insights into automation performance. Because automation efficiency may fluctuate due to production cycles, maintenance schedules, or seasonal demand, monthly analysis becomes essential. The dashboard tracks metrics such as maintenance cost, total units, and downtime hours by month, helping organizations identify trends and plan preventive maintenance strategies.
The dashboard also includes two supporting worksheets: the Support Sheet and the Data Sheet.
The Support Sheet stores reference information such as department names, vendor lists, unit types, location categories, and status labels. This sheet ensures that data remains standardized across the dashboard.
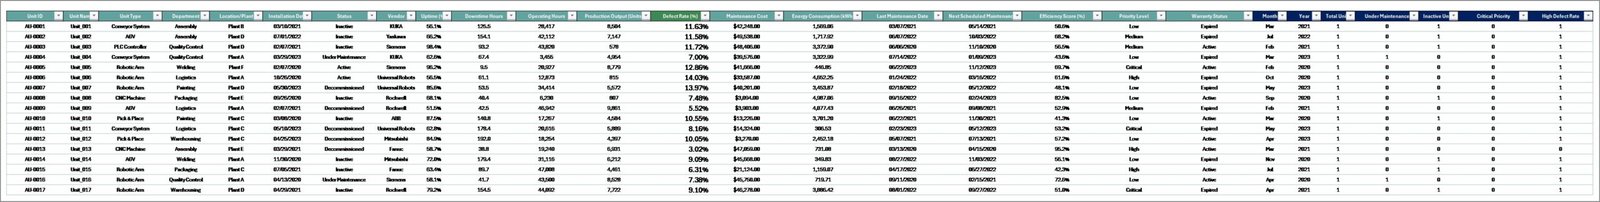
The Data Sheet contains the raw operational data used by the dashboard. Typical fields include unit ID, department, unit type, vendor name, location, maintenance cost, operating hours, downtime hours, efficiency score, energy consumption, defect rate, maintenance status, and reporting month. Once users update the data sheet, the dashboard automatically refreshes all charts and analysis.
The Automation Units Dashboard in Excel is ideal for professionals responsible for managing automated production environments. This includes manufacturing managers, automation engineers, maintenance teams, plant supervisors, and operations managers.
By transforming complex operational data into clear visual insights, the Automation Units Dashboard in Excel helps organizations improve equipment monitoring, reduce downtime, optimize maintenance planning, and enhance overall operational efficiency.
Key Features of Automation Units Dashboard in Excel
⚙ Automation Performance Monitoring
Track machine efficiency, downtime, and maintenance activities.
📊 Interactive Dashboard Interface
Analyze automation performance through dynamic charts and filters.
🏭 Department-Level Analysis
Compare automation performance across different departments.
🔧 Vendor Performance Tracking
Evaluate maintenance service providers based on operational metrics.
🤖 Unit Type Performance Insights
Analyze machine efficiency and downtime by equipment type.
📉 Downtime Monitoring
Identify operational disruptions and equipment failures.
📊 Maintenance Cost Analysis
Track maintenance expenses by department, vendor, and machine type.
📅 Monthly Performance Tracking
Monitor automation trends and maintenance costs over time.
⚡ Excel-Based Automation Analytics
Leverage pivot tables, formulas, and slicers for advanced insights.
🔄 Automated Dashboard Updates
Charts and reports update automatically when data is refreshed.
What’s Inside the Automation Units Dashboard in Excel
The dashboard contains five analytical pages designed to provide comprehensive automation performance insights.
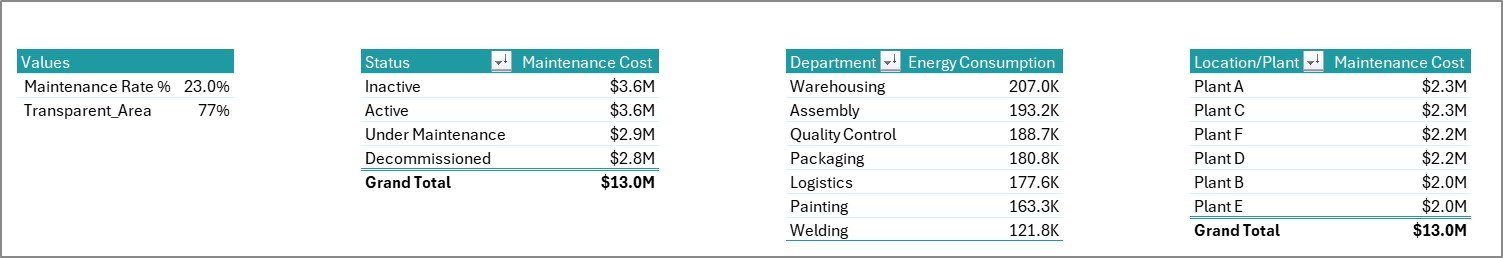
Overview Page – Automation Performance Summary
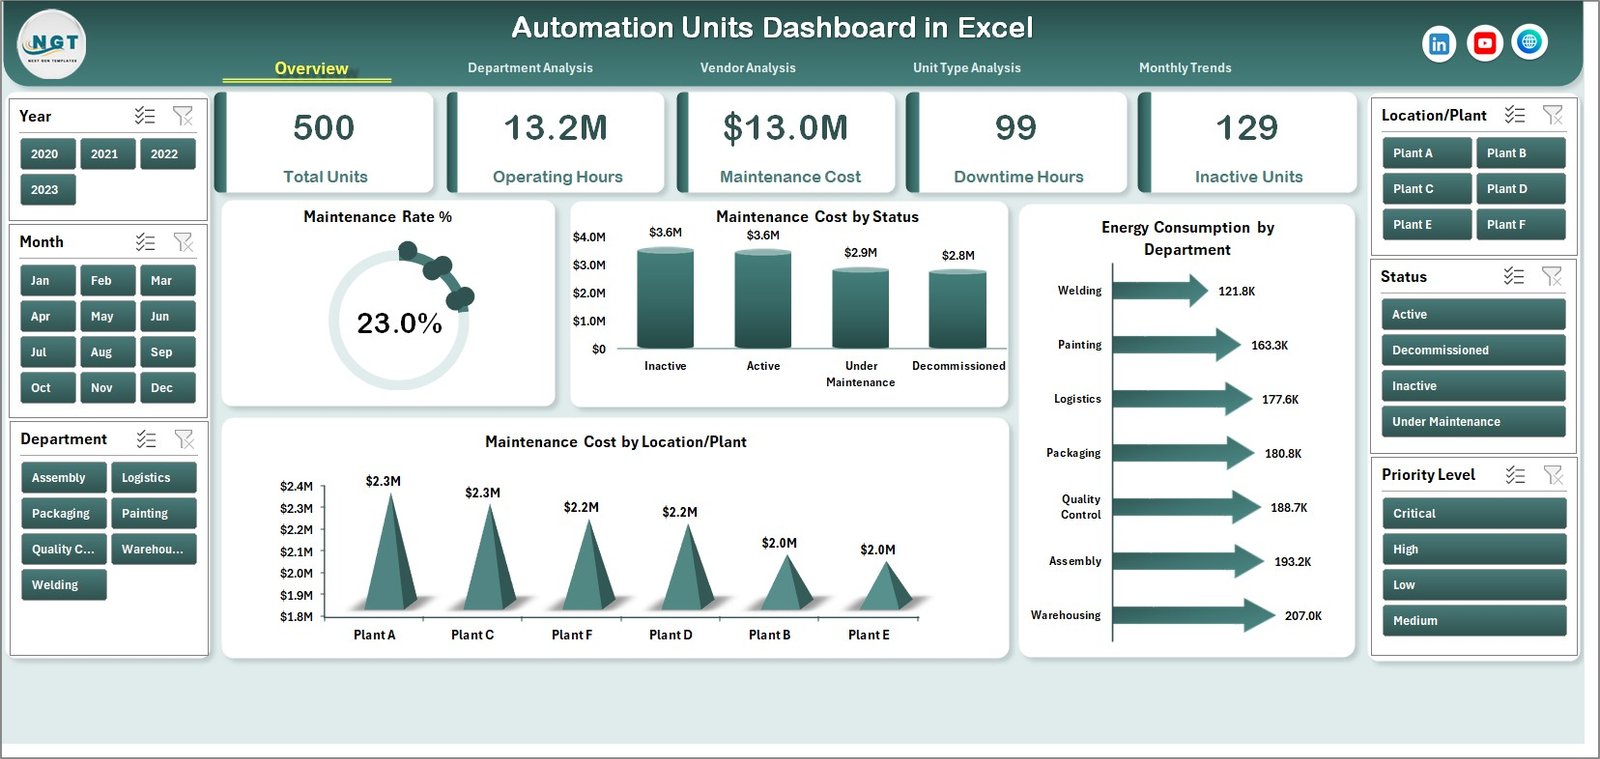
The Overview Page provides a high-level summary of automation system performance.
Key visuals include:
-
Maintenance Rate (%)
-
Maintenance Cost by Status
-
Energy Consumption by Department
-
Maintenance Cost by Location or Plant
These insights help managers quickly evaluate automation conditions across locations.
Department Analysis Page
This page analyzes automation performance across departments.
Charts included:
-
Maintenance Cost by Department
-
High Defect Rate by Department
-
Average Efficiency Score by Department
-
Operating Hours by Department
Vendor Analysis Page
This page evaluates the performance of automation service vendors.
Charts included:
-
Maintenance Cost by Vendor
-
Downtime Hours by Vendor
-
High Defect Rate by Vendor
-
Average Efficiency Score by Vendor
Unit Type Analysis Page
This page analyzes performance based on machine type.
Charts included:
-
Maintenance Cost by Unit Type
-
Total Units by Unit Type
-
Average Efficiency Score by Unit Type
-
Downtime Hours by Unit Type
Month Analysis Page
This page provides time-based insights into automation performance.
Charts included:
-
Maintenance Cost by Month
-
Total Units by Month
-
Downtime Hours by Month
How to Use the Automation Units Dashboard
1️⃣ Enter automation data in the Data Sheet.
2️⃣ Update machine performance metrics such as maintenance cost, downtime hours, and efficiency scores.
3️⃣ Use slicers to filter data by department, vendor, or unit type.
4️⃣ Analyze charts across the dashboard pages.
5️⃣ Monitor trends and identify operational improvements.
Who Can Use This Dashboard
This dashboard is useful for professionals responsible for managing automation systems.
🏭 Manufacturing Managers
🤖 Automation Engineers
🔧 Maintenance Teams
📊 Operations Managers
🏢 Plant Supervisors
📈 Industrial Data Analysts
These professionals can use the dashboard to monitor machine performance, optimize maintenance strategies, and improve production efficiency.
Click here to read the Detailed blog post
Visit our YouTube channel to learn step-by-step video tutorials
https://youtube.com/@PKAnExcelExpert