The Audio Streaming Services Dashboard industry has experienced explosive growth over the past decade. Millions of users now listen to music, podcasts, audiobooks, and live audio content through digital platforms every day. As streaming platforms expand globally, companies must analyze large volumes of data to understand listener behavior, content popularity, platform performance, and revenue trends.
However, many streaming businesses still manage their data across multiple spreadsheets, analytics tools, and reports. This fragmented approach often makes it difficult to monitor performance metrics effectively. Decision-makers may struggle to track streaming activity, analyze ad revenue, evaluate content performance, or identify profitable markets.
To overcome these challenges, organizations increasingly rely on centralized analytics dashboards that convert raw streaming data into actionable insights. One powerful solution is the Audio Streaming Services Dashboard in Excel.
The Audio Streaming Services Dashboard in Excel is a ready-to-use analytics solution designed to help streaming companies monitor performance using interactive charts, KPI indicators, and filters. This dashboard organizes large datasets into meaningful visual reports that allow businesses to understand trends quickly and make informed decisions.
Instead of manually analyzing thousands of records, users only need to update the Data Sheet, and the dashboard automatically refreshes charts and insights. Excel’s powerful visualization tools convert complex streaming data into easy-to-understand dashboards.
The dashboard tracks several important streaming metrics including total streams, revenue performance, ad revenue, content performance, listener engagement, device usage, platform performance, and regional trends. With this centralized reporting system, streaming companies can evaluate how their platform performs across different content categories and markets.
Interactive slicers and filters allow users to analyze streaming data based on region, platform, genre, device type, content type, and time period. As a result, companies can easily identify high-performing content, profitable platforms, and user engagement trends.
The dashboard is structured across five analytical pages, each designed to analyze a specific aspect of streaming performance. These pages include Overview, Content Analysis, Revenue Analysis, Listener Engagement, and Month Analysis.
Whether you operate a music streaming service, podcast network, audiobook platform, or digital audio service, this dashboard provides a comprehensive analytics framework.
By transforming streaming data into powerful visual insights, the Audio Streaming Services Dashboard in Excel helps organizations optimize content strategies, increase advertising revenue, and improve listener engagement.
🎧 Key Feature of Audio Streaming Services Dashboard in Excel
📊 Interactive Streaming Analytics Dashboard
Monitor streaming performance using dynamic charts and KPI indicators.
💰 Revenue & Ad Performance Tracking
Analyze gross revenue, net revenue, and advertising revenue.
🎵 Content Performance Analysis
Identify which genres and content types generate the most streams and revenue.
📱 Platform Performance Insights
Compare performance across mobile apps, web platforms, desktop apps, and smart TVs.
📈 Listener Engagement Analytics
Understand how listeners interact with streaming content.
🌍 Regional Revenue Monitoring
Track streaming performance across different geographic regions.
📊 Device Usage Insights
Analyze which devices listeners prefer for streaming.
📅 Monthly Trend Analysis
Monitor streaming activity and revenue growth over time.
🎛 Interactive Filters & Slicers
Filter analytics instantly by platform, region, genre, or device type.
⚙️ Excel-Based Data Management
Update streaming data easily using the built-in Data Sheet.
📊 What’s Inside the Audio Streaming Services Dashboard in Excel
The dashboard contains five analytical pages, each designed to analyze streaming performance from different perspectives.
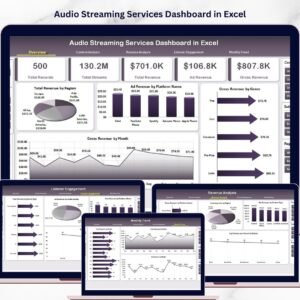
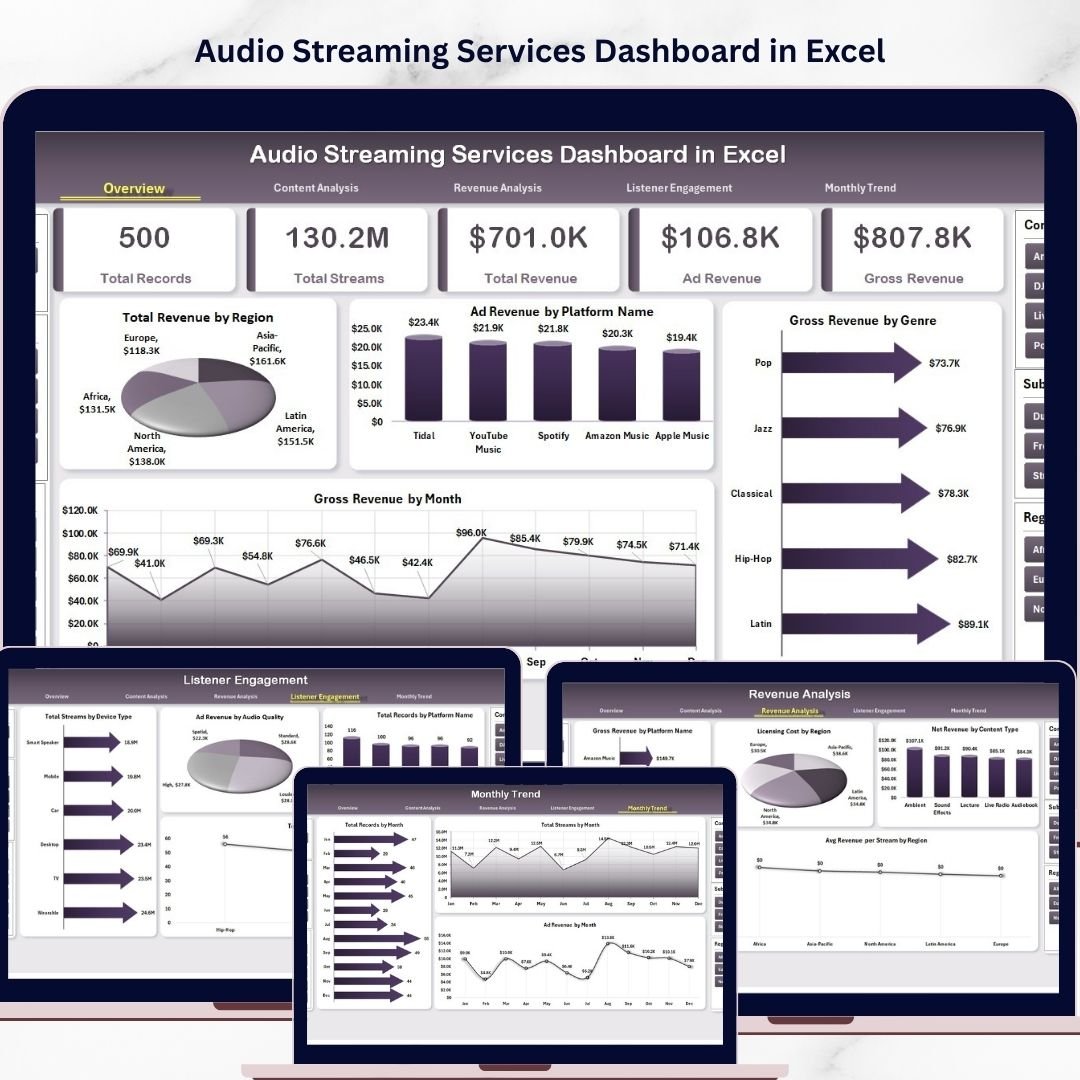
🎧 Overview Page – Streaming Performance Summary
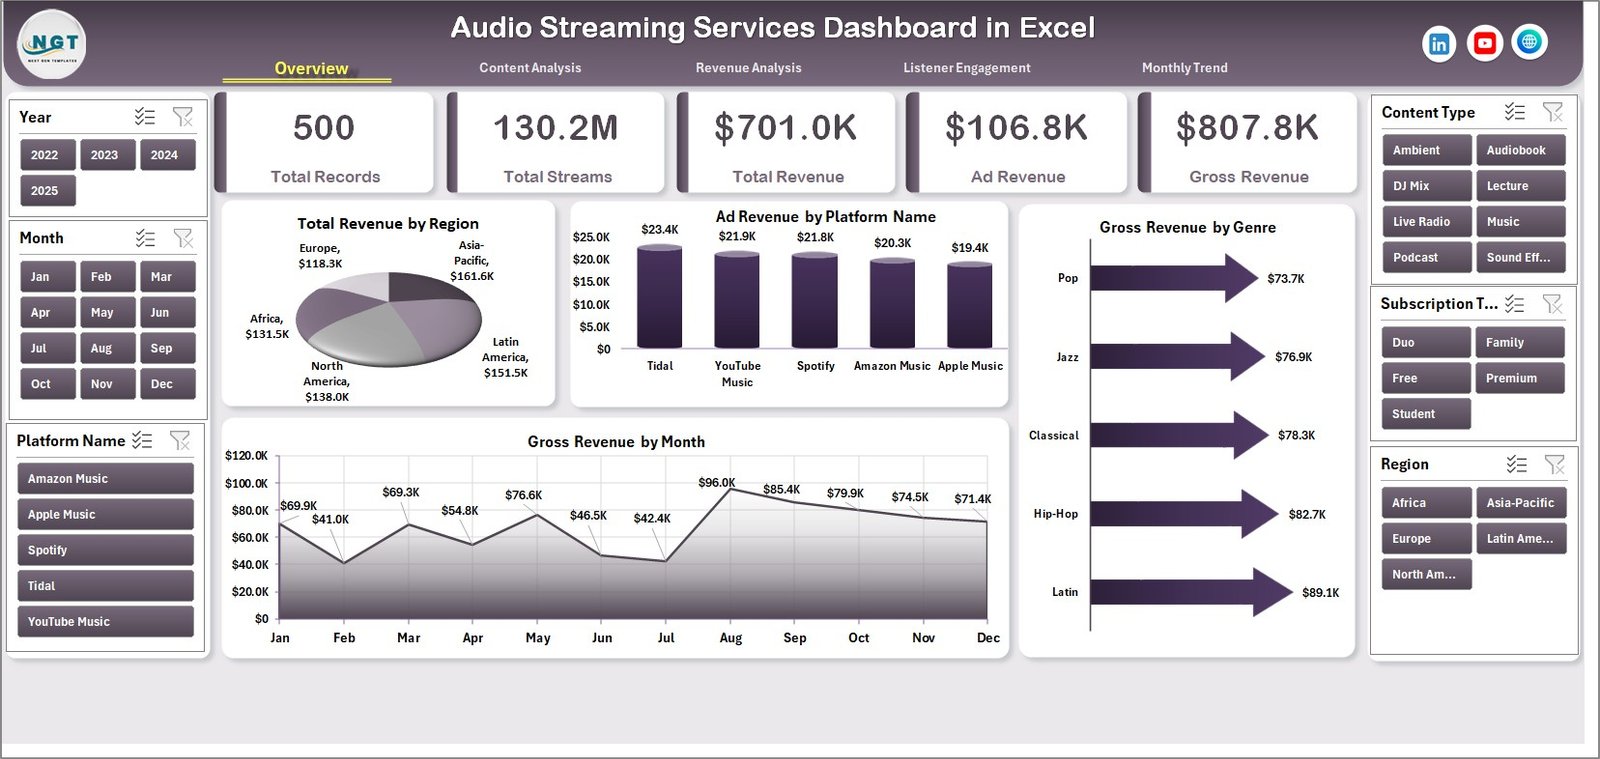
The Overview Page provides a high-level summary of streaming performance.
This page includes:
• Interactive slicers for dynamic filtering
• Four KPI cards displaying key revenue metrics
• Four charts that highlight important streaming insights
Charts Included
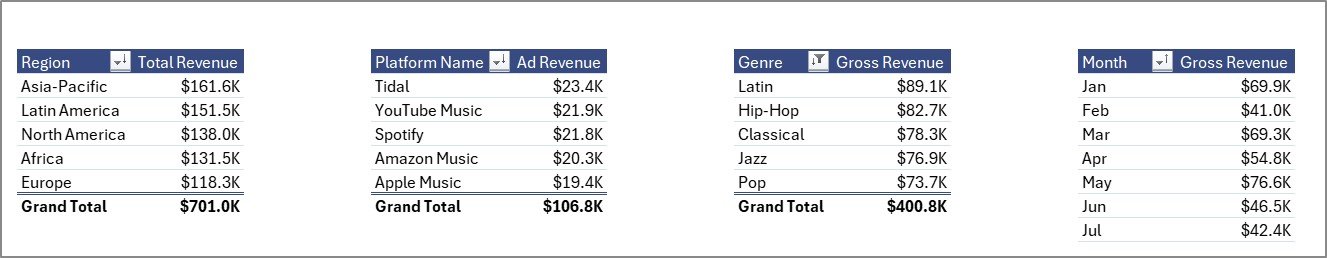
• Total Revenue by Region – Shows revenue distribution across geographic markets.
• Ad Revenue by Platform Name – Displays advertising revenue generated by each platform.
• Gross Revenue by Genre – Identifies which audio genres generate the most revenue.
• Gross Revenue by Month – Tracks revenue growth trends across months.
These insights help businesses understand their overall streaming performance.
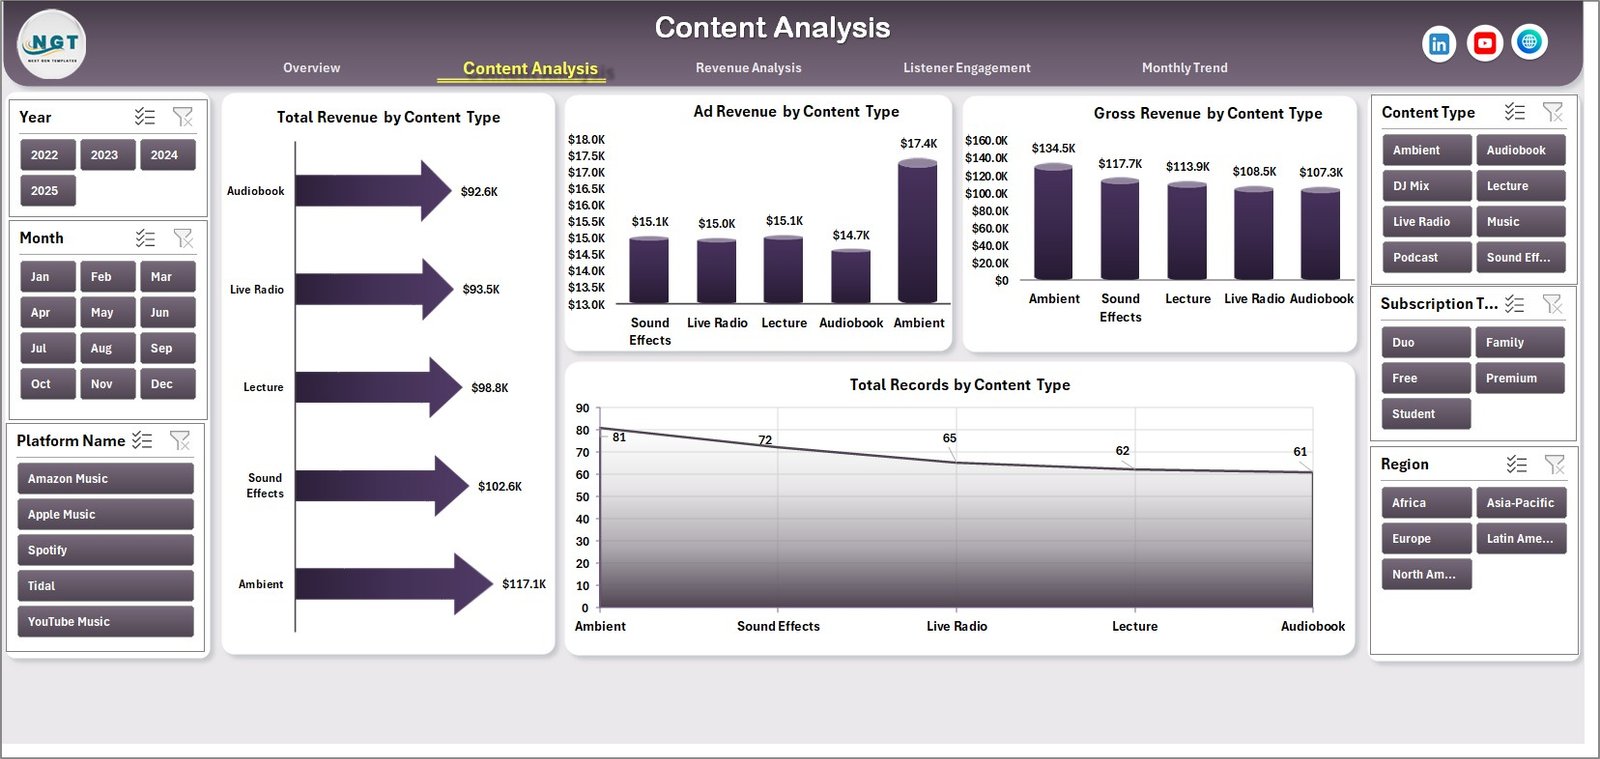
🎵 Content Analysis Page
The Content Analysis Page focuses on evaluating content performance.
Charts included:
• Total Revenue by Content Type
• Ad Revenue by Content Type
• Gross Revenue by Content Type
• Total Record by Content Type
This analysis helps streaming companies identify high-performing content categories such as music, podcasts, audiobooks, or radio streams.
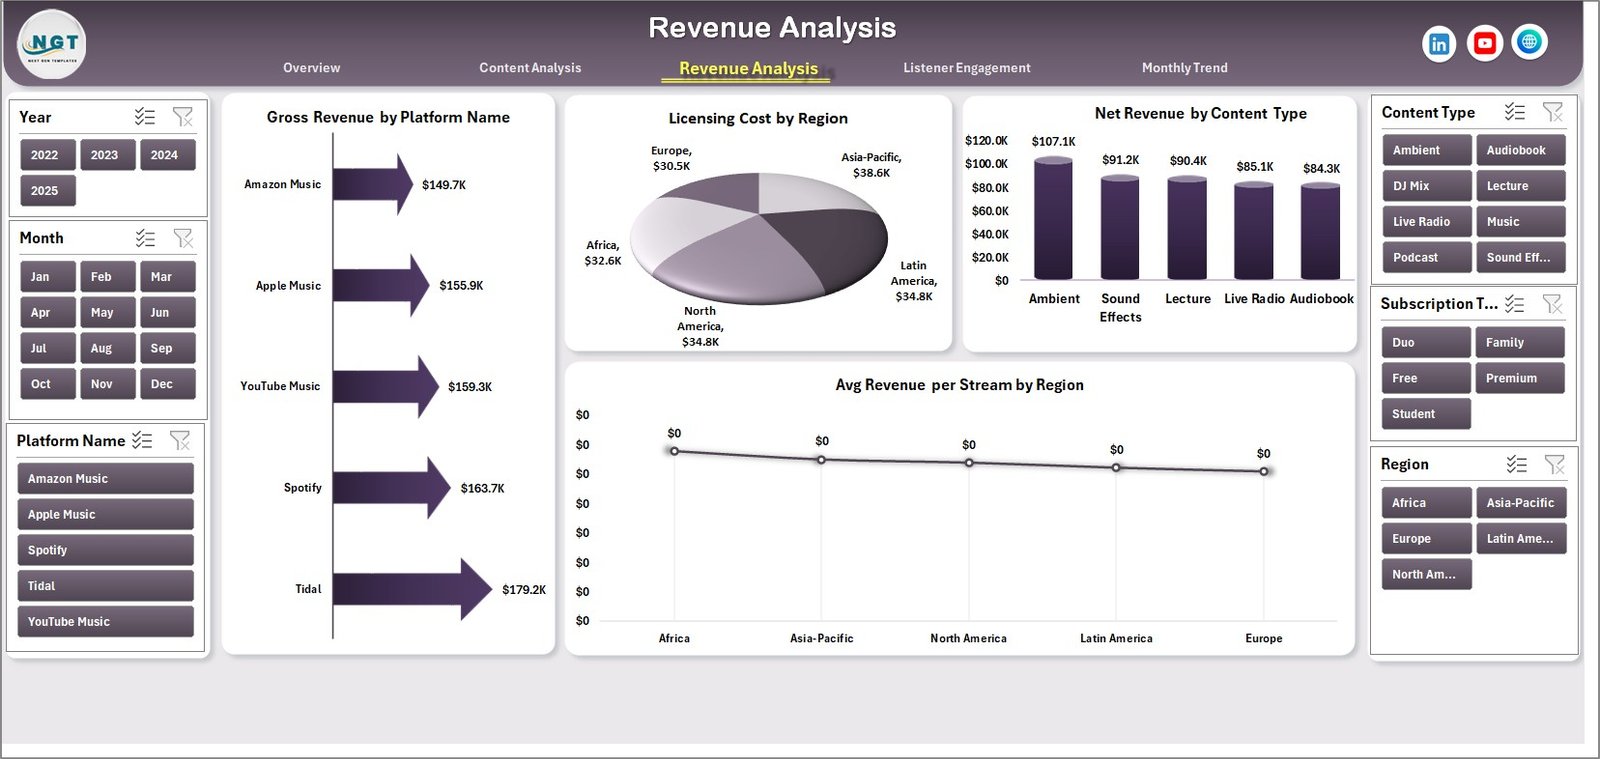
💰 Revenue Analysis Page
Revenue tracking is essential for streaming businesses. The Revenue Analysis Page provides deeper financial insights.
Charts included:
• Gross Revenue by Platform
• Licensing Cost by Region
• Net Revenue by Content Type
• Average Revenue per Stream by Region
These metrics help businesses understand profitability and monetization performance.
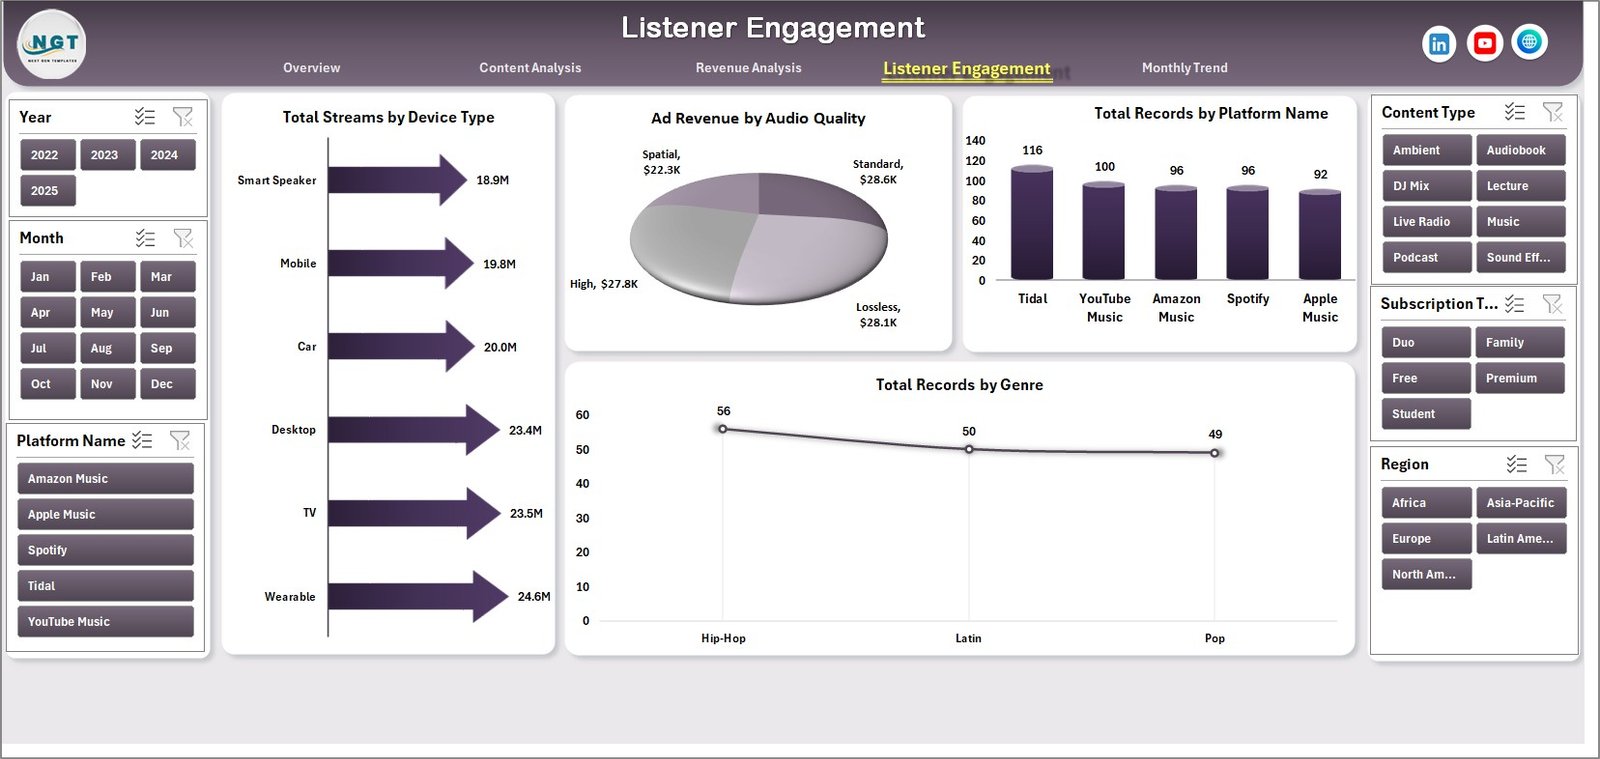
📈 Listener Engagement Page
The Listener Engagement Page analyzes how users interact with the platform.
Charts included:
• Total Streams by Device Type
• Ad Revenue by Audio Quality
• Total Record by Platform Name
• Total Record by Genre
These insights help companies optimize user experience and streaming accessibility.
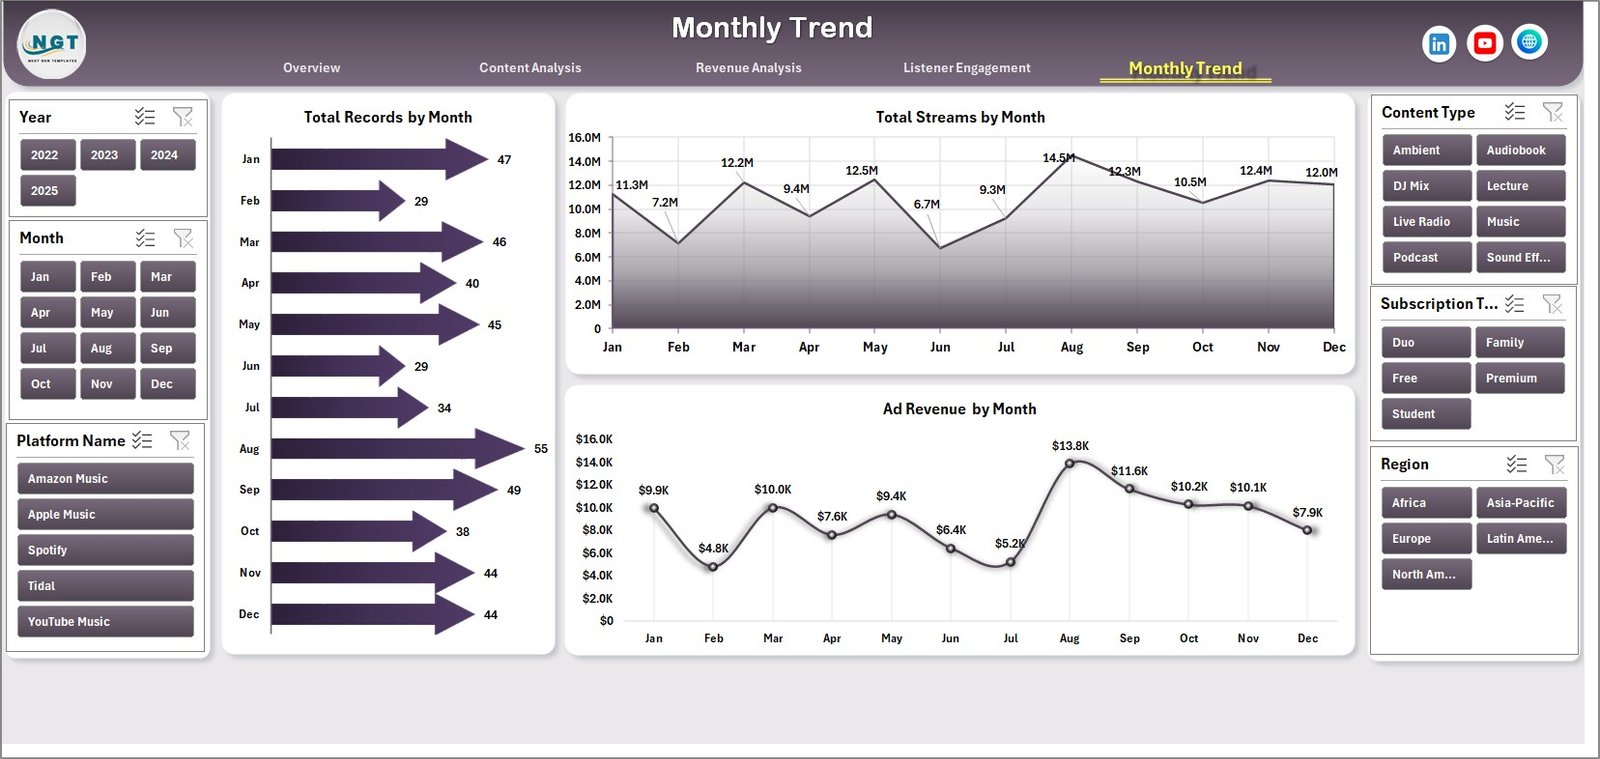
📅 Month Analysis Page
The Month Analysis Page focuses on time-based performance trends.
Charts included:
• Total Records by Month
• Total Streams by Month
• Ad Revenue by Month
This analysis helps companies understand seasonal trends and listener behavior patterns.
⚙️ How to Use the Audio Streaming Services Dashboard in Excel
Using this dashboard is simple.
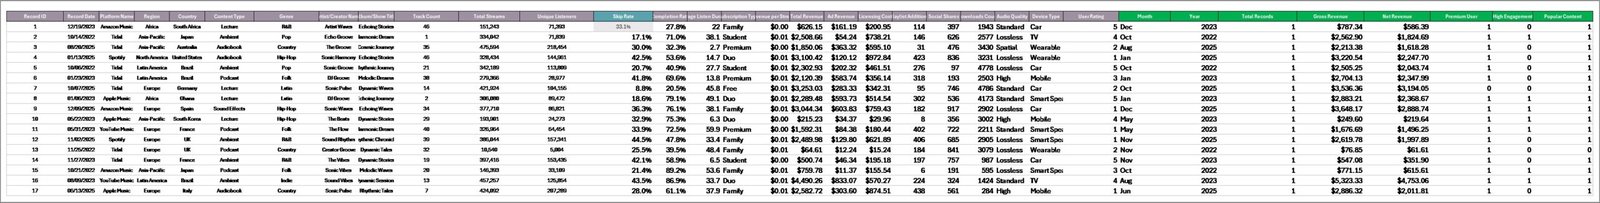
1️⃣ Enter streaming data into the Data Sheet.
2️⃣ Ensure fields include platform name, region, genre, revenue, streams, and device type.
3️⃣ Use slicers to filter data dynamically.
4️⃣ Analyze insights across the different analytical pages.
5️⃣ Update the dataset regularly to keep analytics accurate.
Within seconds, Excel converts raw streaming data into powerful visual insights.
👥 Who Can Benefit from This Dashboard
This dashboard is ideal for professionals working in digital audio and streaming industries.
🎧 Music Streaming Platforms
🎙 Podcast Networks
📚 Audiobook Platforms
📊 Media Data Analysts
📈 Digital Media Companies
🚀 Streaming Platform Startups
These professionals can use the dashboard to monitor performance, improve engagement, and optimize revenue strategies.
### Click hare to read the Detailed blog post
Visit our YouTube channel to learn step-by-step video tutorials
https://youtube.com/@PKAnExcelExpert