Healthcare organizations handle huge volumes of data every single day. Hospitals and clinics must monitor admissions, discharges, patient outcomes, department efficiency, insurance revenue, bed occupancy, patient satisfaction, and many other performance indicators. However, when all this information remains scattered across reports, systems, and spreadsheets, it becomes difficult for decision-makers to act quickly and confidently.
That is exactly why modern healthcare institutions need a smarter way to analyze performance.
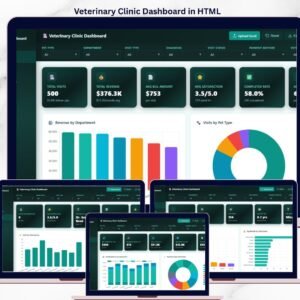
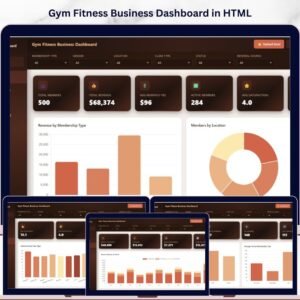
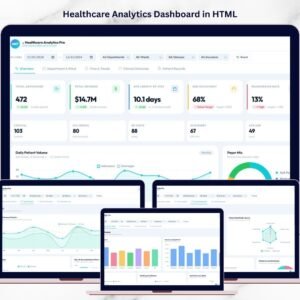
This is where the Healthcare Analytics Dashboard in HTML becomes a game-changing solution.
The Healthcare Analytics Dashboard in HTML is a modern, interactive, and ready-to-use web-based analytics solution designed to help healthcare organizations monitor key performance indicators in one centralized interface. Built using HTML, CSS, and JavaScript, this dashboard delivers a professional web-style experience directly in a browser without requiring complex software installation.
Instead of spending hours reviewing manual reports, healthcare leaders can instantly analyze operational, financial, and clinical performance through KPI cards, advanced charts, interactive filters, and detailed patient records. Because the dashboard is browser-based, it offers flexibility, ease of access, and a visually rich user experience.
Whether you manage a hospital, clinic, healthcare consultancy, or healthcare operations team, this dashboard helps you turn complex healthcare data into clear and actionable insights. It is designed for professionals who want better visibility, faster reporting, and stronger decision-making.
If you want to impress your team, improve patient care visibility, and monitor healthcare performance with a sleek modern interface, this dashboard is exactly what you need.

🚀 Key Feature of Healthcare Analytics Dashboard in HTML
💻 Modern Web-Based Interface
Run the dashboard directly in a browser using a clean and professional HTML interface.
📊 Interactive KPI Cards
Track healthcare metrics such as admissions, revenue, bed occupancy, readmission rate, and patient satisfaction.
🧭 Multi-Page Dashboard Navigation
Easily switch between Overview, Department Analysis, Time Trends, Clinical Outcomes, and Patient Records pages.
🎯 Dynamic Filters
Filter data by date range, department, ward, patient status, and insurance type for deeper analysis.
🏥 Department & Ward Performance Analysis
Monitor admissions, revenue, staff-to-patient ratio, and ward capacity utilization.
📈 Trend Analysis Charts
Analyze admission and revenue patterns across months, quarters, and weekdays.
🩺 Clinical Outcome Monitoring
Track readmission rates, discharge outcome mix, patient acuity, and satisfaction indicators.
📋 Detailed Patient Records Table
Review patient-level information with search, export, and structured data analysis features.
📤 Excel Upload and Export Options
Import source data and export records for additional reporting and sharing.
✨ Visually Impressive Dashboard Design
Deliver a professional healthcare analytics experience with charts, cards, tables, and intuitive navigation.
📦 What’s Inside the Healthcare Analytics Dashboard in HTML
This powerful dashboard includes multiple analytical pages, each focused on a different part of healthcare performance monitoring.
1️⃣ Overview Page
This is the main page where healthcare leaders can review a quick performance snapshot.
Users can apply filters such as:
-
Date range
-
Department
-
Ward
-
Patient status
-
Insurance type
The page includes major KPI cards such as:
-
Total Admissions
-
Total Revenue
-
Average Length of Stay
-
Bed Occupancy Rate
-
Readmission Rate
-
Patient Satisfaction Score
It also shows important operational metrics like ICU census, ER visits, critical patients, patients in surgery, outpatient visits, and average patient age.
2️⃣ Department & Ward Analysis
This page helps users evaluate departmental and ward-level performance.
It includes:
-
Admissions by Department
-
Revenue by Department
-
Staff-to-Patient Ratio
-
Ward Capacity Utilization
-
Department Performance Radar
This section is highly useful for resource allocation and operational planning.
3️⃣ Time & Trends Analysis
This page helps users understand how healthcare performance changes over time.
It includes:
-
12-Month Admission & Revenue Timeline
-
Quarterly Patient Volume
-
Day-of-Week Admission Patterns
These visuals help identify seasonal patterns and support workforce planning.
4️⃣ Clinical Outcomes Analysis
This page focuses on healthcare quality and patient outcomes.
It includes:
-
Readmission Rate by Department
-
Patient Satisfaction Radar
-
Discharge Outcome Mix
-
Mortality & Complication Rate
-
Patient Acuity Distribution
This helps organizations improve treatment quality and patient care standards.
5️⃣ Patient Records Page
This page displays patient-level data in a searchable and exportable table.
Fields include:
-
Patient ID
-
Date
-
Department
-
Ward
-
Patient Status
-
Insurance
-
Diagnosis
-
Acuity Level
-
Length of Stay
-
Revenue
-
Satisfaction Score
-
Readmission Status
This page supports operational review and detailed record analysis.
⚙️ How to Use the Healthcare Analytics Dashboard in HTML
Using this dashboard is simple and user-friendly.
Step 1: Open the HTML dashboard file in your browser.
Step 2: Upload or connect your healthcare dataset using the provided structure.
Step 3: Use filters to view specific departments, wards, patient groups, or time periods.
Step 4: Analyze KPI cards, charts, and patient records to monitor healthcare performance.
The dashboard instantly transforms raw data into meaningful visual insights.
👨⚕️ Who Can Benefit from This Healthcare Analytics Dashboard in HTML
This dashboard is ideal for healthcare professionals and organizations that need a clear and modern analytics solution.
It is especially useful for:
🏥 Hospital Administrators – Monitor operational and financial performance.
📊 Healthcare Data Analysts – Analyze trends, KPIs, and patient outcomes.
🩺 Clinical Quality Teams – Track readmissions, satisfaction, and clinical results.
💼 Healthcare Consultants – Present healthcare insights with a professional web dashboard.
⚙️ Operations Managers – Monitor patient flow, bed usage, and department efficiency.
💻 Healthcare IT Teams – Use a modern HTML-based reporting solution for browser access.
Any healthcare organization aiming to improve efficiency, reporting, and patient care can benefit from this dashboard.
Click here to read the Detailed blog post
Watch the step-by-step video tutorial: