

Managing manufacturing operations without clear analytics can quickly become overwhelming. Adhesives and sealants manufacturers deal with complex data including production costs, raw material expenses, plant performance, regional sales, and profitability metrics. When this information is scattered across multiple spreadsheets, decision-making becomes slow and inefficient.
This is exactly why the Adhesives and Sealants Dashboard in Excel is designed.
This ready-to-use Excel dashboard transforms raw operational data into clear visual insights. Instead of reviewing multiple reports, managers can monitor key performance indicators, analyze plant efficiency, track regional revenue, and evaluate profitability from one centralized dashboard.
Built using Excel Pivot Tables, Pivot Charts, slicers, and automated calculations, this dashboard allows users to explore operational performance interactively and identify opportunities to improve production efficiency and profitability.
Whether you are a manufacturing manager, financial analyst, supply chain professional, or business executive, this dashboard provides the analytical clarity needed to make smarter decisions.
🚀 Key Feature of Adhesives and Sealants Dashboard in Excel
The dashboard includes several powerful features designed specifically for manufacturing analytics.
📊 Centralized KPI Monitoring
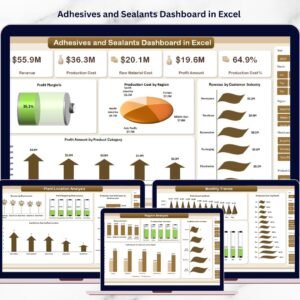
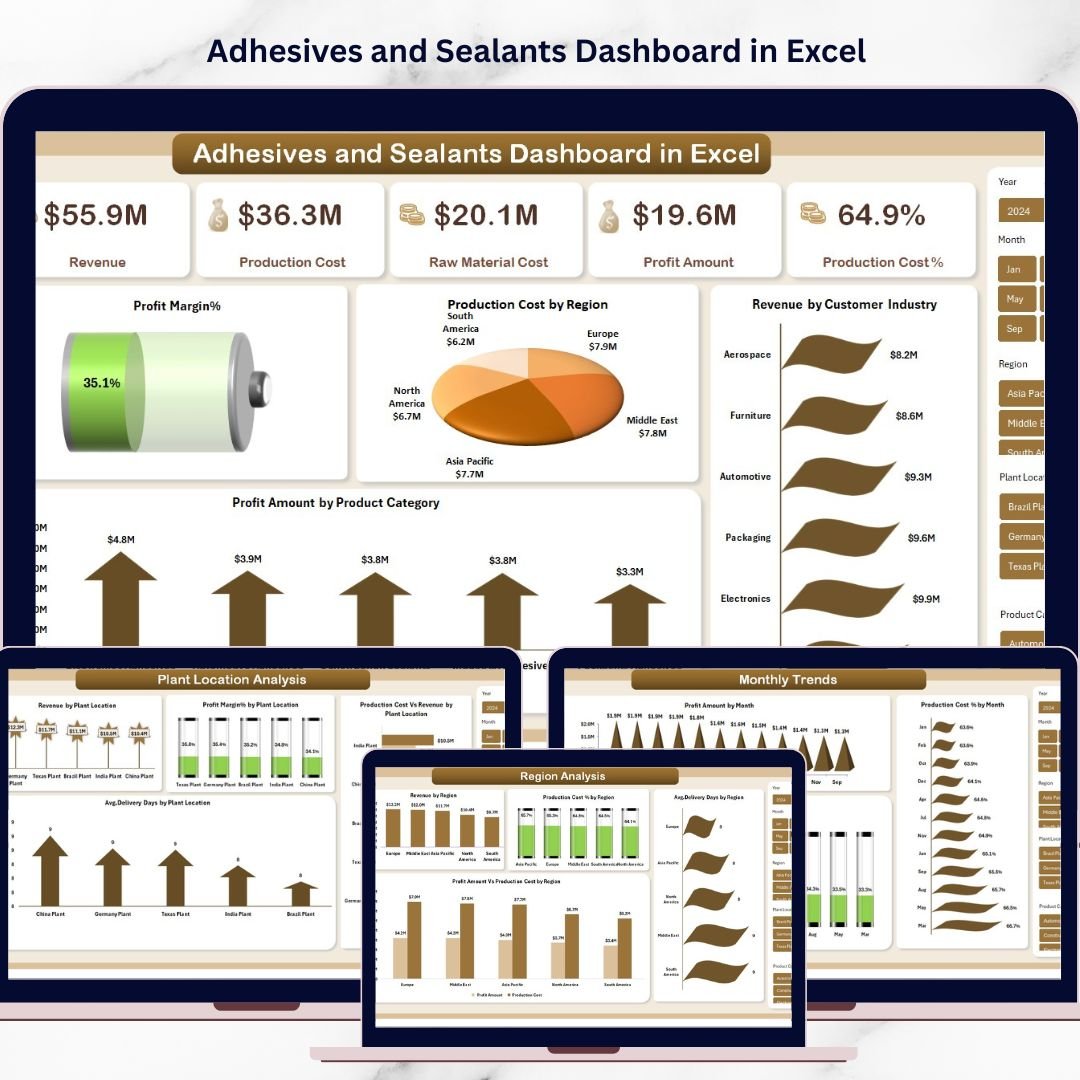
Track key business metrics including Revenue, Production Cost, Raw Material Cost, Profit Amount, Production Cost %, and Profit Margin % in one dashboard.
🏭 Plant Performance Analysis
Analyze how different manufacturing plants perform in terms of revenue generation, delivery efficiency, production cost, and profit margins.
🌍 Regional Sales Insights
Understand which geographic markets are driving revenue and identify regions with higher operational costs.
📦 Product Category Performance
Evaluate how different adhesive and sealant product categories contribute to sales volume, cost structure, and profitability.
📅 Monthly Business Trends
Monitor how profitability, production cost, and profit margins change throughout the year.
⚡ Interactive Filtering with Slicers
Users can easily filter data by region, plant location, product category, and time period for deeper insights.
📈 Dynamic Pivot Charts
All visualizations are built using Excel Pivot Charts, ensuring the dashboard updates automatically when filters change.
💼 Executive-Level Insights
The dashboard provides a high-level overview of operational performance, making it ideal for management reporting and strategic planning.
📊 What’s Inside the Adhesives and Sealants Dashboard in Excel
This Excel dashboard contains five powerful analytical pages designed to provide a comprehensive view of business performance.
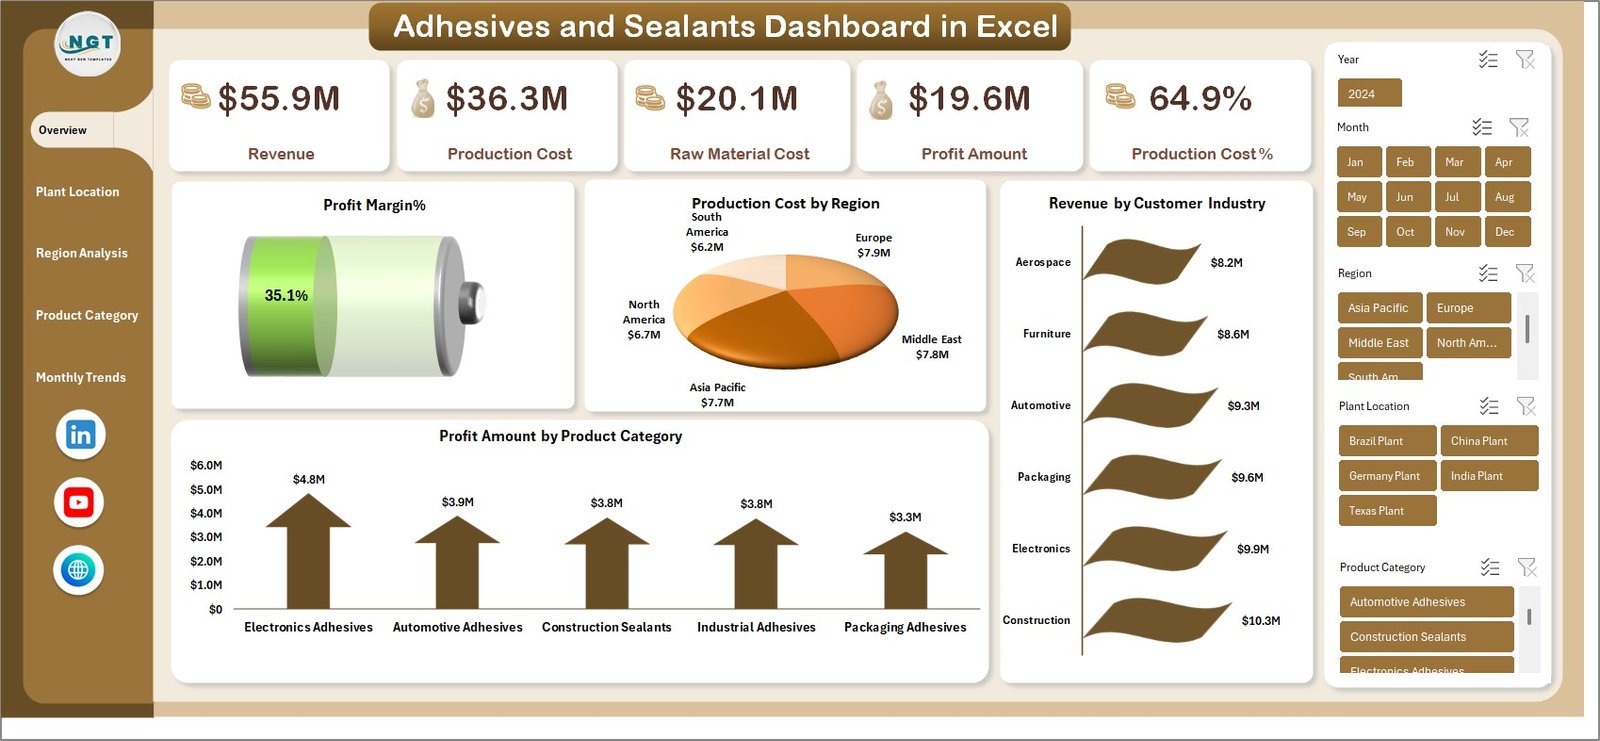
Overview Dashboard
This is the main summary page showing core business KPIs.
Key metrics include:
Revenue
Production Cost
Raw Material Cost
Profit Amount
Production Cost %
Profit Margin %
Charts included:
Production Cost by Region
Revenue by Customer Industry
Profit Amount by Product Category
This page provides a quick snapshot of the company’s overall financial performance.
Plant Location Analysis
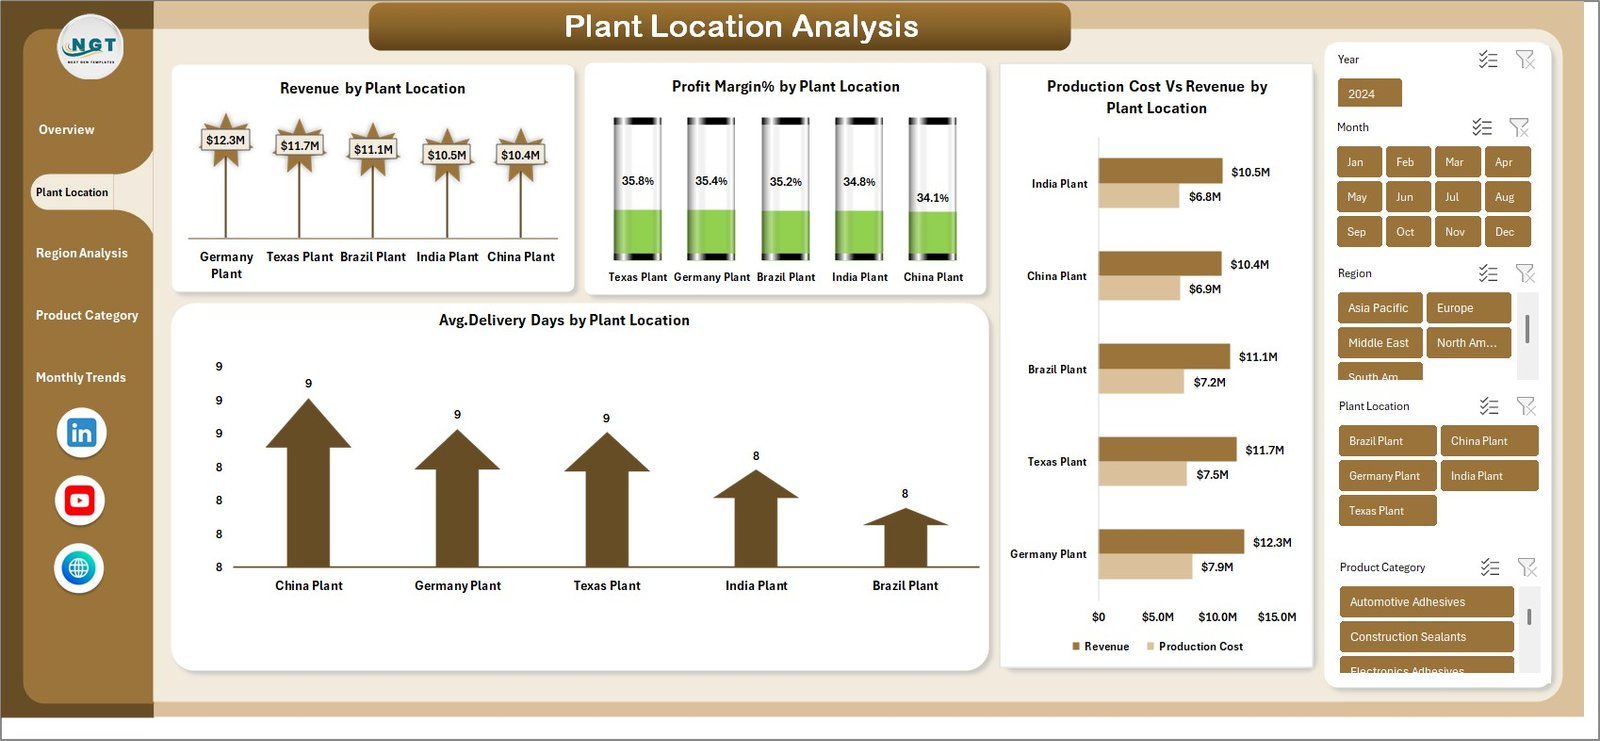
This page helps managers analyze operational efficiency across different production plants.
Charts included:
Revenue by Plant Location
Profit Margin % by Plant Location
Average Delivery Days by Plant Location
Production Cost vs Revenue by Plant Location
This analysis helps identify high-performing plants and operational bottlenecks.
Region Analysis
This page focuses on geographic sales and cost performance.
Charts included:
Revenue by Region
Production Cost % by Region
Profit Amount vs Production Cost by Region
Average Delivery Days by Region
Businesses can identify profitable regions and improve regional strategies.
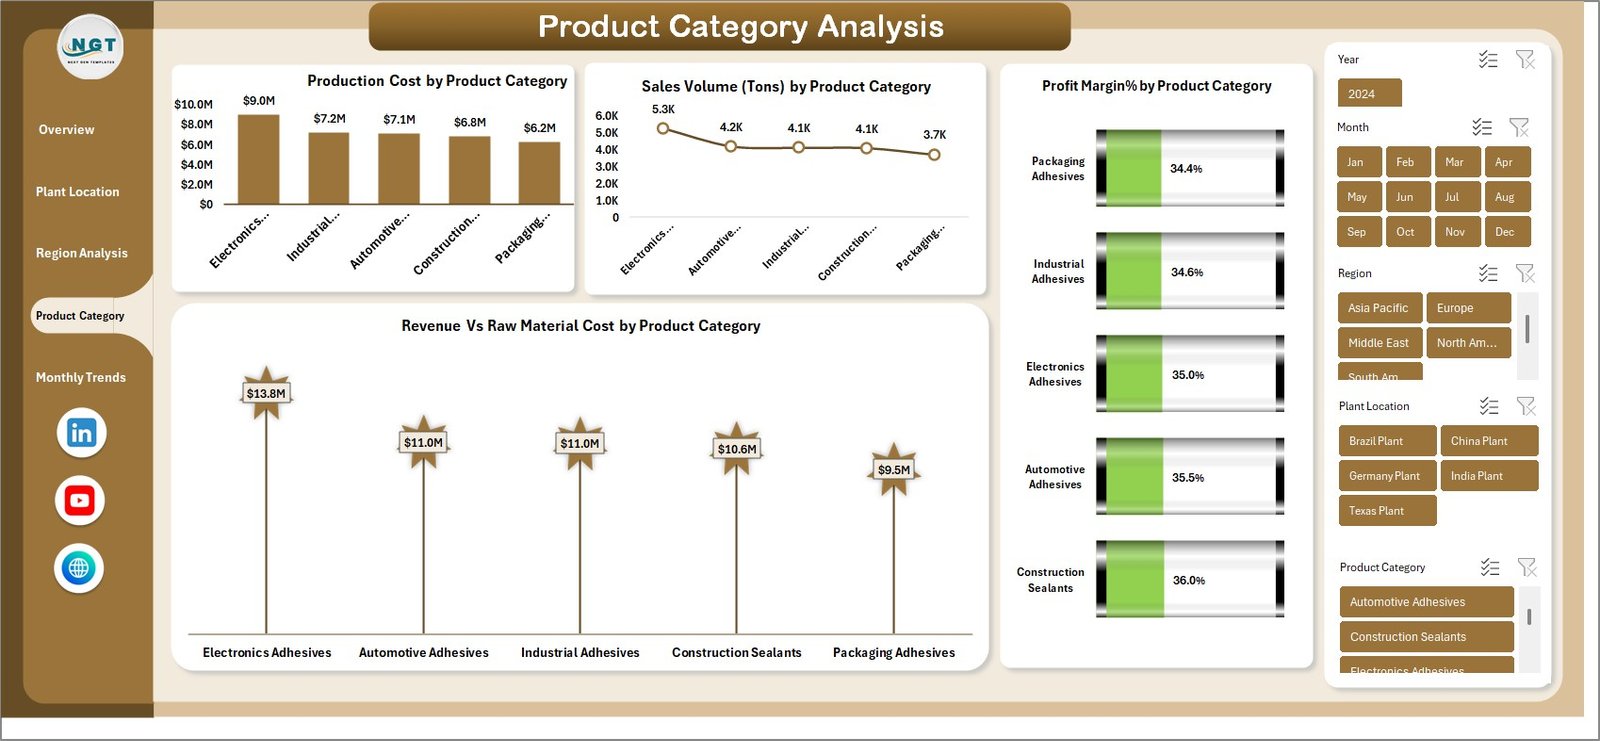
Product Category Analysis
This page evaluates how different adhesive and sealant product categories perform.
Charts included:
Production Cost by Product Category
Sales Volume (Tons) by Product Category
Revenue vs Raw Material Cost by Product Category
Profit Margin % by Product Category
Managers can easily identify high-demand and high-profit product lines.
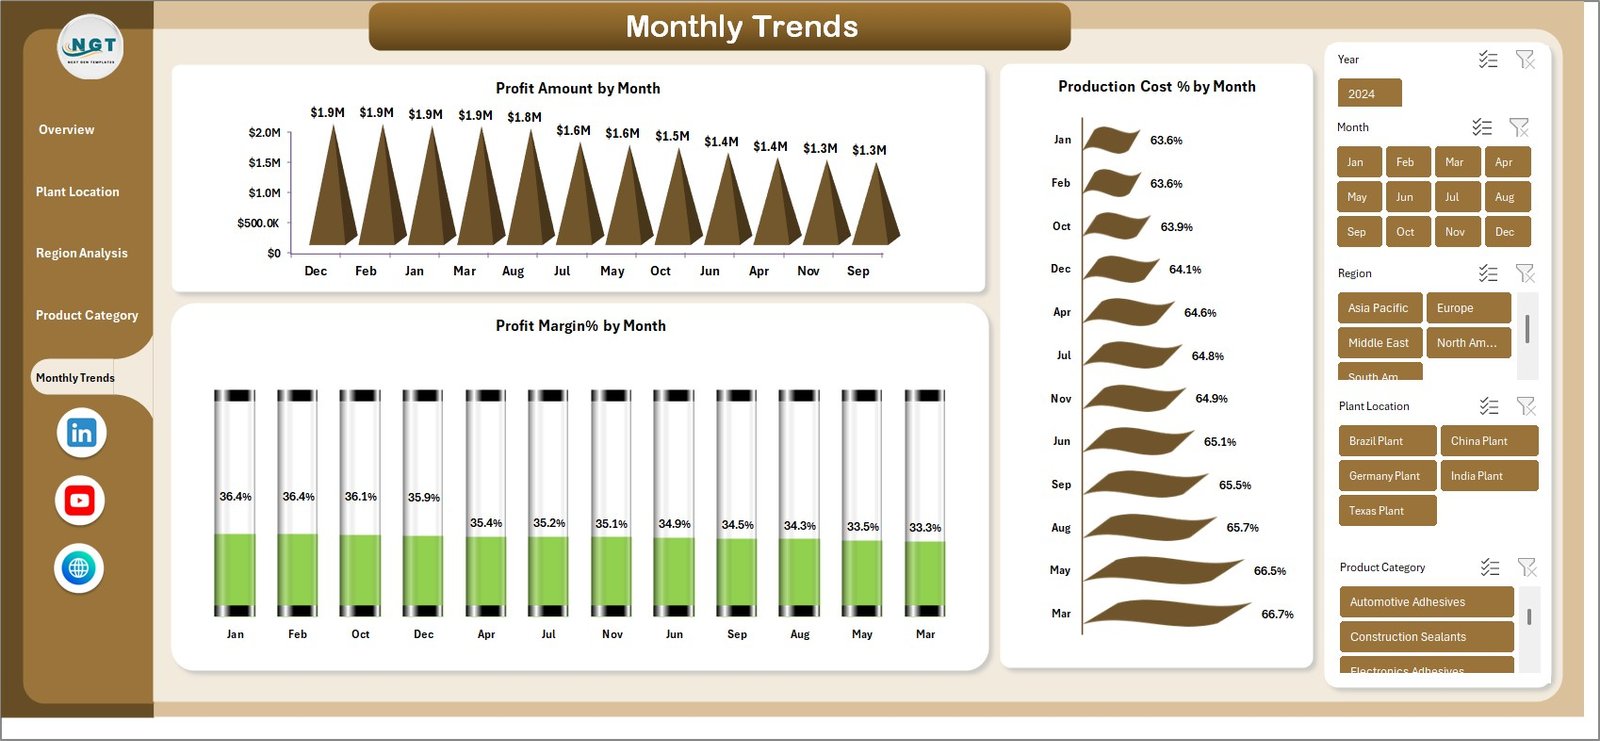
Monthly Trends
The monthly trends page tracks performance across the year.
Charts included:
Profit Amount by Month
Profit Margin % by Month
Production Cost % by Month
This page helps businesses identify seasonal trends and long-term profitability patterns.
⚙️ How to Use the Adhesives and Sealants Dashboard in Excel
Using the dashboard is simple and does not require advanced Excel expertise.
1️⃣ Import or paste your operational data into the provided data sheet.
2️⃣ Refresh Pivot Tables to update the dashboard automatically.
3️⃣ Use slicers and filters to analyze performance by region, plant, or product category.
4️⃣ Review KPIs and charts to identify trends and operational issues.
5️⃣ Use the insights to improve production planning, cost control, and sales strategies.
Because everything is built with pivot tables and charts, the dashboard automatically updates whenever the data changes.
👥 Who Can Benefit from This Adhesives and Sealants Dashboard in Excel
This dashboard is extremely valuable for professionals involved in manufacturing and operations.
🏭 Manufacturing Managers
Monitor plant efficiency and optimize production processes.
💰 Finance Teams
Track production cost structures and evaluate profit margins.
📊 Sales Teams
Analyze regional sales performance and customer industries.
🚚 Supply Chain Managers
Monitor delivery timelines and logistics efficiency.
👔 Business Executives
Review high-level KPIs and make strategic decisions.
📈 Operations Analysts
Identify trends and operational improvement opportunities.
Click here to read the Detailed blog post
Watch the step-by-step video tutorial:
Visit our YouTube channel to learn step-by-step video tutorials
https://youtube.com/@PKAnExcelExpert
Compatibility and Requirements
- Works in Microsoft Excel desktop (Excel 2016 or later, or Microsoft 365).
- The dashboard uses Pivot Tables, Pivot Charts and slicers. Microsoft explains slicers in Use slicers to filter data.
Frequently Asked Questions
Which pages does the dashboard include?
Five pages: Overview Dashboard, Plant Location Analysis, Region Analysis, Product Category Analysis and Monthly Trends.
Which KPIs does it track?
Revenue, Production Cost, Raw Material Cost, Profit Amount, Production Cost % and Profit Margin %.
How do I update the dashboard with my own data?
Paste your operational data into the provided data sheet, then refresh the Pivot Tables. The charts update automatically.
Can I filter the results?
Yes. Slicers let you filter by region, plant location, product category and time period.
Is there a Power BI version?
Yes. See the Adhesives and Sealants Dashboard in Power BI.
Related Adhesives and Manufacturing Templates
- Adhesives and Sealants KPI Dashboard in Excel: a KPI-focused view for the same industry
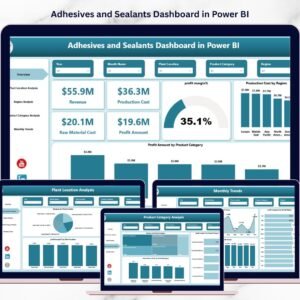
- Adhesives and Sealants Dashboard in Power BI: the Power BI edition of this dashboard
- Adhesives and Sealants KPI Dashboard in Power BI: KPI tracking in Power BI
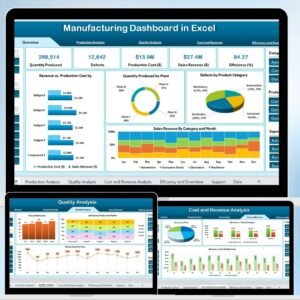
- Manufacturing Dashboard in Excel: a general manufacturing dashboard
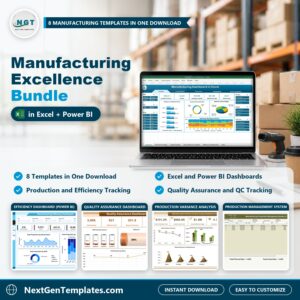
- Manufacturing Excellence Bundle: 8 manufacturing templates in one download
Browse all Excel dashboards or the Excel manufacturing templates.