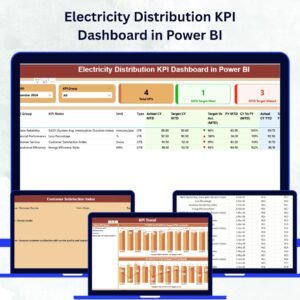
Electric utilities operate in a high-pressure environment where every minute of downtime matters. Substations, transformers, feeders, smart meters, and transmission lines must perform flawlessly. However, when maintenance data sits in scattered spreadsheets, decision-making becomes slow, reactive, and risky.
What if you could see your entire maintenance performance in one powerful, interactive dashboard?
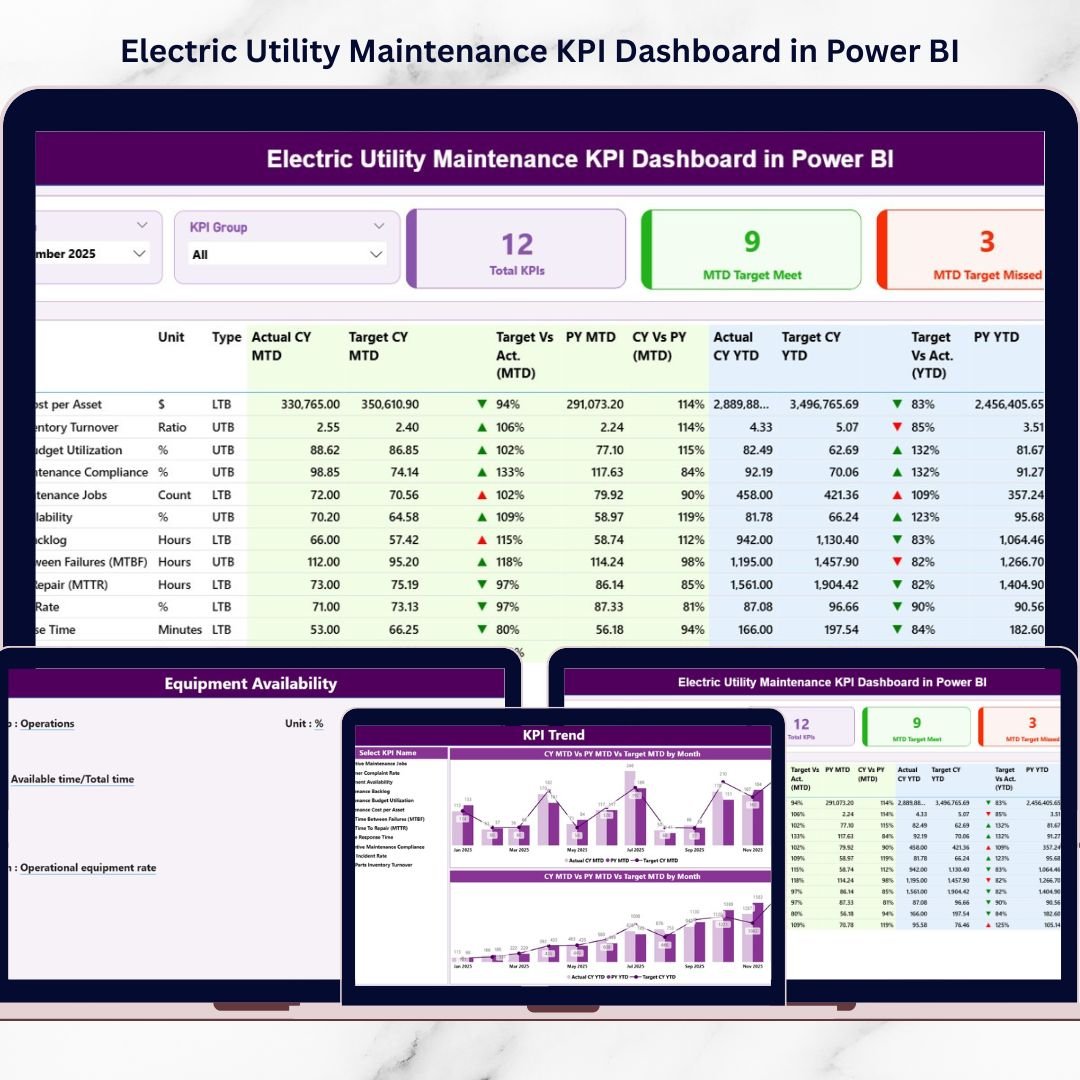
The Electric Utility Maintenance KPI Dashboard in Power BI is your complete digital control center. It transforms Excel data into dynamic visuals, smart comparisons, and instant performance insights inside Microsoft Power BI. Instead of manual reporting, you gain automation, clarity, and speed.
If you want stronger reliability, better cost control, and faster decisions — this dashboard is built for you.
🚀 Key Feature of Electric Utility Maintenance KPI Dashboard in Power BI
This ready-to-use solution includes 3 powerful and structured Power BI pages designed for complete visibility.
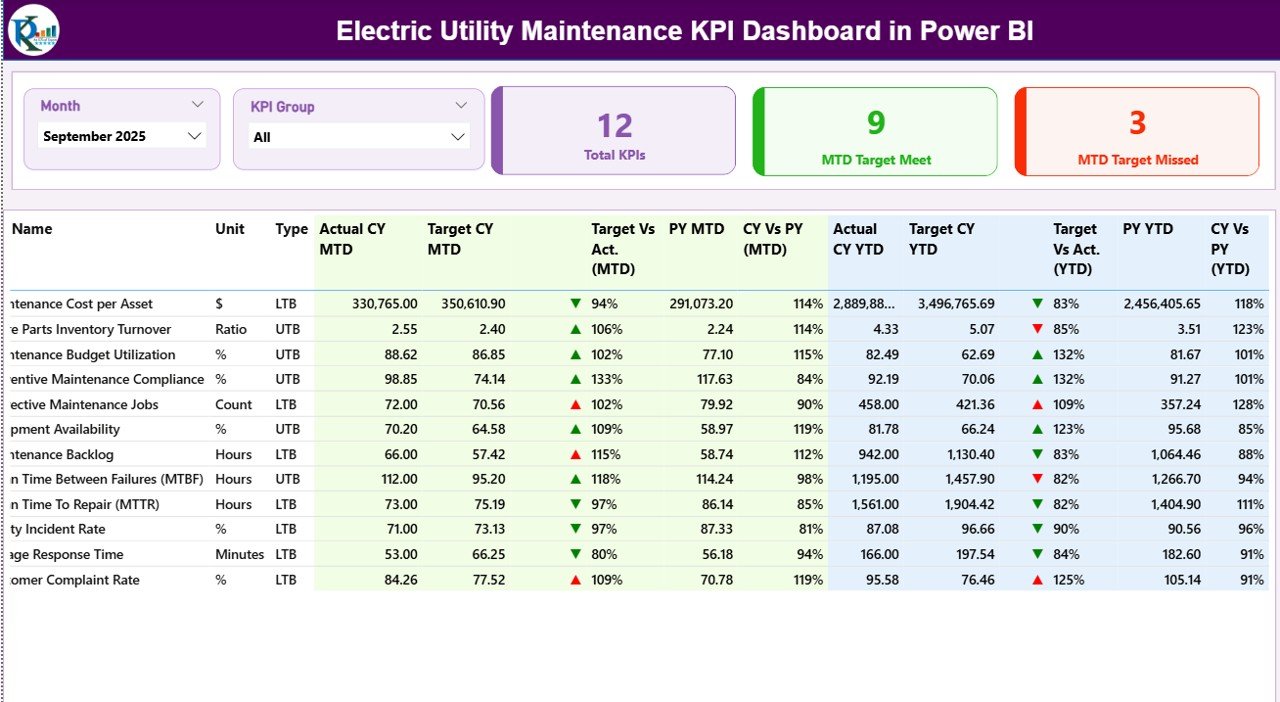
📊 Interactive Summary Page – Filter by Month and KPI Group using slicers that update the entire dashboard instantly.
🎯 Smart KPI Cards – Instantly view Total KPI Count, MTD Target Meet, and MTD Target Missed values.
📈 MTD & YTD Performance Tracking – Monitor both short-term and cumulative progress.
📉 Target vs Actual Comparison – Automatically calculate percentage gaps with visual indicators.
🔄 Current Year vs Previous Year Analysis – Instantly identify improvement or decline trends.
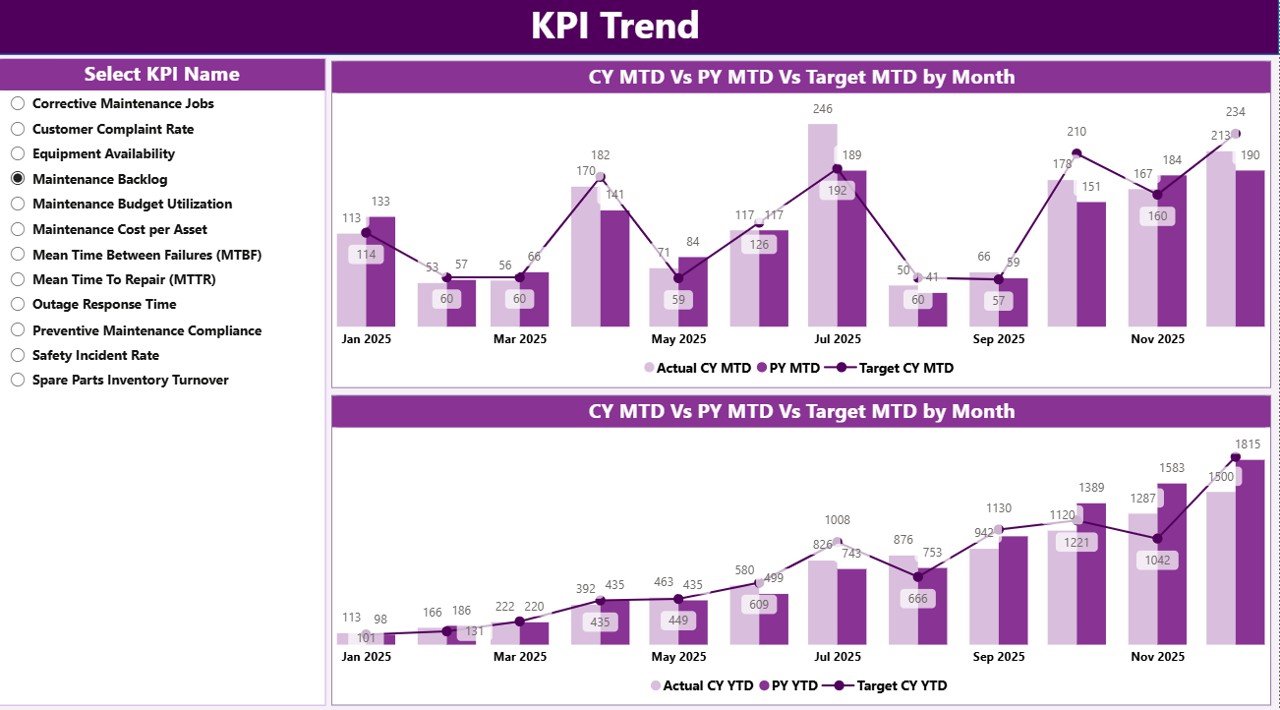
📊 KPI Trend Page with Combo Charts – Visual comparison of Actual, Target, and PY performance.
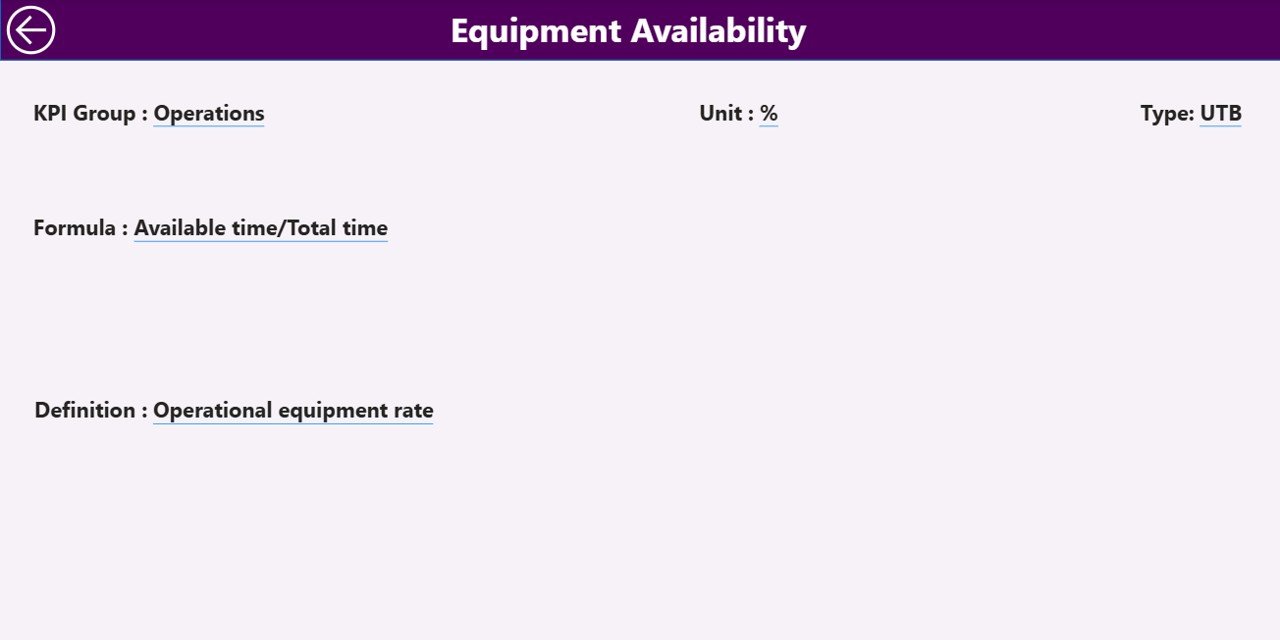
📘 Drill-Through KPI Definition Page – View KPI formulas, definitions, and classifications with one click.
Because everything updates dynamically, you always work with real-time insights.
📦 What’s Inside the Electric Utility Maintenance KPI Dashboard in Power BI
This dashboard is powered by a clean and structured Excel data model. It ensures easy data entry and smooth Power BI refresh.
Inside the solution, you get:
✅ Input_Actual Sheet for MTD & YTD performance
✅ Input_Target Sheet for monthly and yearly goals
✅ KPI Definition Sheet for documentation and transparency
✅ Structured KPI classification (LTB / UTB)
✅ Built-in DAX calculations for comparisons
✅ Automated performance icons (▲ / ▼)
✅ Dynamic slicers for instant filtering
You can track reliability KPIs like SAIDI and SAIFI, maintenance KPIs like MTTR and downtime hours, financial KPIs like Maintenance Cost per Asset, and more.
It is fully scalable. You can add new KPIs without rebuilding the dashboard.
⚙️ How to Use the Electric Utility Maintenance KPI Dashboard in Power BI
Using this dashboard is simple and structured.
1️⃣ Enter actual performance data in the Excel Input_Actual sheet.
2️⃣ Add monthly and YTD targets in the Input_Target sheet.
3️⃣ Define KPIs clearly in the KPI Definition sheet.
4️⃣ Refresh Power BI to update visuals.
5️⃣ Use slicers to filter by month or KPI group.
6️⃣ Drill through to review KPI definitions and formulas.
Within minutes, you gain full control of your maintenance performance.
No advanced Power BI skills required.
👥 Who Can Benefit from This Electric Utility Maintenance KPI Dashboard in Power BI
This dashboard is ideal for:
⚡ Maintenance Managers
⚡ Utility Operations Heads
⚡ Asset Management Teams
⚡ Reliability Engineers
⚡ Compliance Officers
⚡ Utility Executives
Because the visuals are clean and intuitive, both technical and non-technical users can understand performance instantly.
💡 Why This Dashboard Is a Game Changer
✔ Centralized monitoring in one interactive screen
✔ Faster decision-making with real-time visuals
✔ Improved accountability with target comparisons
✔ Stronger preventive maintenance planning
✔ Clear historical benchmarking
✔ Reduced downtime risks
✔ Scalable and customizable system
✔ Professional reporting without complex enterprise software
Instead of reacting to breakdowns, you start predicting performance gaps early.
That’s the power of structured KPI intelligence.
### Click here to read the Detailed blog post
Visit our YouTube channel to learn step-by-step video tutorials
Youtube.com/@PKAnExcelExpert