
The footwear industry operates in a fast-paced and highly competitive environment where manufacturers must balance production efficiency, quality control, operational costs, and delivery timelines. However, many factories still rely on scattered spreadsheets and manual reporting, which makes performance tracking slow and unreliable.
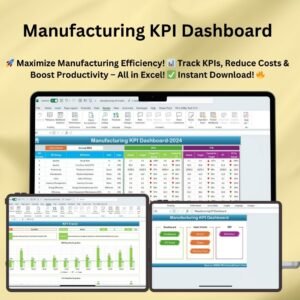
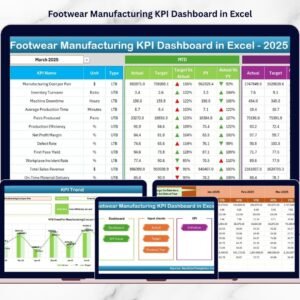
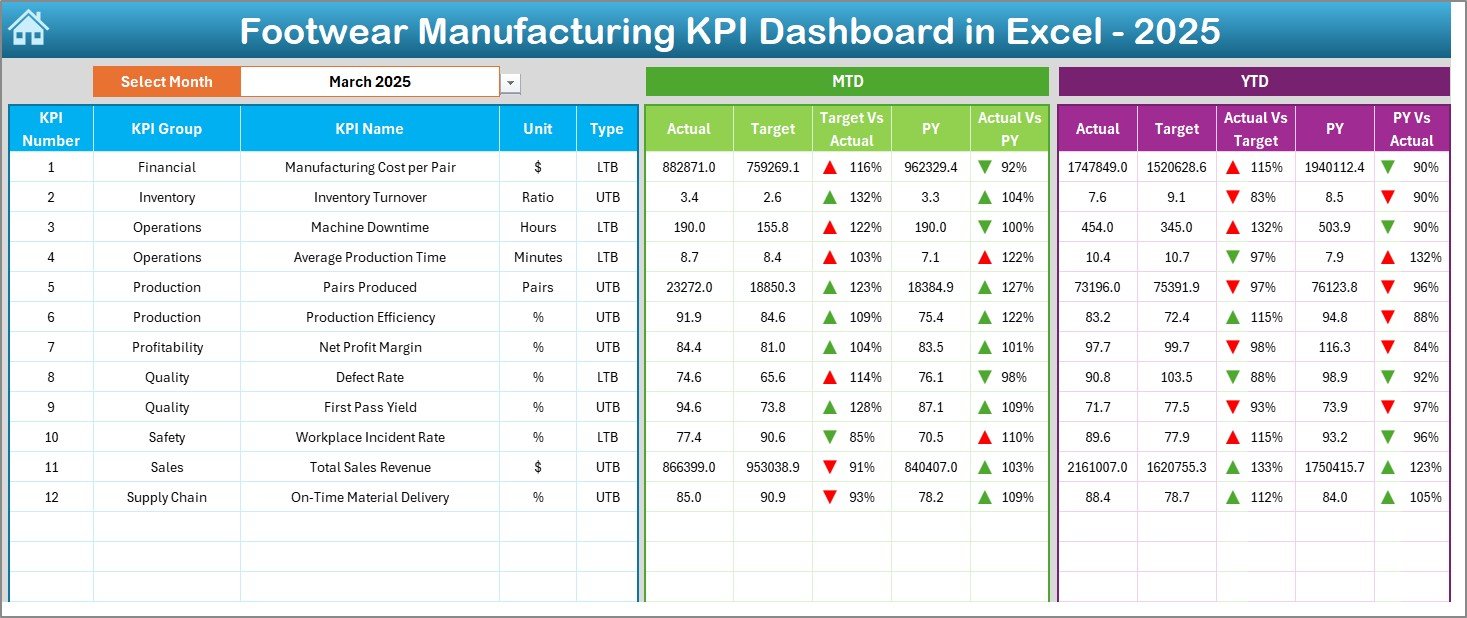
The Footwear Manufacturing KPI Dashboard in Excel solves this challenge by transforming raw production data into clear, visual insights. Instead of analyzing multiple reports, managers can monitor all key performance indicators (KPIs) from one centralized dashboard and make faster, data-driven decisions.
This ready-to-use Excel dashboard helps footwear manufacturers improve productivity, reduce defects, and optimize operations without investing in expensive analytics software.
⭐ Key Feature of Footwear Manufacturing KPI Dashboard in Excel
📊 Centralized KPI Monitoring
Track production, quality, delivery, and cost KPIs in one place.
📅 Dynamic Month Selection
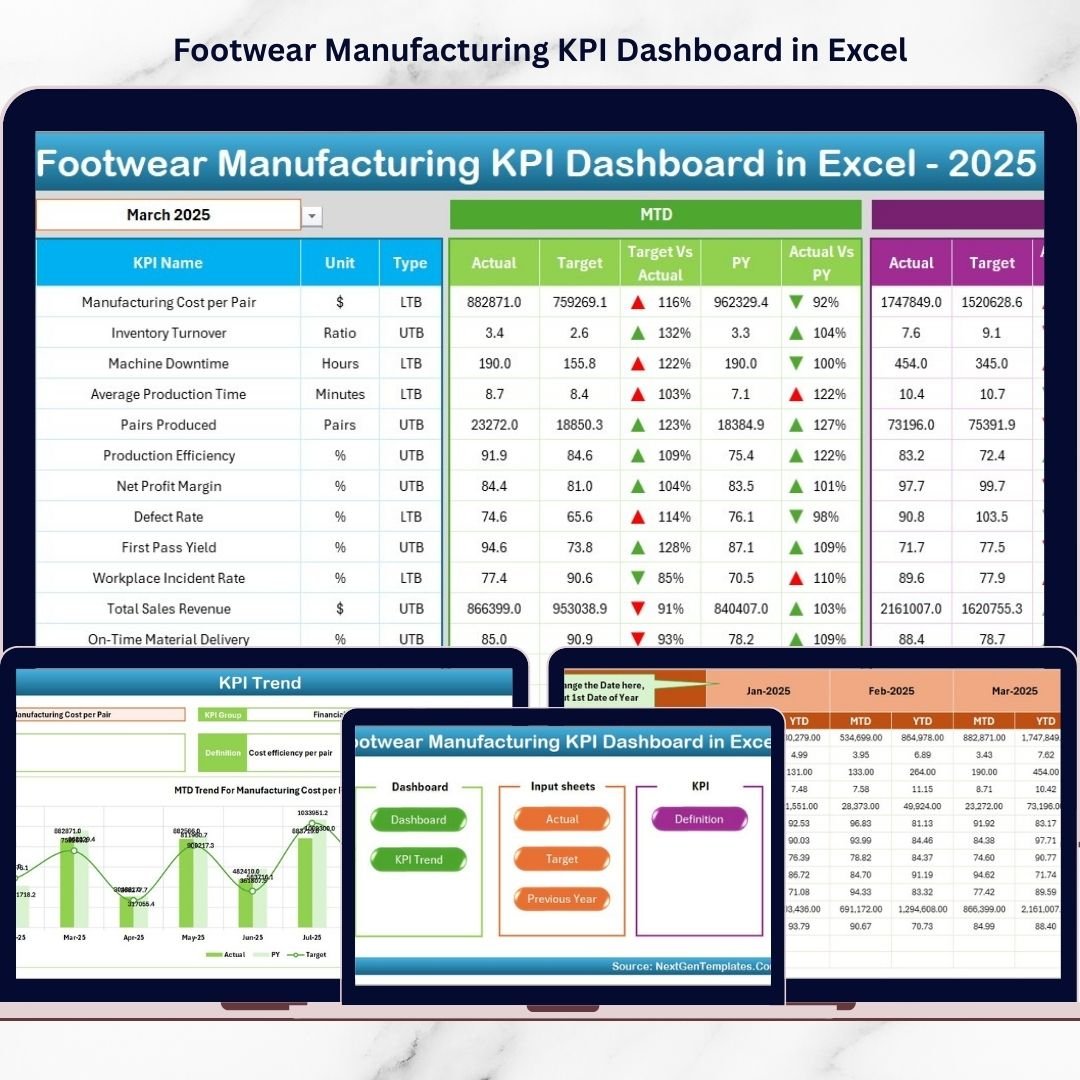
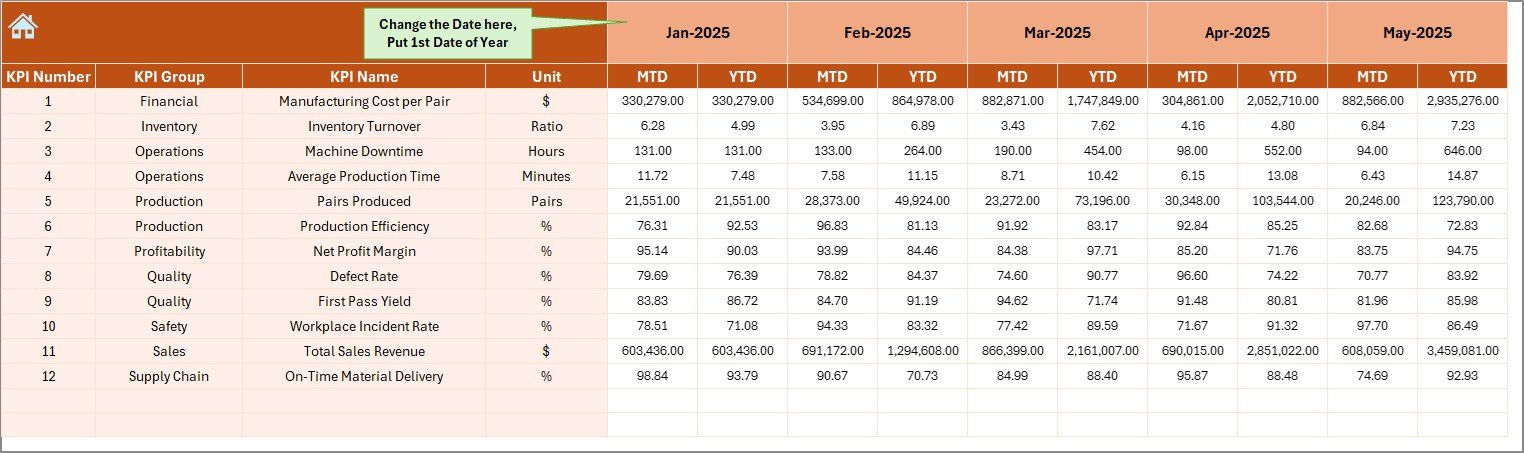
Select a month from cell D3 and automatically update the entire dashboard.
📈 MTD & YTD Performance Tracking
Monitor both short-term and long-term manufacturing performance.
🔼 Visual Performance Indicators
Conditional formatting arrows instantly highlight improvement or decline.
🏭 Manufacturing-Focused KPI Design
Built specifically for footwear production workflows.
📉 Actual vs Target Comparison
Identify performance gaps immediately.
🕒 Previous Year Benchmarking
Compare current results with historical performance.
⚡ Automated Calculations
Reduce manual reporting effort with built-in formulas.
📂 What’s Inside the Footwear Manufacturing KPI Dashboard
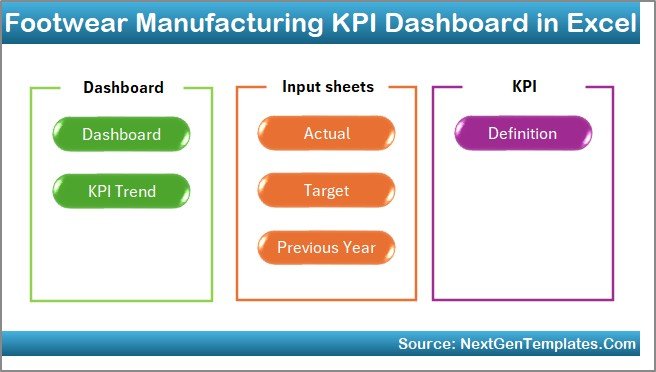
The Excel template contains 7 structured worksheets:
✔️ Home Sheet – Navigation center with quick-access buttons
✔️ Dashboard Sheet – Complete KPI performance overview
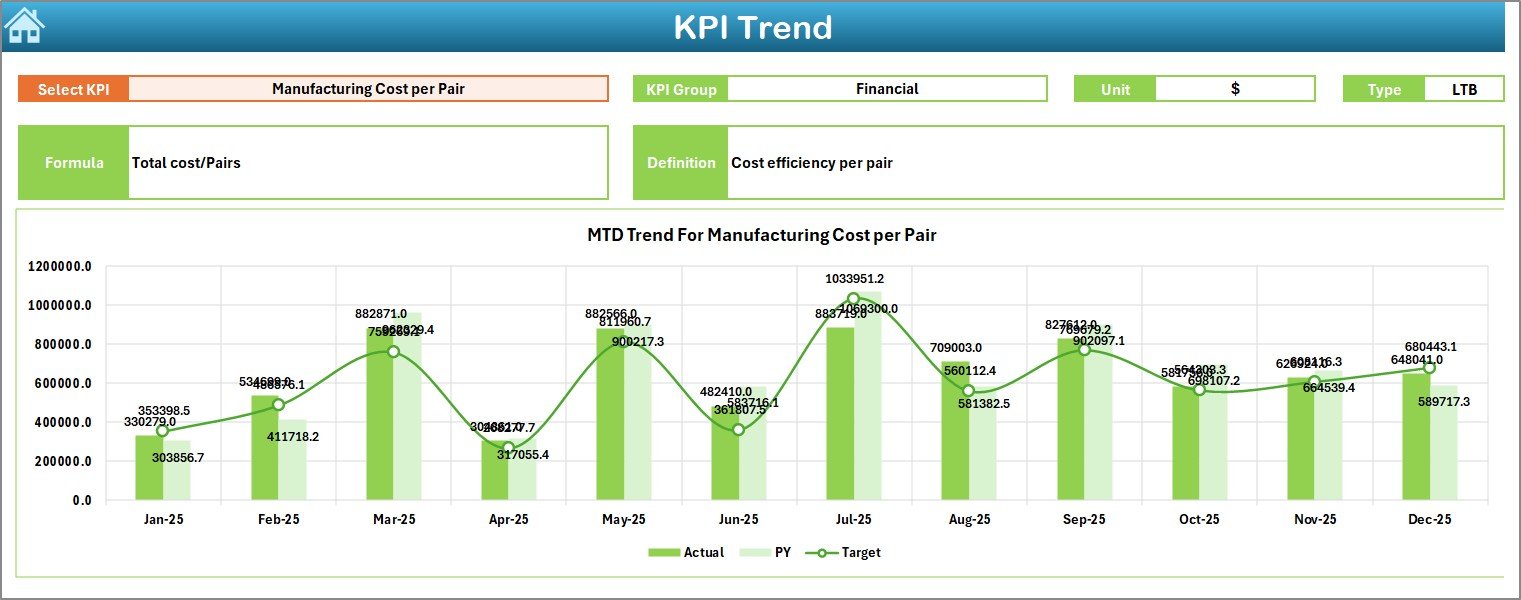
✔️ KPI Trend Sheet – Detailed KPI trend analysis
✔️ Actual Numbers Input Sheet – Data entry section
✔️ Target Sheet – Goal planning and KPI targets
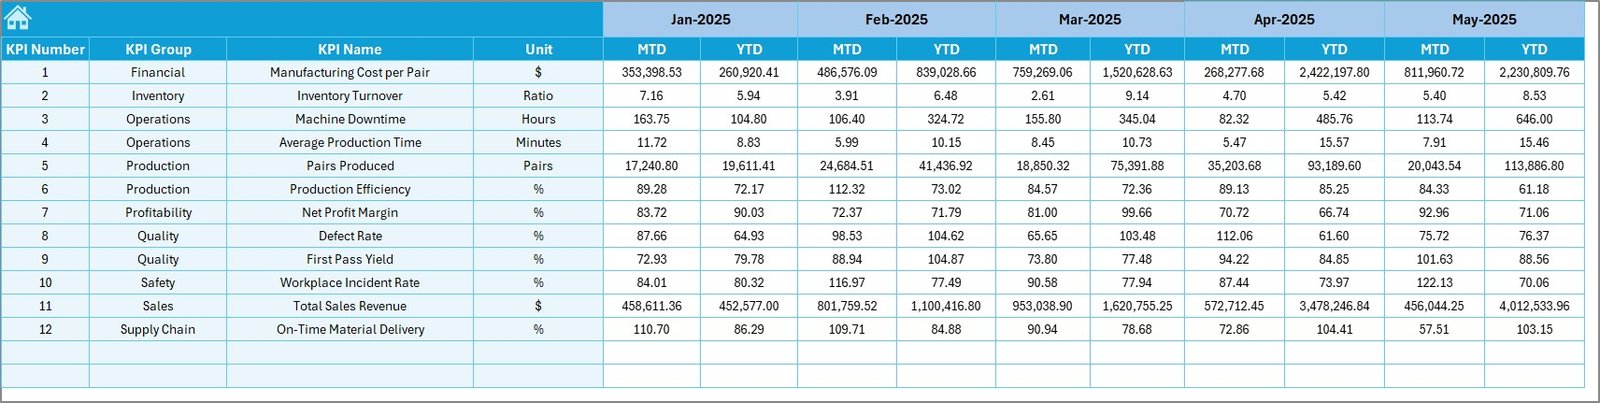
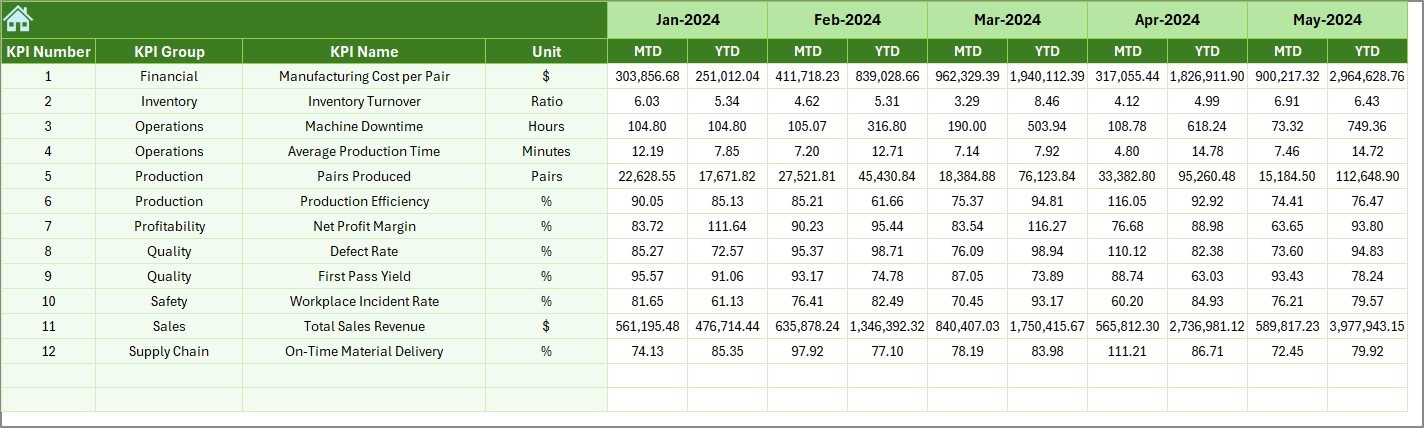
✔️ Previous Year Numbers Sheet – Historical benchmarking
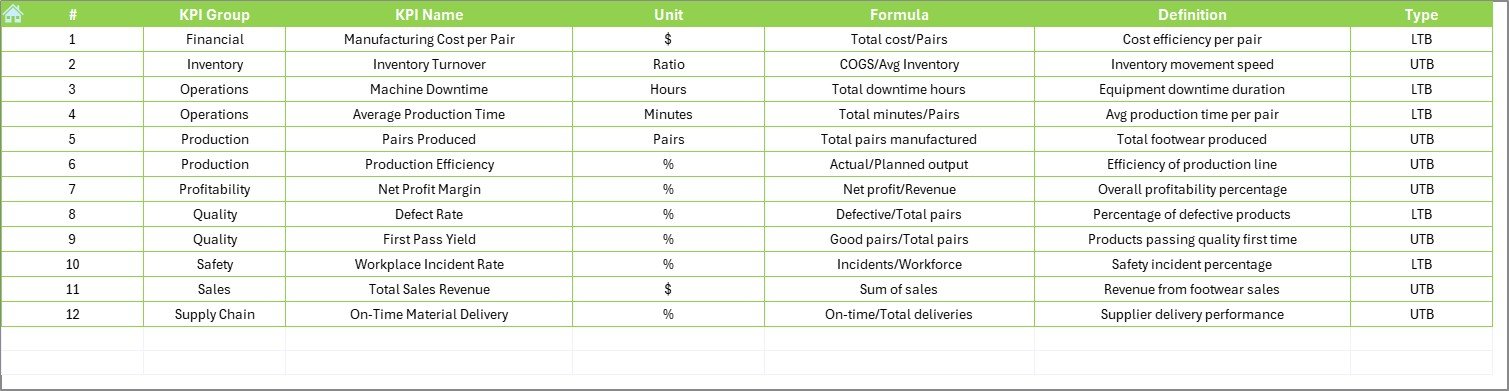
✔️ KPI Definition Sheet – KPI formulas and documentation
Each sheet works together to create a complete manufacturing performance management system.
🛠️ How to Use the Footwear Manufacturing KPI Dashboard
Follow these simple steps:
Step 1: Define manufacturing KPIs in the KPI Definition sheet
Step 2: Enter monthly targets in the Target sheet
Step 3: Add previous year data for comparison
Step 4: Input actual production numbers regularly
Step 5: Select reporting month from dropdown
Step 6: Analyze insights and take corrective action
Once data is entered, the dashboard updates automatically.
📊 KPIs You Can Track in Footwear Manufacturing
Production KPIs
Units produced per day
Production efficiency %
Machine utilization rate
Line productivity
Quality KPIs
Defect rate
Rework percentage
First-pass yield
Inspection quality score
Delivery KPIs
On-time delivery %
Order completion rate
Lead time performance
Cost KPIs
Cost per pair
Labor efficiency
Material utilization rate
These KPIs provide a complete operational performance view.
🎯 Who Can Benefit from This Dashboard?
This dashboard is ideal for:
✅ Factory Managers
✅ Production Supervisors
✅ Quality Control Teams
✅ Operations Managers
✅ Footwear Business Owners
✅ Supply Chain Analysts
Both small manufacturers and large factories can implement it easily.
🚀 Advantages of Footwear Manufacturing KPI Dashboard in Excel
✔️ Centralized performance visibility
✔️ Faster decision-making
✔️ Improved production monitoring
✔️ Early defect detection
✔️ Better cost control
✔️ Easy implementation using Excel
✔️ No expensive software required
Because Excel is already familiar to most teams, adoption becomes quick and simple.
💡 Best Practices for Maximum Results
Update data weekly or monthly
Track only actionable KPIs
Validate data before entry
Conduct monthly KPI reviews
Train teams on KPI definitions
Compare MTD, YTD, and previous year trends regularly
Following these practices ensures accurate insights and continuous improvement.
📘 Click hare to read the Detailed blog post
📺 Visit our YouTube channel to learn step-by-step video tutorials
👉 https://Youtube.com/@PKAnExcelExpert
Watch the step-by-step video tutorial:
Compatibility and Requirements
- Works in Microsoft Excel desktop (Excel 2016 or later, or Microsoft 365).
- You pick the reporting month from a dropdown in cell D3. Microsoft explains dropdowns in Create a drop-down list.
Frequently Asked Questions
Which worksheets are included?
Seven worksheets: Home, Dashboard, KPI Trend, Actual Numbers Input, Target, Previous Year Numbers and KPI Definition.
How do I update the dashboard?
Enter your actual production numbers in the Actual Numbers Input sheet and your goals in the Target sheet. Then select the month in cell D3 and the dashboard updates.
Can I compare this year with last year?
Yes. Add last year’s figures to the Previous Year Numbers sheet and the dashboard compares them with your actuals and targets.
Does it show month-to-date and year-to-date results?
Yes. The dashboard shows both MTD and YTD performance, with arrows from conditional formatting that mark improvement or decline.
Is there a Power BI version?
Yes. See the Footwear Manufacturing KPI Dashboard in Power BI.
Related Manufacturing Templates
- Footwear Manufacturing KPI Dashboard in Power BI: the same KPIs in Power BI
- Footwear Manufacturing Dashboard in Excel: another footwear dashboard for Excel
- Apparel Manufacturing KPI Dashboard in Excel: a KPI dashboard for apparel production
- Manufacturing KPI Dashboard: a general factory KPI dashboard
- Manufacturing Excellence Bundle: 8 manufacturing templates for Excel and Power BI in one download
Browse all Excel KPI dashboards and Excel manufacturing templates.