In today’s sustainability-driven world, recycling companies must track performance with speed, accuracy, and transparency. However, many recycling plants still rely on scattered spreadsheets and manual reports. As a result, managers struggle to monitor processing efficiency, contamination rates, revenue per ton, and compliance metrics in one centralized view.
That’s exactly why we created the Recycling Companies KPI Dashboard in Power BI — a powerful, ready-to-use business intelligence solution built specifically for recycling and waste management businesses.
This interactive dashboard transforms raw Excel data into meaningful, visual insights. With dynamic slicers, automated target tracking, and year-over-year comparison, you gain complete control over operational, financial, and environmental performance. Consequently, your organization moves from reactive reporting to proactive performance management.
Whether you operate a single recycling facility or manage multiple plants, this dashboard delivers clarity, accountability, and smarter decision-making.
🔑 Key Feature of Recycling Companies KPI Dashboard in Power BI
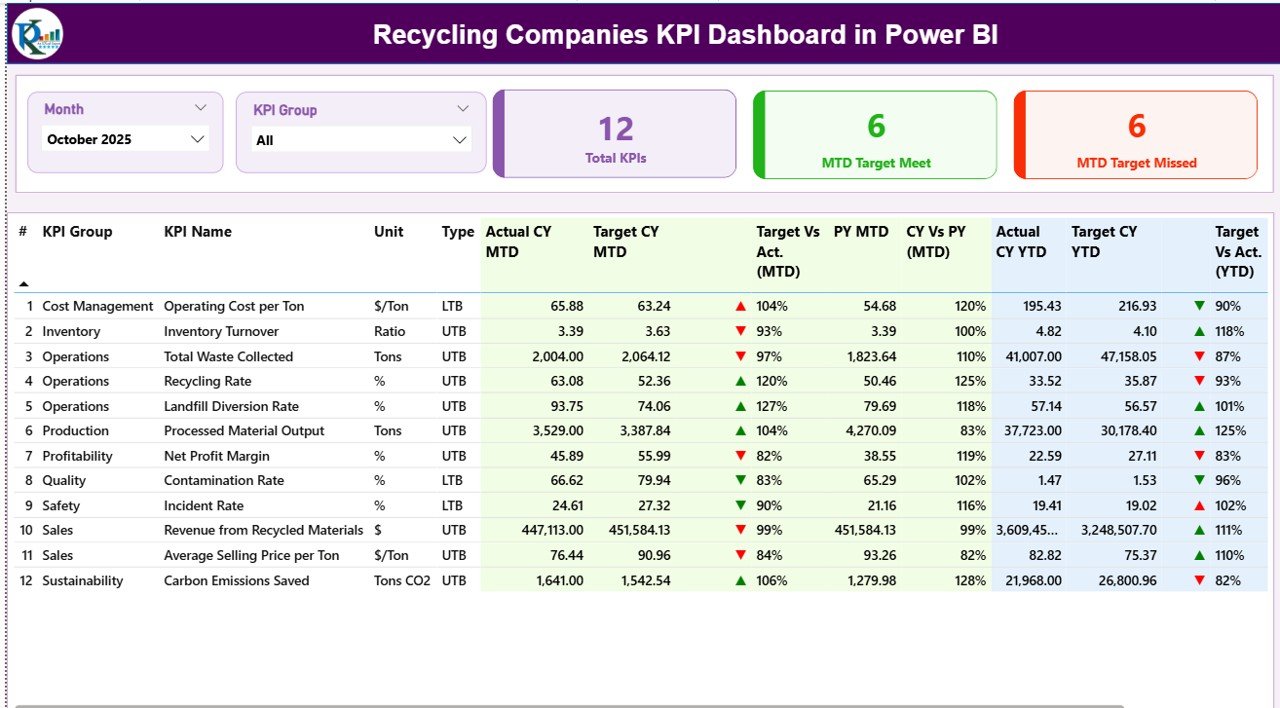
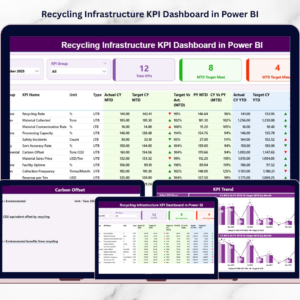
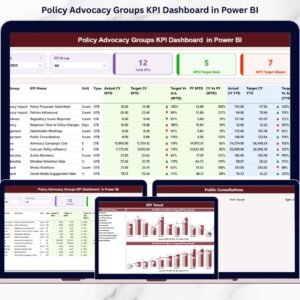
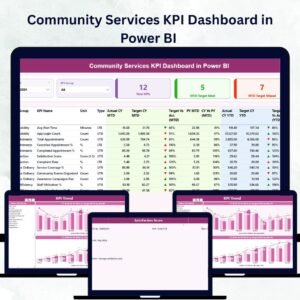
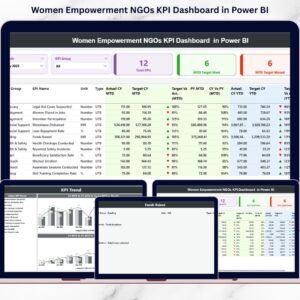
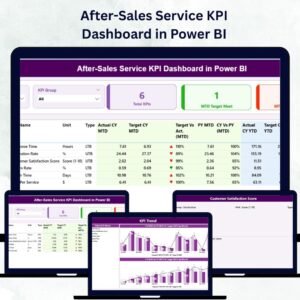
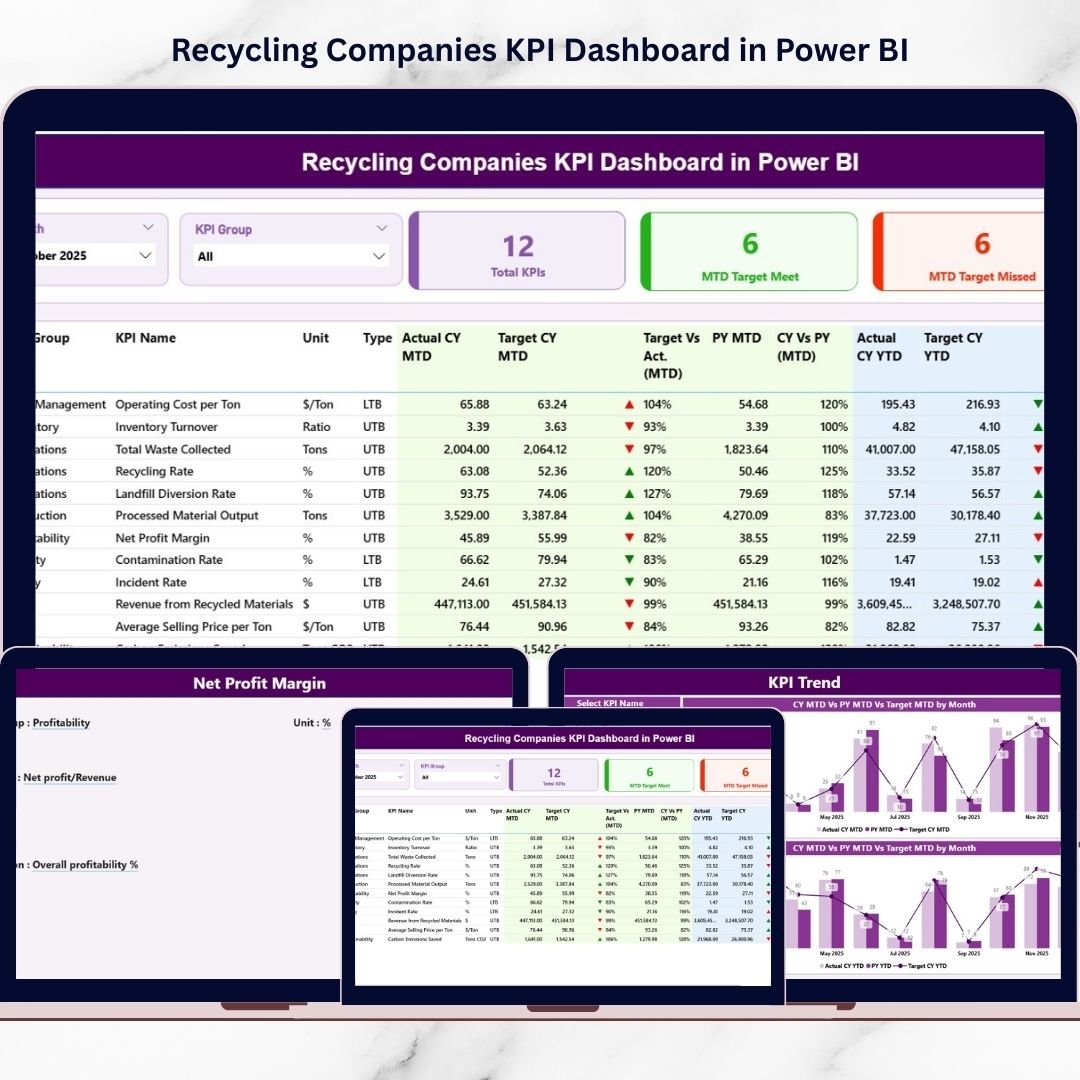
✨ Executive Summary Control Center
Monitor all KPIs in one structured view with dynamic cards and detailed tables.
📊 Interactive Month & KPI Group Slicers
Filter performance instantly by month and KPI category.
🎯 MTD & YTD Performance Tracking
Track Month-to-Date and Year-to-Date metrics with automated variance calculations.
📈 Target vs Actual Indicators
Green ▲ and red ▼ icons instantly show performance health.
🔍 Year-over-Year Comparison
Compare current year results with previous year automatically.
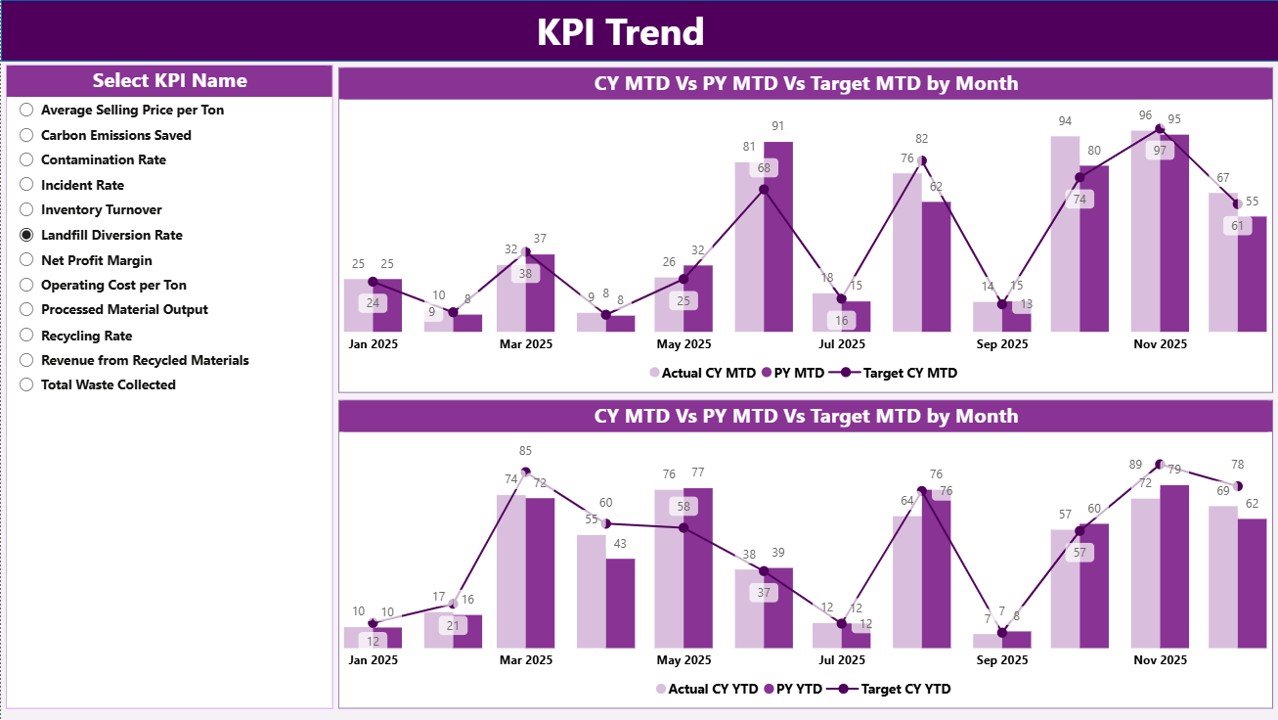
📊 KPI Trend Combo Charts
Visualize MTD and YTD trends using interactive charts.
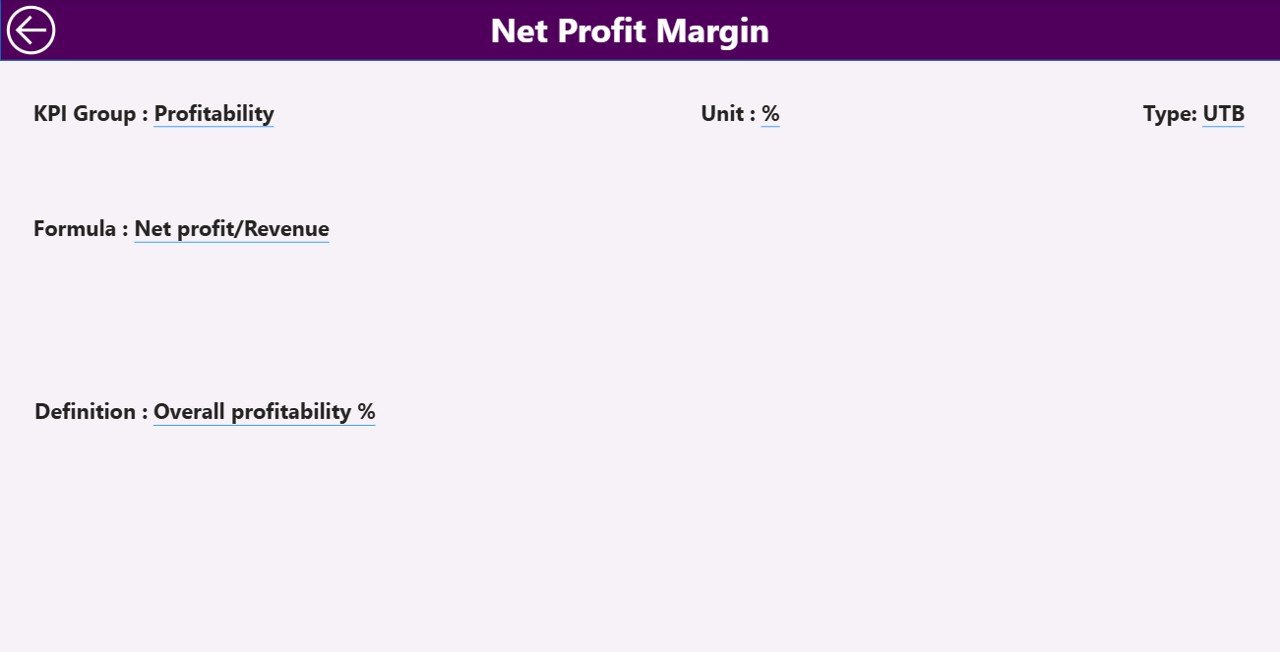
🧠 Drill-Through KPI Definitions
Click any KPI to view formula, definition, unit, and logic.
⚡ Excel-Integrated Data Model
Simply update Excel sheets and refresh Power BI — no redesign required.
📦 What’s Inside the Recycling Companies KPI Dashboard in Power BI
This product delivers a complete, ready-to-use analytics framework.
✔️ Power BI Desktop File (.pbix)
✔️ 3 Interactive Analytical Pages
✔️ Dynamic KPI Cards
✔️ Detailed KPI Performance Table
✔️ MTD & YTD Trend Charts
✔️ Drill-Through KPI Definition Page
✔️ Structured Excel Data Template
Everything is pre-configured so you can start monitoring performance immediately.
🛠️ How to Use the Recycling Companies KPI Dashboard in Power BI
Getting started is simple and efficient.
Step 1: Download and open the PBIX file
Step 2: Update the Excel Input sheets (Actual & Target)
Step 3: Refresh the Power BI dataset
Step 4: Use slicers to filter insights
Step 5: Review KPI performance and trends
Within minutes, your recycling operations will have a professional KPI command center.
🎯 Who Can Benefit from This Recycling Companies KPI Dashboard in Power BI
This dashboard is ideal for organizations that want structured KPI management.
✅ Recycling Plant Managers
✅ Waste Management Companies
✅ Material Recovery Facilities (MRFs)
✅ Environmental Compliance Teams
✅ Finance Managers
✅ Sustainability Officers
✅ Multi-Plant Recycling Operations
If your company wants better visibility, stronger compliance tracking, and improved profitability, this dashboard is essential.
Why This Dashboard Is a Game-Changer
Unlike manual reporting, this dashboard provides:
✔️ Real-time KPI visibility
✔️ Automated target tracking
✔️ Year-over-year performance comparison
✔️ Operational efficiency monitoring
✔️ Financial KPI control
✔️ Environmental impact measurement
As a result, your business shifts from guesswork to structured, data-driven growth.
### Click hare to read the Detailed blog post
📺 Visit our YouTube channel to learn step-by-step video tutorials
👉 Youtube.com/@PKAnExcelExpert