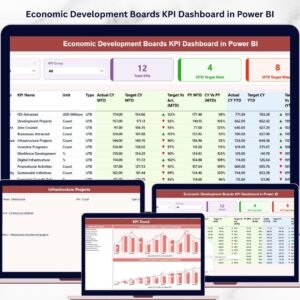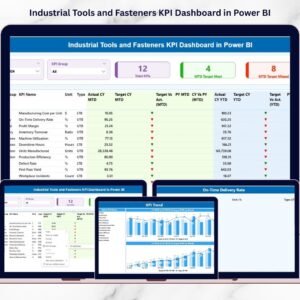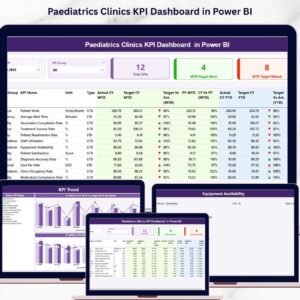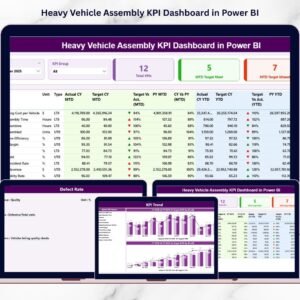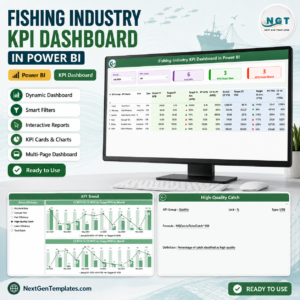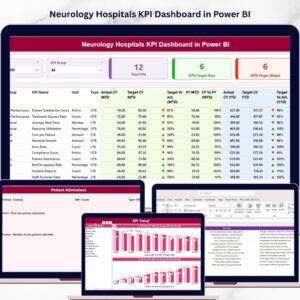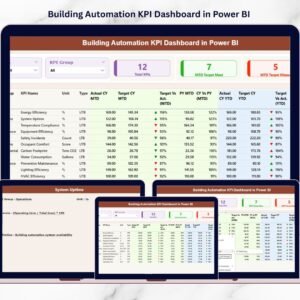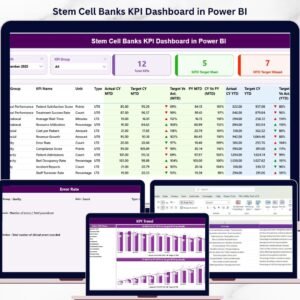
Running a successful winery demands precision, timing, and complete visibility into operations. However, many wineries still depend on scattered spreadsheets and delayed reports. As a result, decision-makers often struggle to monitor production efficiency, fermentation quality, and financial performance in one place.That is exactly why the Winemaking KPI Dashboard in Power BI becomes a game-changer.This ready-to-use and fully interactive dashboard empowers winery owners, production managers, and business analysts to track performance in real time, compare targets instantly, and uncover hidden inefficiencies — all within a professional Power BI interface.
Instead of wasting hours compiling reports, you can now make faster, smarter, and data-driven decisions with confidence.
✅ Key Feature of Winemaking KPI Dashboard in Power BI
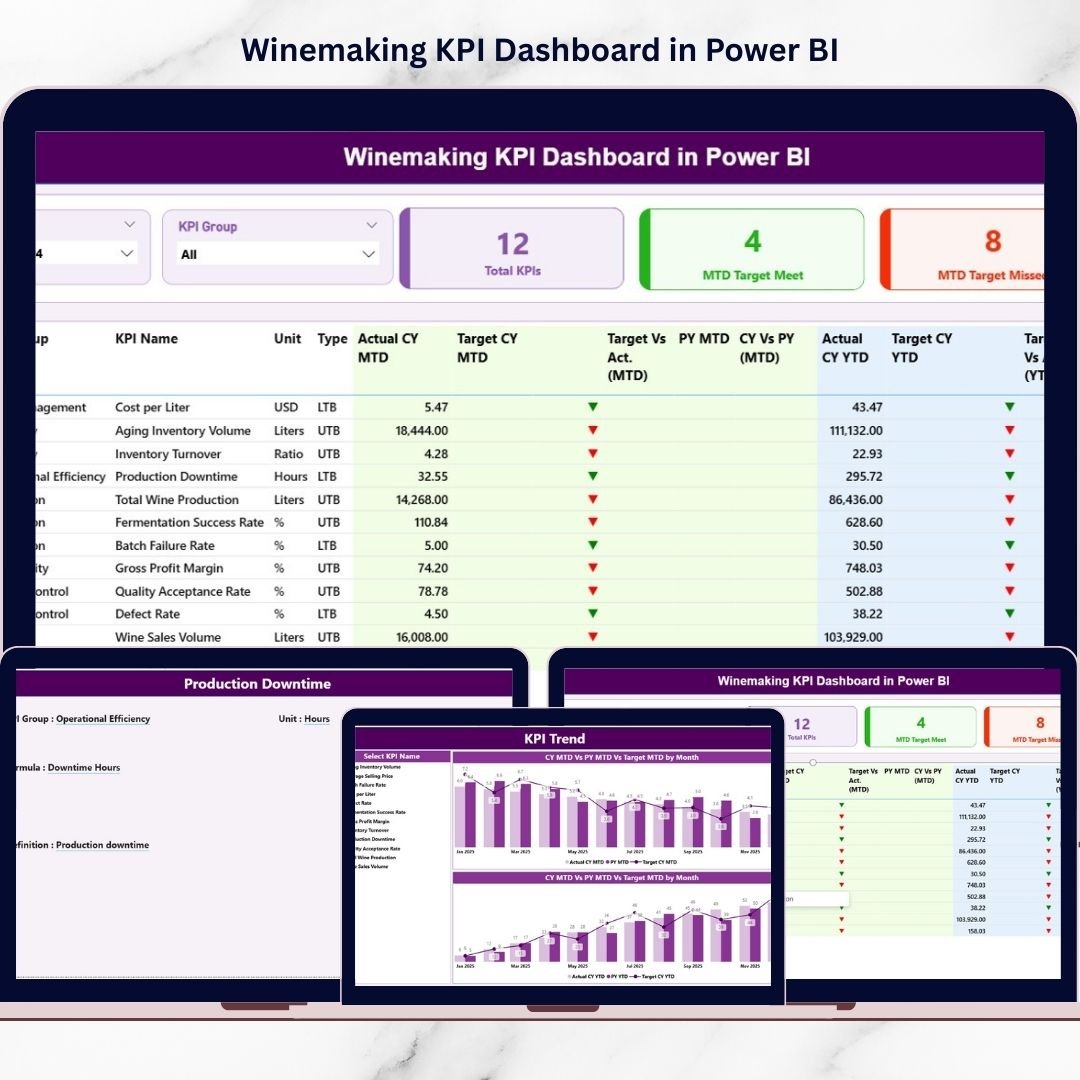
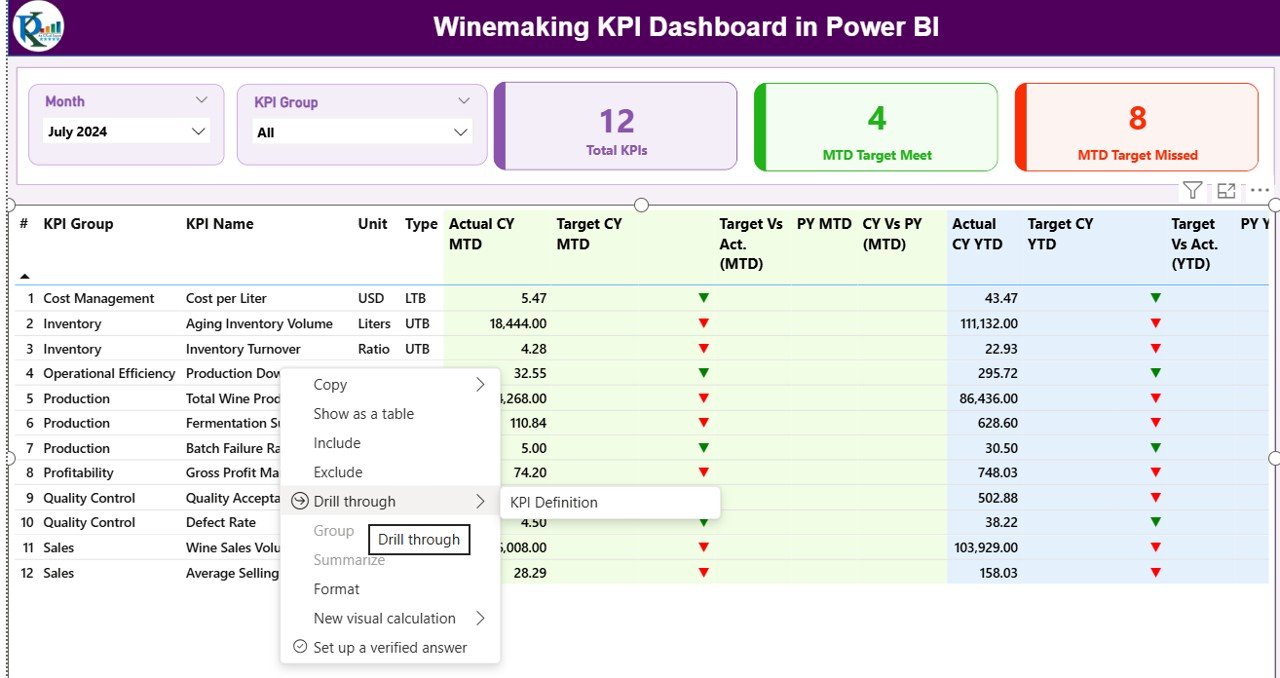
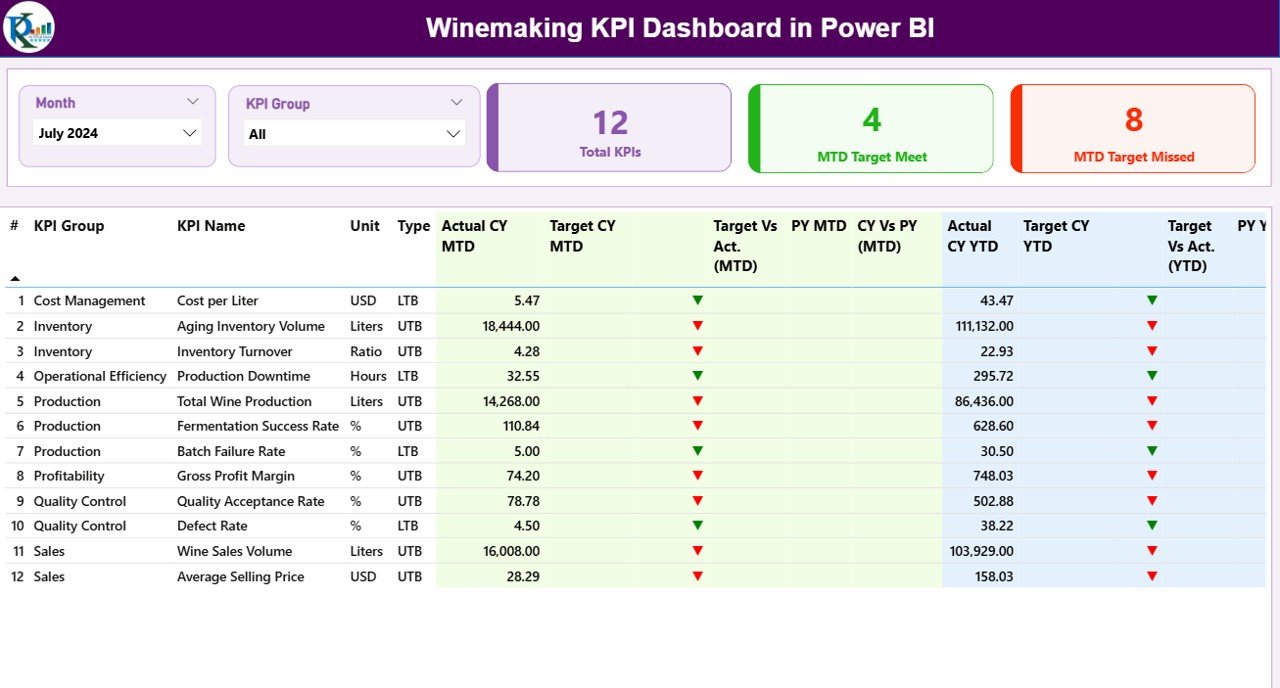
📊 Interactive Summary Page
Get an instant snapshot of overall KPI health with dynamic slicers and smart performance indicators.
🎯 MTD & YTD Performance Tracking
Monitor both short-term and long-term progress to maintain full operational visibility.
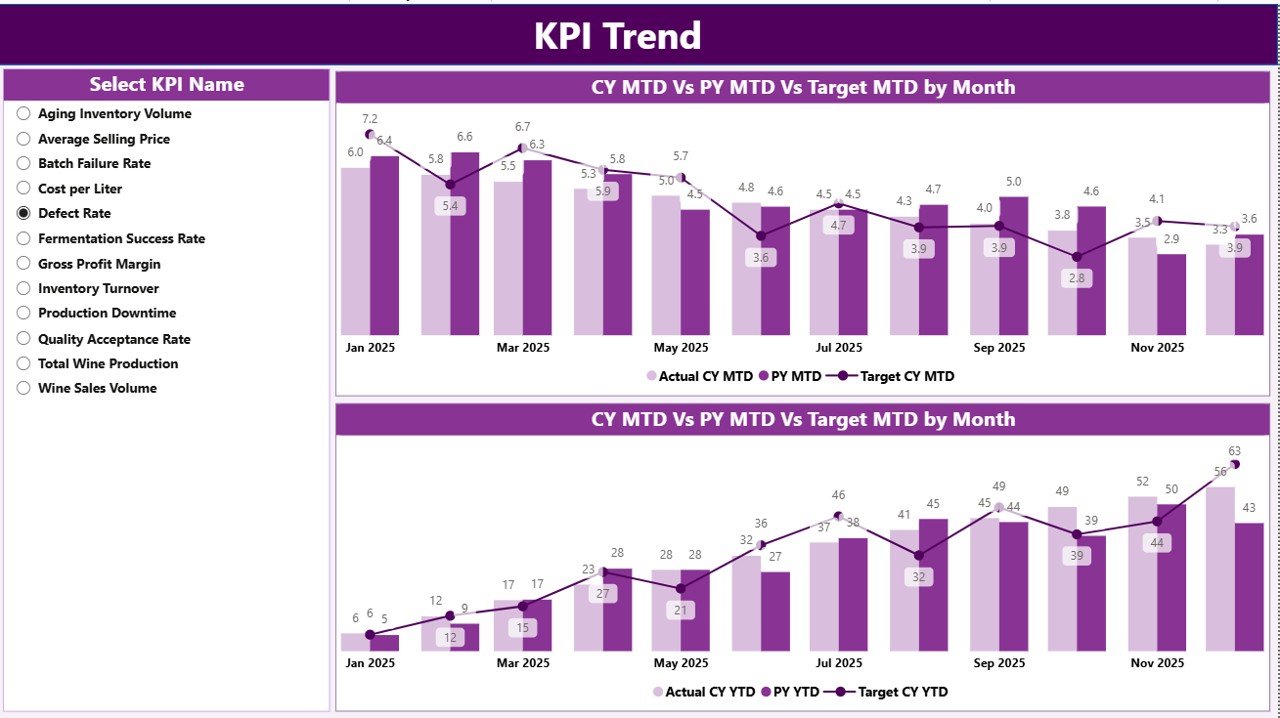
📈 Advanced Trend Analysis
Powerful combo charts reveal monthly and cumulative performance patterns.
🚦 Smart Status Indicators
Green and red arrows quickly highlight whether targets are achieved or missed.
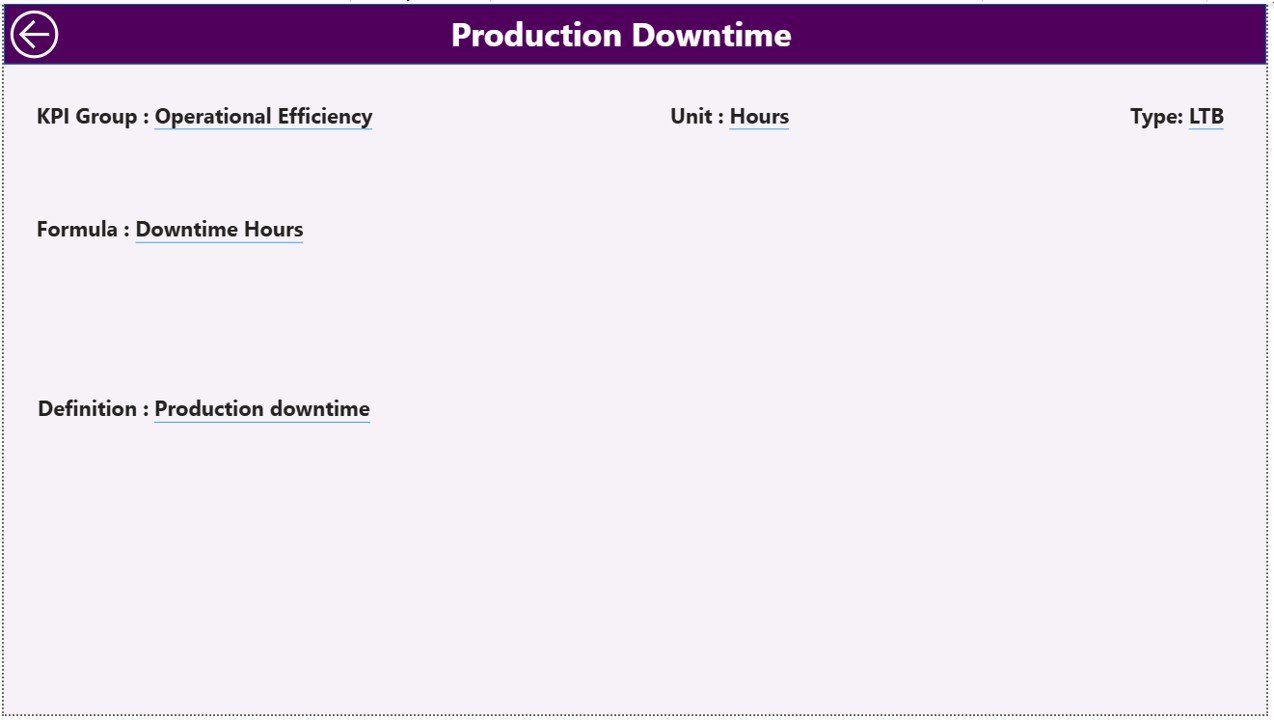
🔍 Drill-Through KPI Intelligence
Access detailed KPI definitions, formulas, and measurement units with one click.
⚡ Dynamic Slicers for Deep Filtering
Filter by Month and KPI Group to focus on specific performance areas instantly.
🔄 Excel-Connected Data Model
Easily update data through Excel and refresh Power BI for real-time insights.
🧭 User-Friendly Navigation
Clean layout and intuitive design ensure smooth user experience.
📦 What’s Inside the Winemaking KPI Dashboard in Power BI
When you download this product, you get a professionally structured Power BI solution designed for wineries.
✔️ Fully functional Power BI dashboard file
✔️ Summary Page with KPI performance overview
✔️ KPI Trend Page with MTD and YTD combo charts
✔️ Drill-through KPI Definition Page
✔️ Prebuilt KPI performance indicators
✔️ Dynamic slicers for interactive analysis
✔️ Excel data templates (Input_Actual, Input_Target, KPI Definition)
✔️ Ready-to-use KPI framework for wineries
Everything comes pre-configured so you can start analyzing immediately.
🛠️ How to Use the Winemaking KPI Dashboard in Power BI
Using this dashboard is simple and requires no advanced Power BI expertise.
Step 1: Populate the Excel sheets (Actual, Target, KPI Definition)
Step 2: Open the Power BI file
Step 3: Refresh the dataset
Step 4: Use slicers to filter by Month or KPI Group
Step 5: Monitor trends and identify performance gaps
Within minutes, you will have a complete winery performance command center.
👥 Who Can Benefit from This Winemaking KPI Dashboard in Power BI
This dashboard is ideal for professionals across the wine industry.
🍷 Winery Owners
📊 Production Managers
💼 Operations Teams
📉 Business Analysts
💰 Finance Managers
🏭 Beverage Manufacturing Units
📈 Performance Monitoring Teams
If your winery depends on data-driven decisions, this dashboard will deliver immediate value.
Click hare to read the Detailed blog post
Watch the step-by-step video tutorial:
Visit our YouTube channel to learn step-by-step video tutorials
YouTube.com/@PKAnExcelExpert