Managing Thousands of Connected Devices Without Clear KPIs? That’s a Risk You Can’t Afford ⚡🌐
IoT service providers operate in a 24/7 digital ecosystem. Devices transmit data continuously. Customers expect zero downtime. SLAs demand precision. Meanwhile, leadership must monitor uptime, response time, revenue impact, and service quality — all at once.
Yet many IoT businesses still rely on fragmented Excel reports.
The result?
Unnoticed SLA breaches.
Hidden downtime trends.
Delayed incident resolution.
Revenue leakage.
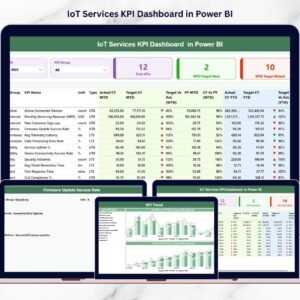
The IoT Services KPI Dashboard in Power BI gives you a centralized, interactive, and intelligent reporting system designed specifically for IoT service providers.
Instead of analyzing scattered sheets, you monitor all IoT KPIs in one dynamic dashboard. Instead of reacting late, you act early.
This ready-to-use Power BI dashboard connects to structured Excel data and transforms raw metrics into powerful visual intelligence.
Key Feature of IoT Services KPI Dashboard in Power BI 📊
This dashboard includes 3 powerful interactive pages inside Power BI Desktop:
✅ Dynamic Month Slicer – Instantly filter performance by month.
✅ KPI Group Slicer – Analyze specific KPI categories easily.
✅ MTD & YTD Comparison – Monitor short-term and long-term performance.
✅ Target vs Actual % Calculation – Identify performance gaps quickly.
✅ Current Year vs Previous Year Benchmarking – Track real growth.
✅ Visual Performance Icons (▲ / ▼) – Instant clarity on KPI status.
✅ Interactive Combo Charts – Compare Actual, Target, and PY visually.
✅ Drill-Through KPI Definition Page – View formula and logic behind each KPI.
Because Power BI provides advanced data modeling and visualization, your IoT reporting becomes smarter and faster.
What’s Inside the IoT Services KPI Dashboard in Power BI 📁
You receive a fully structured Power BI file connected to a clean Excel data source.
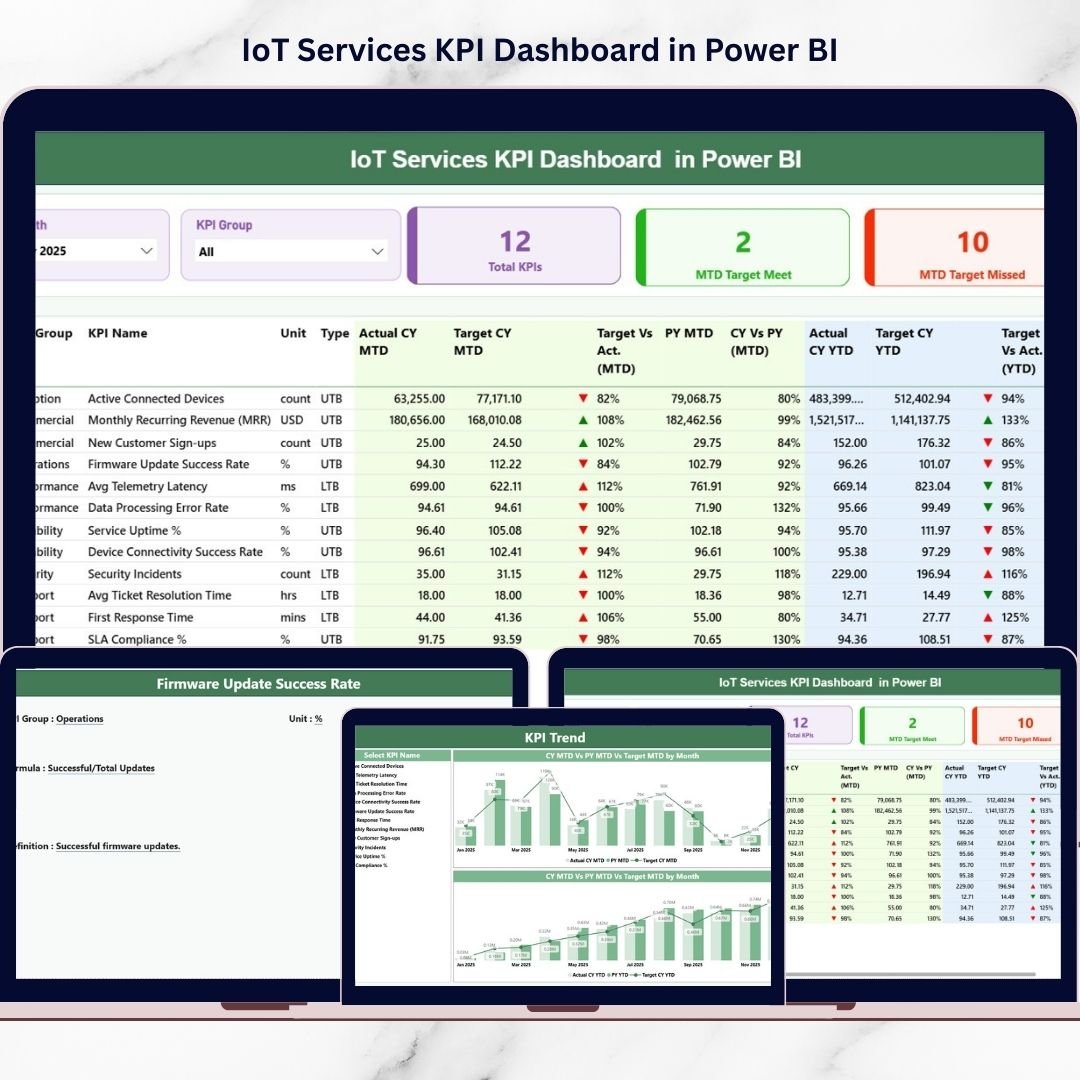
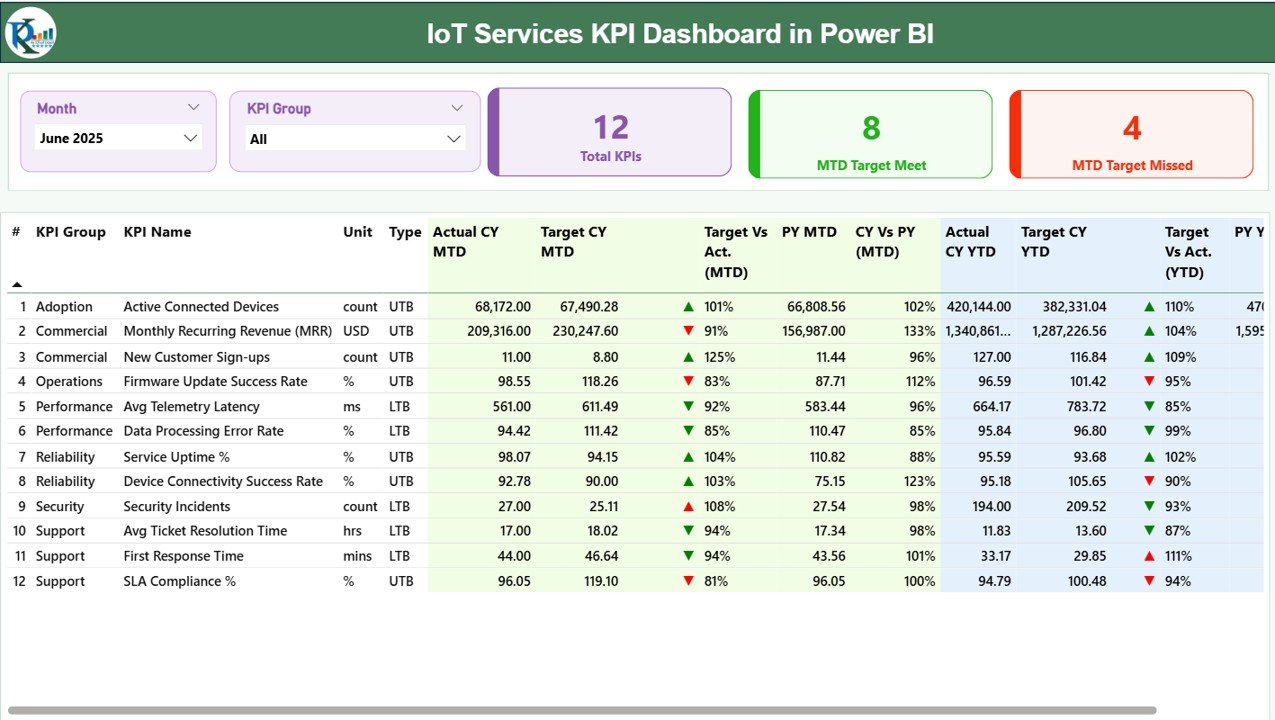
📌 1️⃣ Summary Page – Executive Performance Overview
At the top:
-
Month slicer
-
KPI Group slicer
-
KPI Cards:
-
Total KPIs Count
-
MTD Target Meet Count
-
MTD Target Missed Count
-
Below, a detailed KPI table shows:
MTD Section:
-
Actual CY MTD
-
Target CY MTD
-
MTD Icon (▲ / ▼)
-
Target vs Actual %
-
PY MTD
-
CY vs PY %
YTD Section:
-
Actual CY YTD
-
Target CY YTD
-
YTD Icon (▲ / ▼)
-
Target vs Actual %
-
PY YTD
-
CY vs PY %
Everything is visible in one structured and interactive view.
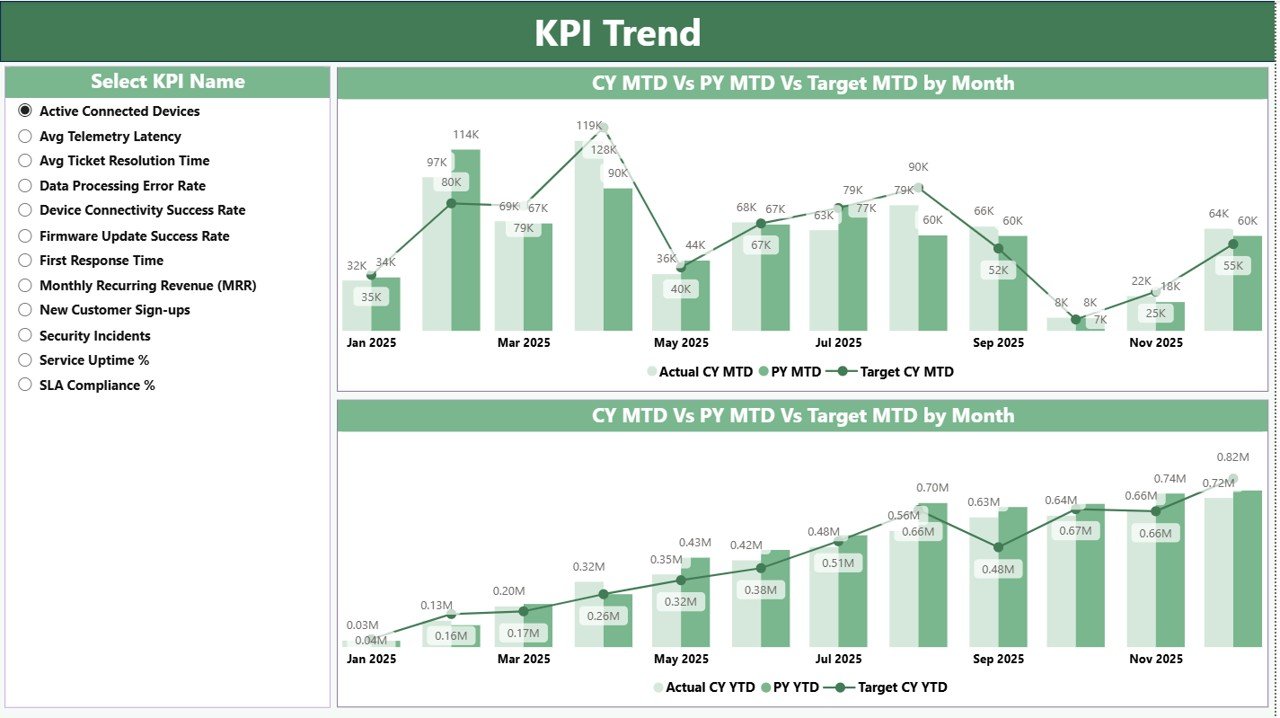
📈 2️⃣ KPI Trend Page – Deep Performance Analysis
Select any KPI using the slicer and analyze:
-
MTD Trend Combo Chart
(Current Year Actual vs Previous Year vs Target) -
YTD Trend Combo Chart
(Current Year Actual vs Previous Year vs Target)
Because trends appear visually, you can detect SLA decline, uptime improvement, or revenue growth patterns immediately.
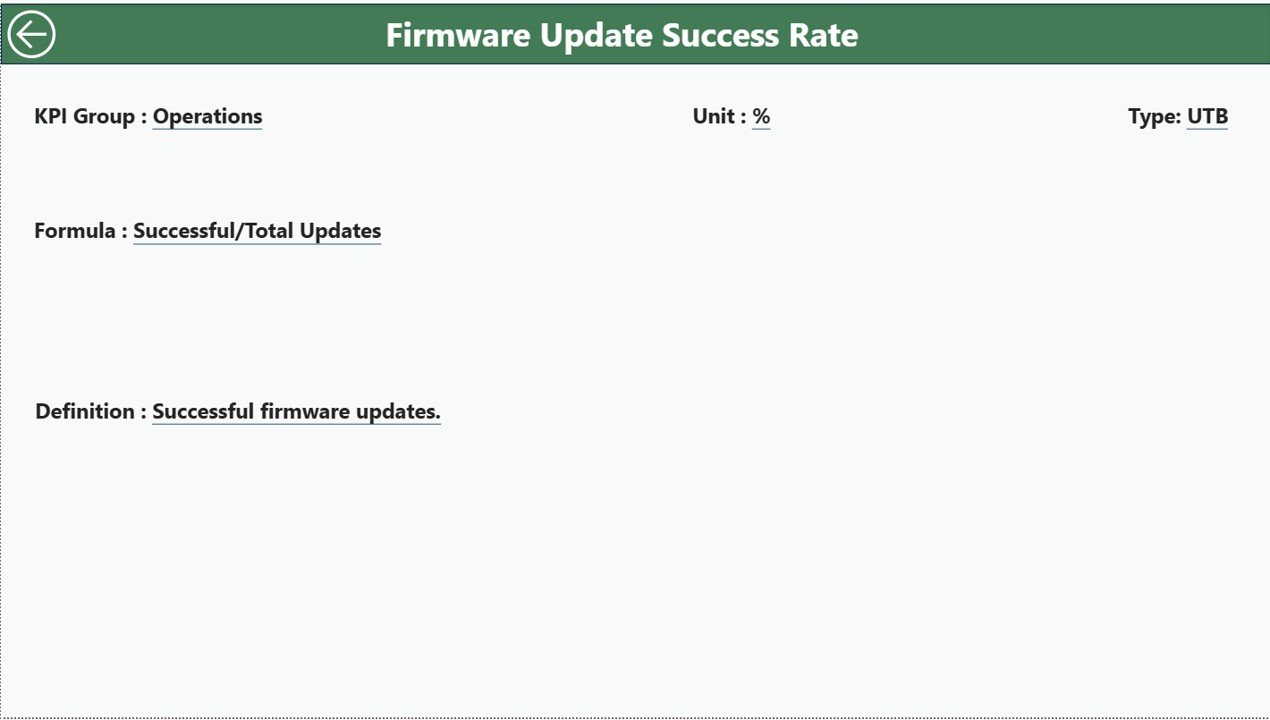
📘 3️⃣ KPI Definition Page – Drill-Through Transparency
Drill through from Summary Page to view:
-
KPI Formula
-
KPI Definition
-
KPI Group
-
KPI Type (LTB / UTB)
-
Unit
This ensures governance, clarity, and alignment across teams.
📊 Excel Data Structure Behind the Dashboard
The Power BI dashboard connects to an Excel file with 3 sheets:
1️⃣ Input_Actual
Enter KPI Name, Month (first date of month), MTD, YTD.
2️⃣ Input_Target
Enter KPI Name, Month, MTD Target, YTD Target.
3️⃣ KPI Definition
Define KPI Number, Group, Name, Unit, Formula, Type.
After updating Excel, simply refresh Power BI and all visuals update automatically.
How to Use the IoT Services KPI Dashboard in Power BI ⚙️
Step 1: Define KPIs Clearly
Align operational, financial, and SLA metrics with business strategy.
Step 2: Enter Targets
Define realistic performance goals.
Step 3: Input Actual Data Monthly
Keep Excel sheets updated accurately.
Step 4: Refresh Power BI
Update visuals instantly.
Step 5: Analyze Trends & Variances
Identify underperforming KPIs using icons and charts.
Step 6: Take Corrective Action
Improve SLA compliance, uptime, and cost control proactively.
Within minutes, your IoT reporting shifts from reactive to strategic.
Who Can Benefit from This IoT Services KPI Dashboard in Power BI 👥
This dashboard is ideal for:
✔ IoT Service Providers
✔ Network Operations Managers
✔ Service Delivery Teams
✔ SLA Compliance Officers
✔ Financial Controllers
✔ Business Intelligence Teams
✔ SaaS & Connected Device Companies
Whether you manage hundreds or millions of devices, this dashboard scales effortlessly.
How This Dashboard Improves IoT Business Performance 🚀
It helps you:
🔹 Monitor device uptime %
🔹 Track SLA compliance rate
🔹 Reduce incident resolution time
🔹 Improve revenue visibility
🔹 Control operational costs
🔹 Enhance customer satisfaction
Because performance gaps become visible instantly, leadership decisions become faster and more accurate.
If you want intelligent IoT performance management, this Power BI dashboard becomes your digital command center.
Click here to read the Detailed blog post
Visit our YouTube channel to learn step-by-step video tutorials
👉 Youtube.com/@PKAnExcelExpert