Meanwhile, editorial, marketing, subscription, and advertising teams must stay perfectly aligned.
But here’s the problem…
Most publishing businesses still rely on scattered spreadsheets and manual reports. Numbers are delayed. Performance is unclear. Decision-making becomes reactive instead of strategic.
🚀 It’s time to change that.
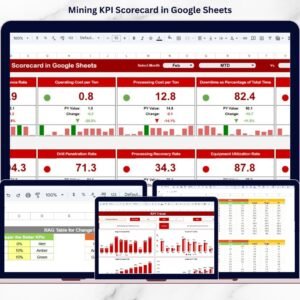
The Publishing KPI Scorecard in Google Sheets is a powerful, ready-to-use performance tracking template designed specifically for publishing companies.
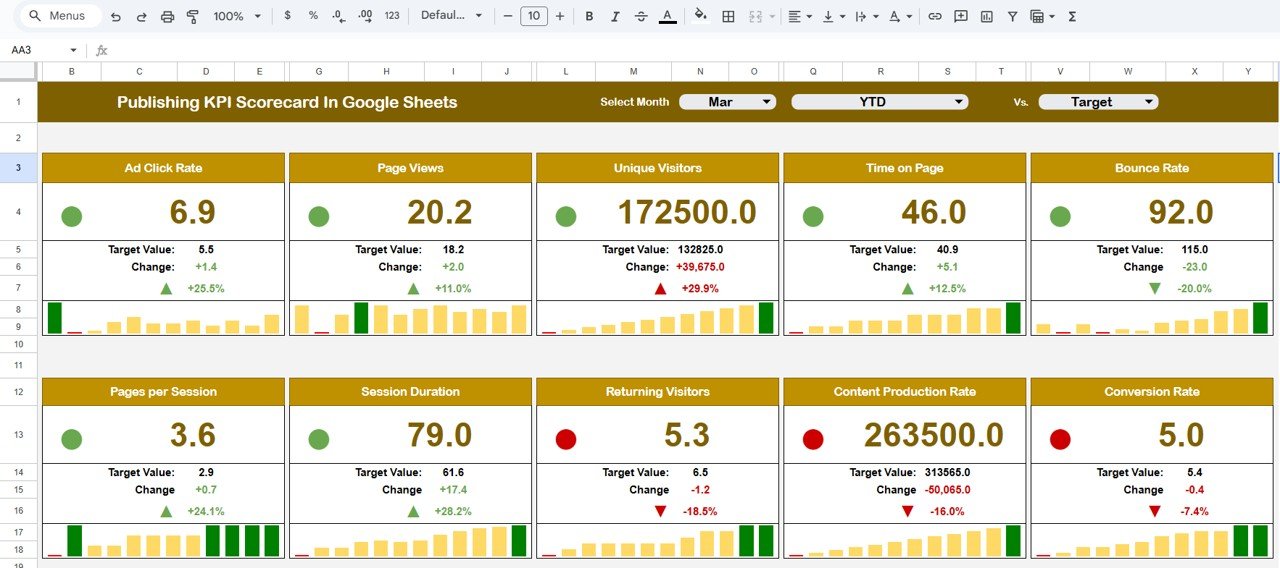
This dynamic scorecard monitors 10 high-impact publishing KPIs in one centralized dashboard. Simply select a month from the drop-down, and the entire scorecard updates automatically — including traffic lights, arrows, MTD, and YTD values.
No complex BI tools.
No expensive software.
Just structured, intelligent performance monitoring.
Because it runs on Google Sheets, your team can collaborate in real time from anywhere.
Key Feature of Publishing KPI Scorecard in Google Sheets
📊 Dynamic Monthly Selector – Choose any month and instantly refresh all KPI values.
🚦 Traffic Light Indicators – Green, Yellow, and Red signals show performance direction at a glance.
📈 MTD & YTD Toggle View – Switch between monthly and yearly analysis instantly.
⬆️⬇️ Percentage Change Arrows – Visual indicators highlight improvement or decline.
📂 10 Carefully Selected KPIs – Focus on revenue, subscriptions, circulation, engagement, and operational performance.
☁️ Cloud-Based Access – Collaborate online with editorial, marketing, and sales teams.
🎯 Automated Target Comparison – Instantly compare Actual vs Target and Previous Year performance.
What’s Inside the Publishing KPI Scorecard in Google Sheets
This structured template includes multiple well-organized sheets:
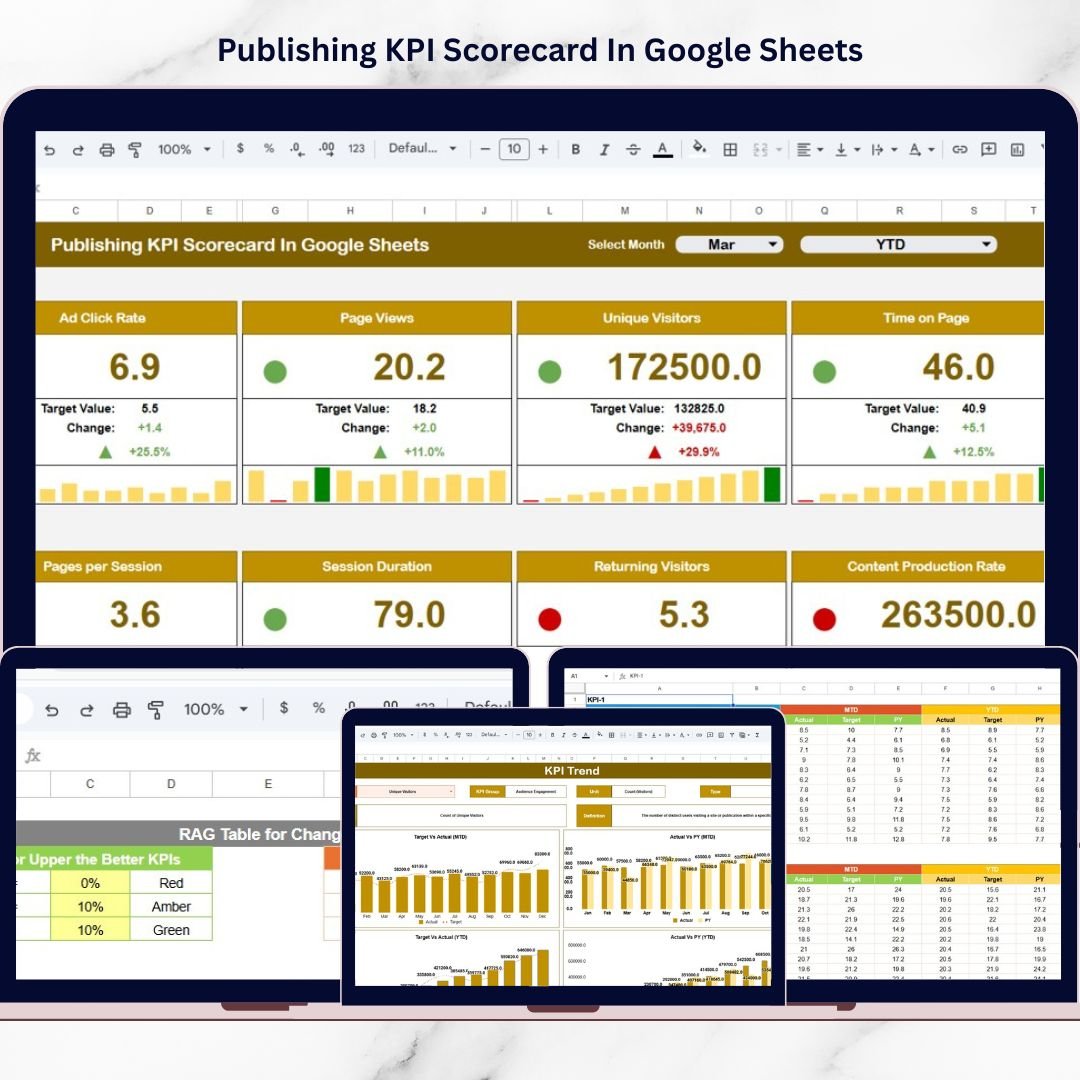
1️⃣ Dashboard Sheet Tab
The main scorecard page. Select a month from the drop-down at the top and view:
-
MTD Actual
-
Target
-
Previous Year
-
Target vs Actual
-
Previous Year vs Actual
-
Percentage changes
-
Traffic light signals
-
Up/down arrows
Everything updates automatically.
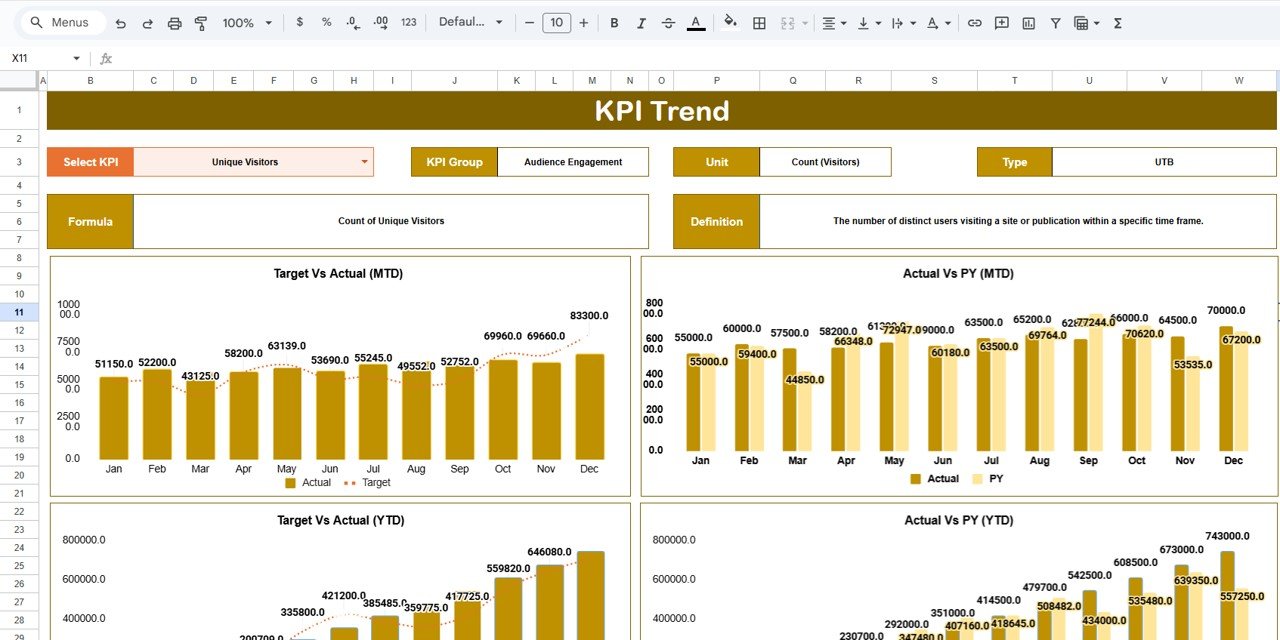
2️⃣ Trend Sheet Tab
Select any KPI in Cell C3 to view detailed trend charts for monthly and yearly performance. Also displays KPI Group, Unit, Type (Lower the Better or Upper the Better), Formula, and Definition.
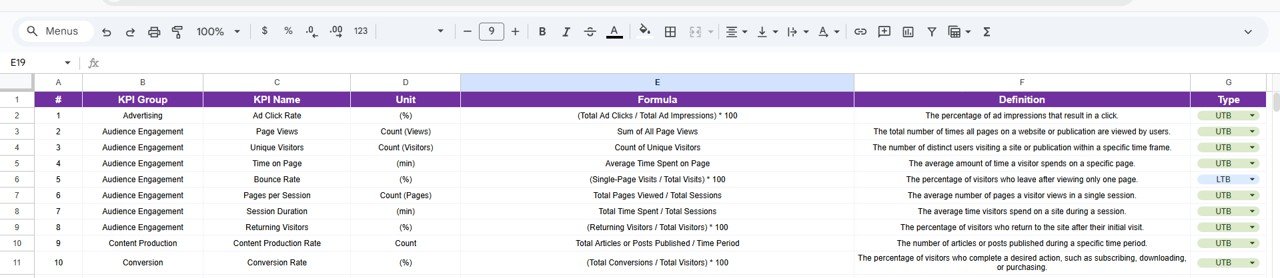
3️⃣ KPI Definition Sheet Tab
Standardize your performance metrics. Enter KPI Name, Group, Unit, Formula, and Definition to ensure alignment across teams.
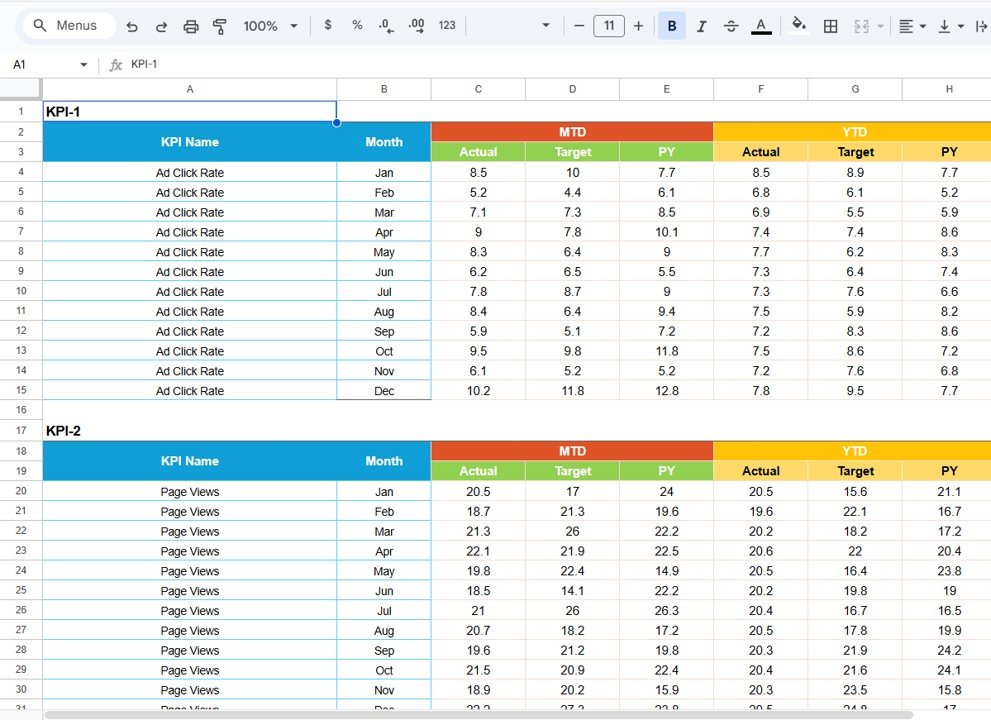
4️⃣ Data Input Sheet Tab
Input MTD values, YTD cumulative data, targets, and previous year numbers. The dashboard refreshes instantly.
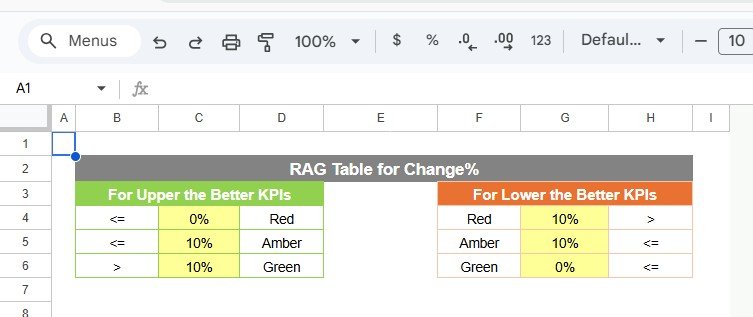
5️⃣ Colour Settings Sheet
Define traffic light thresholds, percentage limits, and arrow logic for consistent visual performance signals.
This organized structure eliminates confusion and improves accountability.
How to Use the Publishing KPI Scorecard in Google Sheets
Using the scorecard is simple:
1️⃣ Enter monthly data in the Data Input Sheet.
2️⃣ Update target values and previous year numbers.
3️⃣ Adjust traffic light thresholds if needed.
4️⃣ Select the desired month from the Dashboard drop-down.
5️⃣ Toggle between MTD and YTD views.
6️⃣ Analyze visual indicators and trends.
Within minutes, your publishing performance becomes crystal clear.
Who Can Benefit from This Publishing KPI Scorecard in Google Sheets
This scorecard is ideal for:
📚 Magazine Publishers
📰 Newspaper Companies
📲 Digital Media Platforms
📊 Publishing Executives
📢 Advertising Managers
📈 Subscription Managers
🏢 Media Startups
Whether you operate print, digital, or hybrid publishing models, this template adapts to your needs.
Why This Scorecard Drives Revenue Growth
When you consistently track:
✔ Advertising revenue
✔ Subscription growth
✔ Circulation performance
✔ Digital engagement
✔ Churn rate
✔ Content production efficiency
You identify revenue gaps faster.
You optimize marketing spend.
You improve content strategy.
And most importantly — you make data-driven decisions.
This scorecard transforms scattered numbers into actionable publishing intelligence.
Instead of guessing, you lead with clarity.
Instead of reacting, you plan strategically.
Click here to read the Detailed blog post
Watch the step-by-step video tutorial: