
Agriculture is no longer driven only by experience and intuition. Today, smart farming depends on data, KPIs, and performance tracking to improve yield, reduce waste, and manage resources efficiently. However, when agriculture data remains scattered across notebooks, apps, or raw spreadsheets, decision-making becomes slow and unclear.
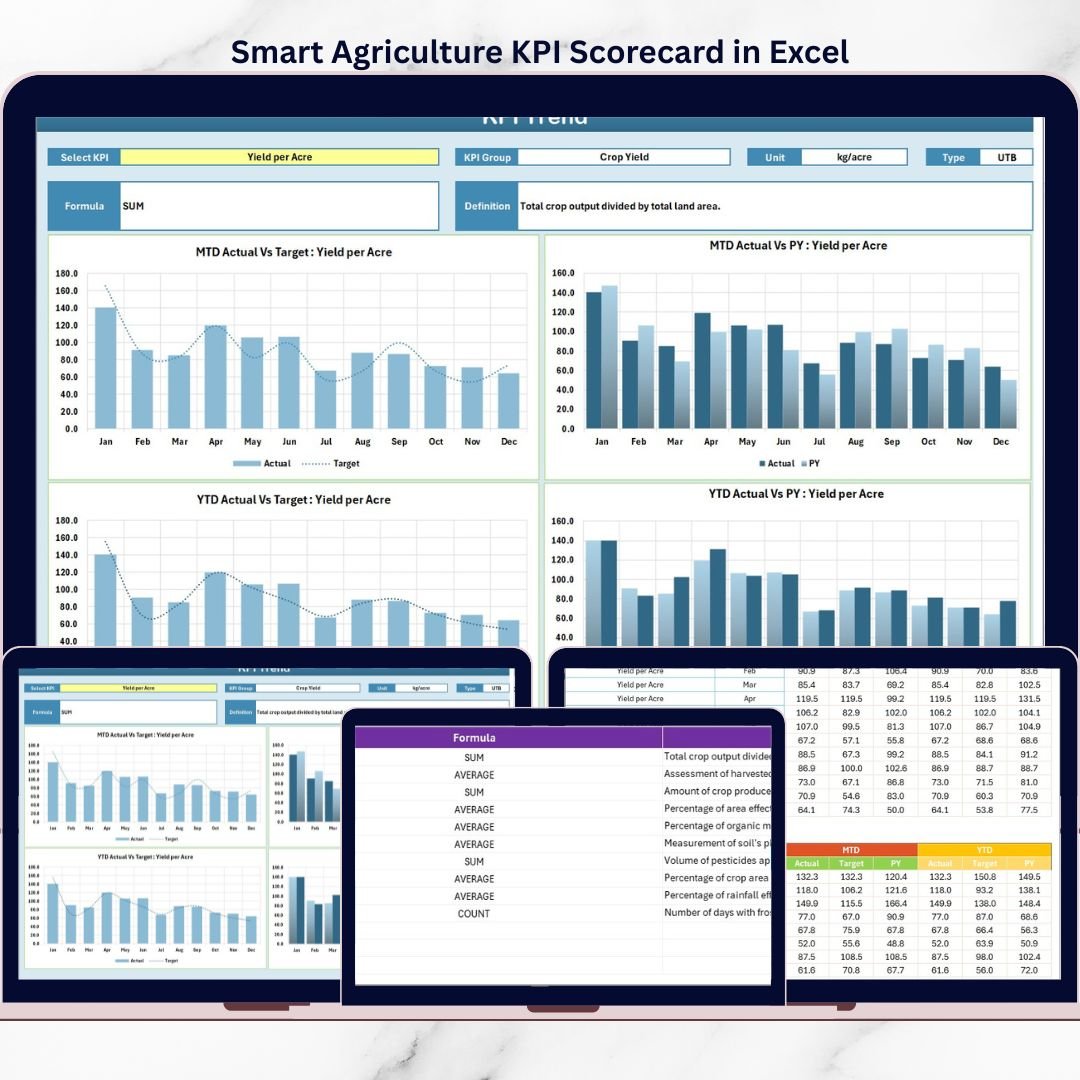
That is exactly why the Smart Agriculture KPI Scorecard in Excel is a game-changing solution for modern farming and agribusiness operations.
This ready-to-use Excel scorecard helps you monitor key agriculture KPIs using MTD and YTD views, compare actual vs target performance, and analyze trends—all in one professional and easy-to-use Excel file.
🔑 Key Features of Smart Agriculture KPI Scorecard in Excel
The Smart Agriculture KPI Scorecard in Excel is designed to deliver clear insights without complexity.
It provides a centralized scorecard view where all agriculture KPIs are displayed together. Users can easily analyze performance using Month, MTD (Month-to-Date), and YTD (Year-to-Date) selections from dropdown menus.
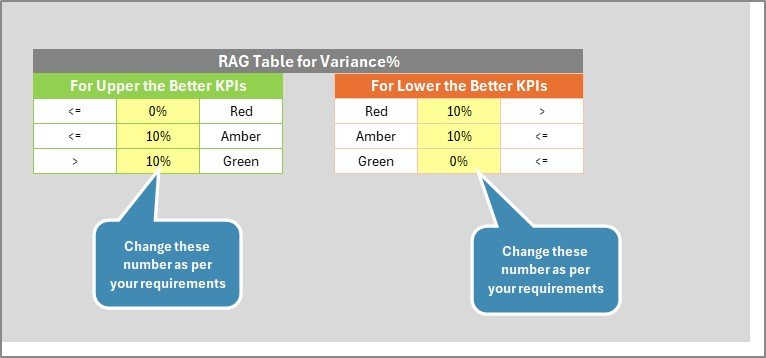
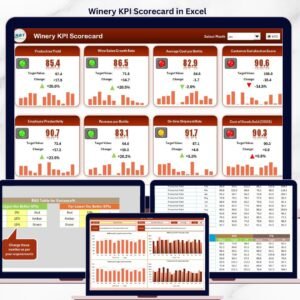
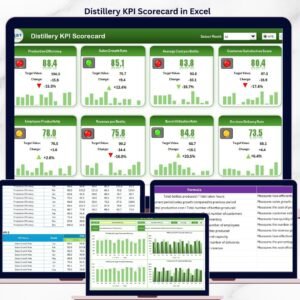
The scorecard highlights Actual vs Target performance using color-coded indicators. Green, amber, and red visuals instantly show whether KPIs are on track or need attention. This allows users to understand performance at a glance—without deep number analysis.
Additionally, the scorecard supports trend analysis, helping users evaluate KPI behavior over time and compare current performance with previous periods.
All of this works seamlessly in Excel, making it accessible and cost-effective.
📦 What’s Inside the Smart Agriculture KPI Scorecard in Excel
This digital product includes four structured worksheets; each created for a specific role in KPI monitoring.

The Scorecard Sheet is the main dashboard. It displays KPI names, KPI groups, MTD and YTD actual values, targets, and performance indicators in a clean and professional layout.
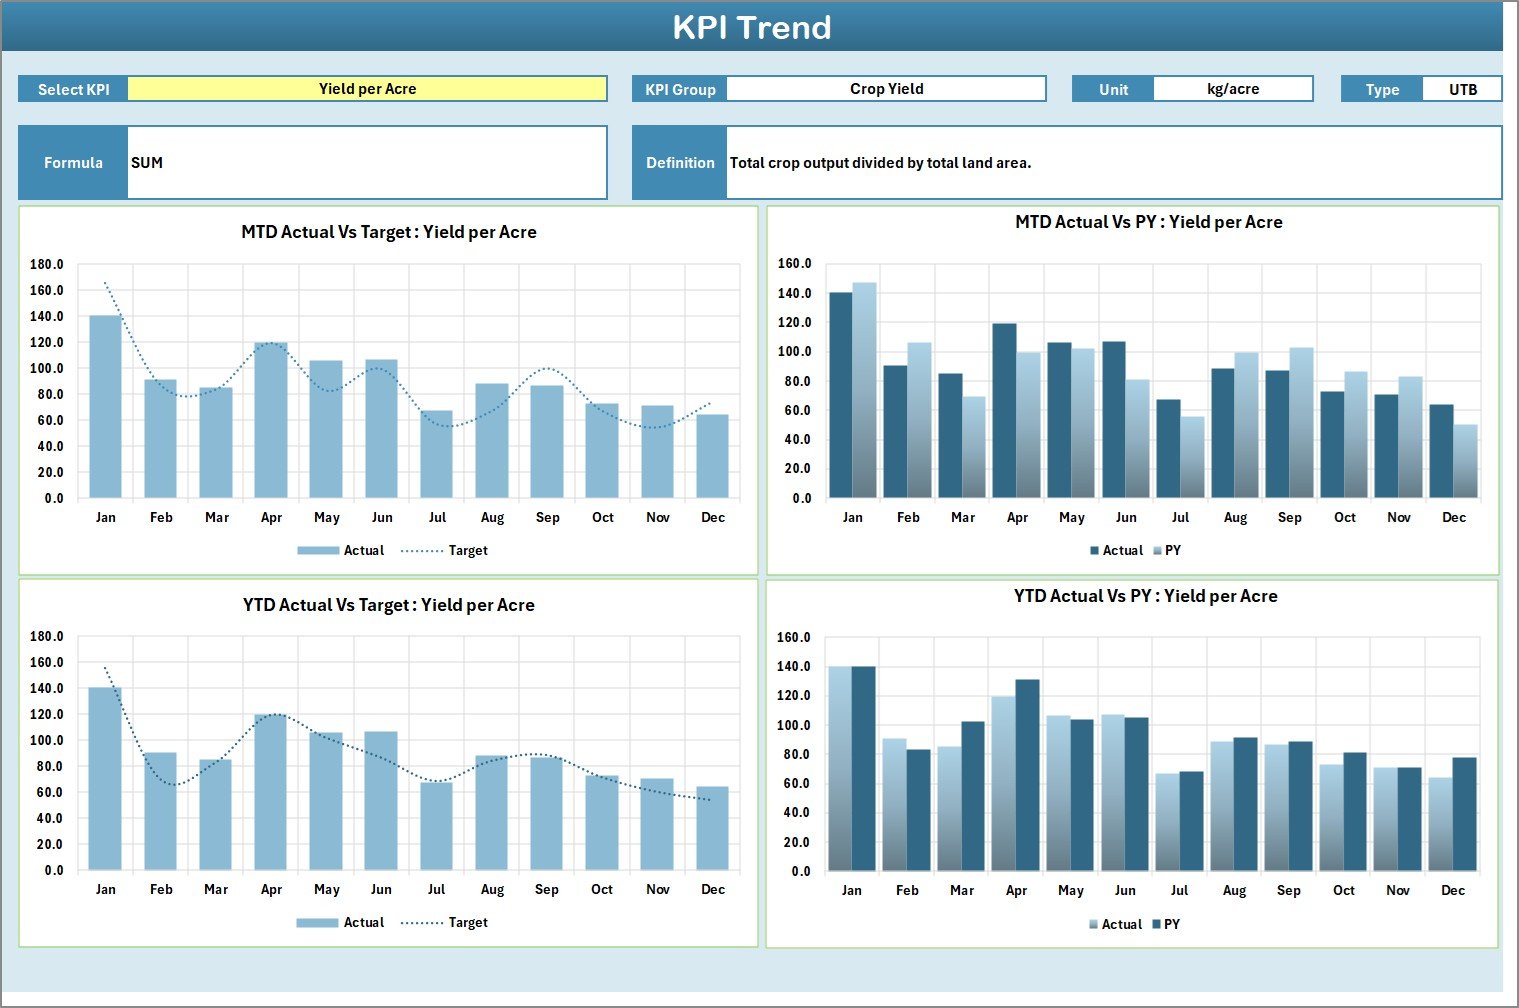
The KPI Trend Sheet allows deeper analysis. Users can select a KPI from a dropdown and instantly view:
-
KPI group
-
KPI unit
-
KPI type (Lower the Better / Upper the Better)
-
KPI formula
-
KPI definition
It also shows MTD and YTD trend charts for actual, target, and previous year values.
The Input Data Sheet acts as the central data entry area. Users can easily enter actual and target values without complex formulas. Once data is updated, the entire scorecard refreshes automatically.
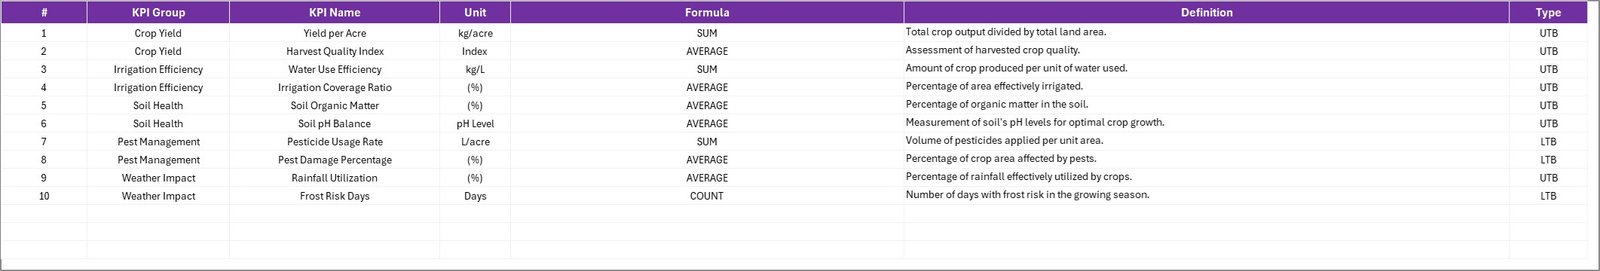
The KPI Definition Sheet standardizes KPI understanding by documenting KPI names, units, formulas, and definitions. This ensures consistency and clarity across teams.
🚀 How to Use the Smart Agriculture KPI Scorecard in Excel
Using this scorecard is simple and user-friendly.
First, define your KPIs clearly in the KPI Definition Sheet. Next, enter actual and target values in the Input Data Sheet.
Then, navigate to the Scorecard Sheet and select the desired month, MTD, or YTD view. The scorecard updates automatically, showing real-time performance insights.
For deeper analysis, go to the KPI Trend Sheet, select a KPI, and review its performance trends. This step-by-step flow makes monitoring and decision-making smooth and efficient.
No advanced Excel skills are required—basic Excel knowledge is enough.
👥 Who Can Benefit from This Smart Agriculture KPI Scorecard in Excel
This scorecard is ideal for a wide range of agriculture professionals.
Farm owners can track productivity and efficiency. Smart farming teams can monitor performance indicators. Agribusiness managers can compare targets and results. Consultants and research institutions can analyze trends. Government agriculture departments can use it for reporting and planning.
If your goal is to make agriculture more data-driven, efficient, and sustainable, this scorecard is built for you.
📌 Why This Excel Scorecard Is a Smart Choice
The Smart Agriculture KPI Scorecard in Excel helps you turn raw data into actionable insights. It improves visibility, supports timely decision-making, and aligns performance with farming goals.
Because it runs in Excel, it eliminates the need for expensive BI tools while still delivering powerful analytics.
📖 Click here to read the Detailed blog post
🎥 Visit our YouTube channel to learn step-by-step video tutorials
👉 https://youtube.com/@PKAnExcelExpert


Reviews
There are no reviews yet.