Market research is the foundation of every successful business strategy. Companies that truly understand customer satisfaction, pricing sensitivity, loyalty, and regional behavior always stay ahead of competitors. However, when survey data sits in raw Excel sheets, analysis becomes slow, confusing, and overwhelming. Valuable insights remain hidden inside rows and columns.
That is exactly why the Market Research Dashboard in Excel becomes an essential decision-making tool 🚀. This ready-to-use Excel dashboard transforms complex survey data into clear visuals, interactive charts, and meaningful KPIs. Instead of spending hours analyzing spreadsheets, decision-makers instantly understand what customers think, how pricing performs, and where improvements are needed.
Designed for marketers, analysts, product teams, and business leaders, this dashboard helps organizations convert survey responses into actionable insights and make faster, more confident decisions.
🔑 Key Features of Market Research Dashboard in Excel
📊 5 Dedicated Analytical Pages for complete market insights
🧭 Left-Side Page Navigator for smooth and fast navigation
🎯 Right-Side Interactive Slicers for dynamic filtering
📈 Customer Satisfaction & Loyalty Tracking using visual charts
💰 Price Sensitivity & Survey Cost Analysis for smarter pricing decisions
⏱️ Response Time Monitoring to evaluate survey effectiveness
🧩 100% Excel-Based Solution – no macros, no add-ins required
This dashboard delivers clarity, speed, and control for market research analysis.
📂 What’s Inside the Market Research Dashboard
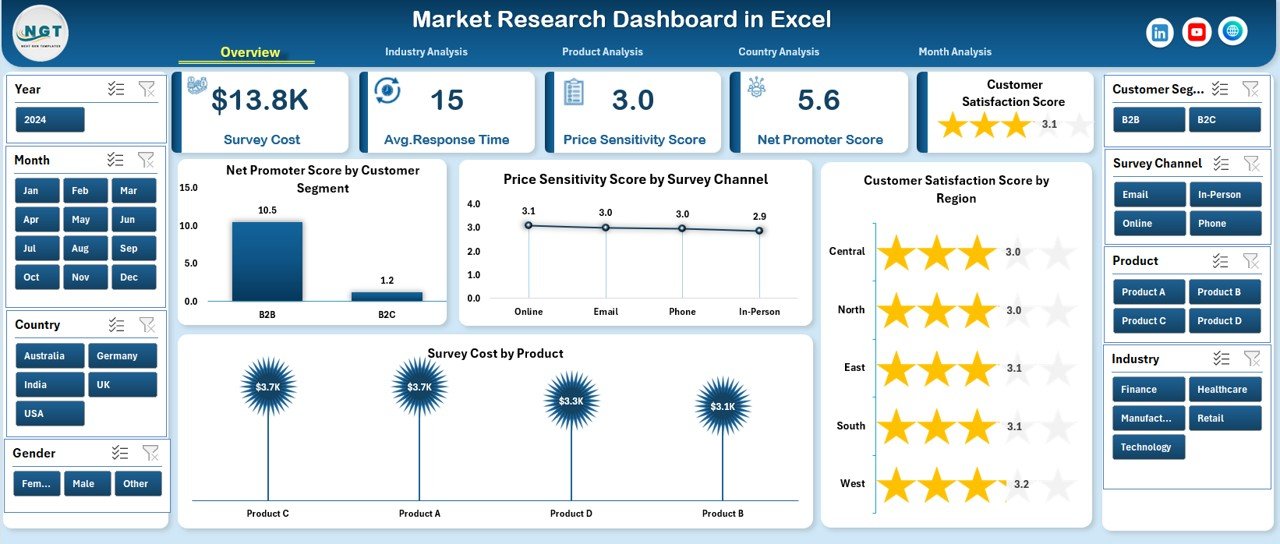
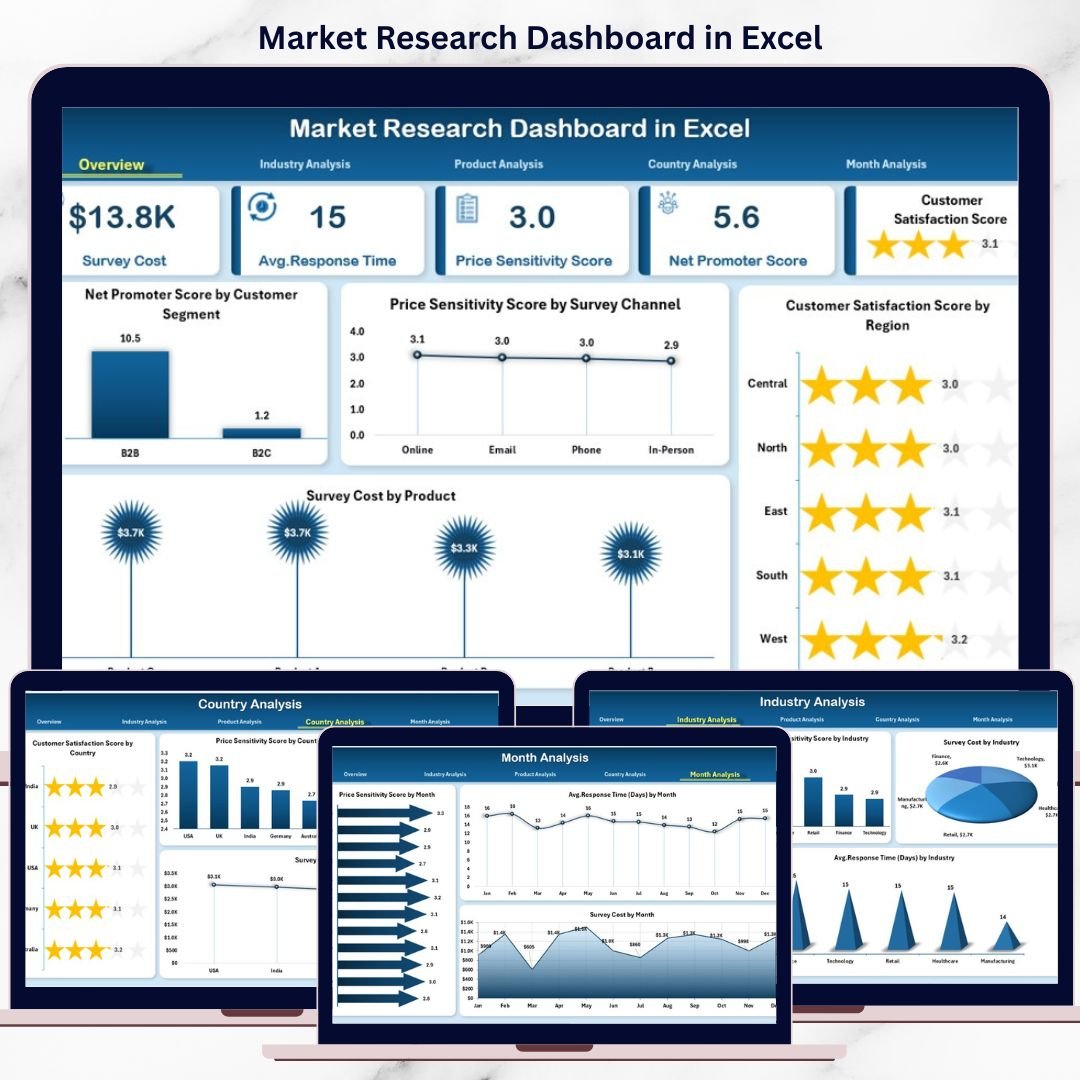
📊 Overview Page
The executive summary of market research performance. It provides a high-level snapshot using:
Net Promoter Score by Customer Segment
Price Sensitivity Score by Survey Channel
Customer Satisfaction Score by Region
Survey Cost by Product
This page helps leadership understand overall customer sentiment instantly.
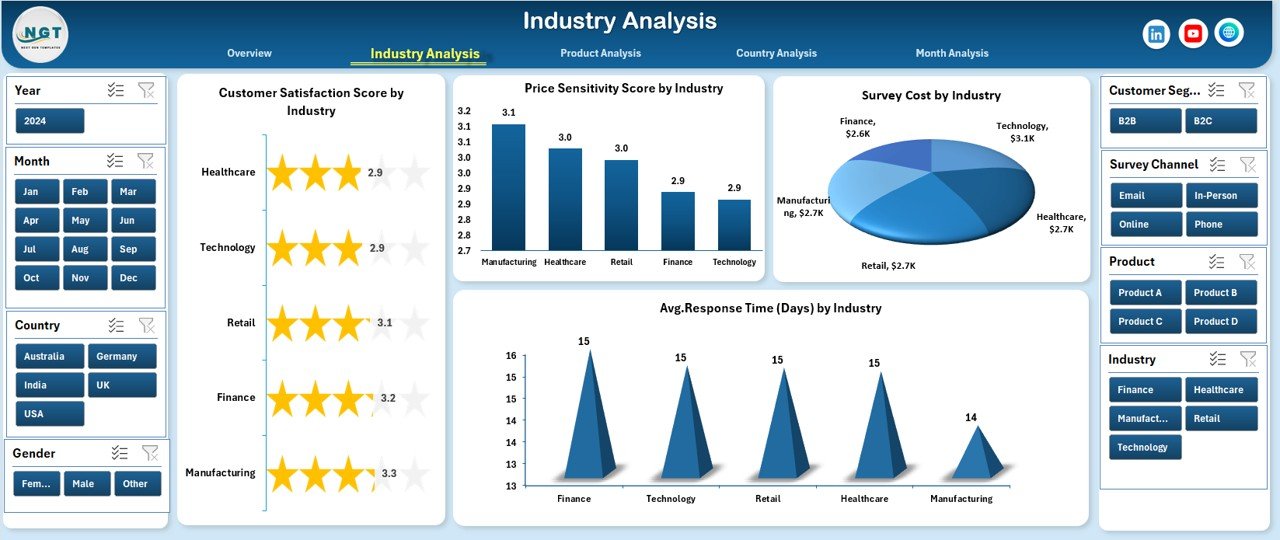
🏭 Industry Analysis Page
Compares research metrics across industries to reveal:
Customer Satisfaction Score by Industry
Price Sensitivity Score by Industry
Survey Cost by Industry
Average Response Time by Industry
This insight helps prioritize industries with low satisfaction or high costs.
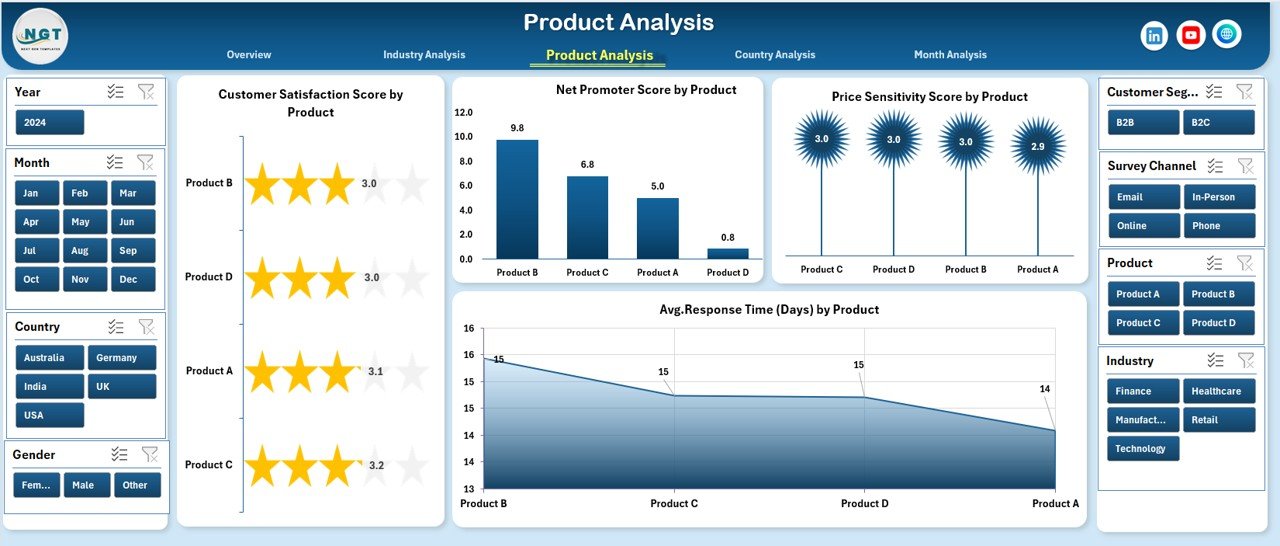
📦 Product Analysis Page
Focuses on product-level perception and performance:
Customer Satisfaction Score by Product
Net Promoter Score by Product
Price Sensitivity Score by Product
Average Response Time by Product
Teams use this page to refine product features and pricing strategies.
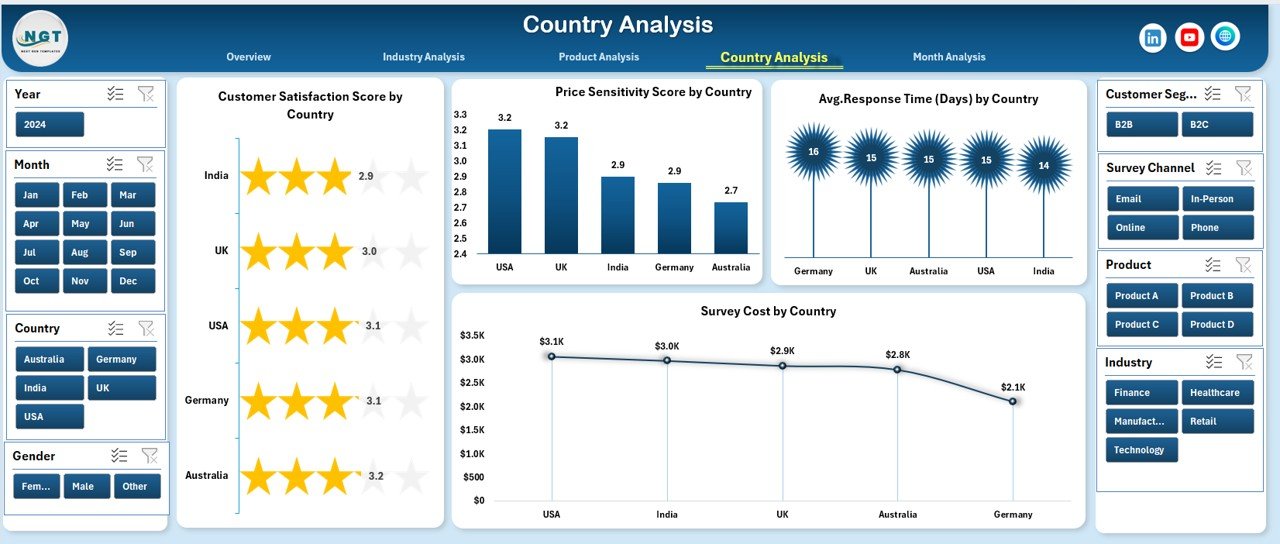
🌍 Country Analysis Page
Analyzes geographical differences in customer behavior:
Customer Satisfaction Score by Country
Price Sensitivity Score by Country
Average Response Time by Country
Survey Cost by Country
This page supports region-specific marketing and pricing decisions.
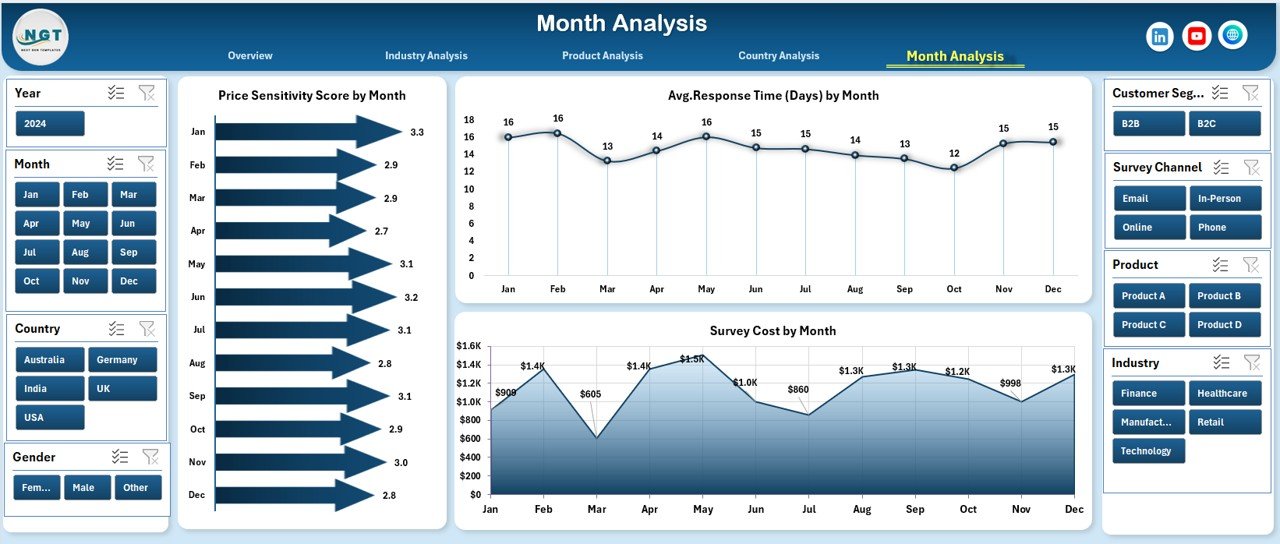
📆 Month Analysis Page
Tracks time-based trends to reveal seasonal patterns:
Price Sensitivity Score by Month
Average Response Time by Month
Survey Cost by Month
As a result, teams plan campaigns and surveys more effectively.
🛠️ How to Use the Market Research Dashboard in Excel
✅ Update survey data in the data sheet
✅ Refresh pivot tables with one click
✅ Use slicers to filter by product, industry, country, or month
✅ Navigate pages using the page navigator
✅ Analyze trends and take action
No advanced Excel skills are required. The dashboard is simple, intuitive, and business-ready.
👥 Who Can Benefit from This Market Research Dashboard?
📊 Market Research Analysts
📢 Marketing Managers
📦 Product Managers
🏢 Business Owners & Founders
🎯 Strategy & Consulting Teams
🤝 Customer Experience Teams
Whether you manage small surveys or large research programs, this dashboard adapts easily.
👉 Click here to read the Detailed blog post
▶️ Visit our YouTube channel to learn step-by-step video tutorials
https://youtube.com/@PKAnExcelExpert