Every organization relies on smooth and efficient workflows to meet deadlines, balance workloads, and achieve business goals. Tasks move across departments, priorities change daily, and responsibilities shift constantly. However, when task information is scattered across emails, tools, or disconnected spreadsheets, managers lose visibility. As a result, bottlenecks increase, overdue work piles up, and team efficiency suffers.
That is exactly why the Workflow Efficiency Monitoring Dashboard in Google Sheets becomes a powerful and practical operational management solution.
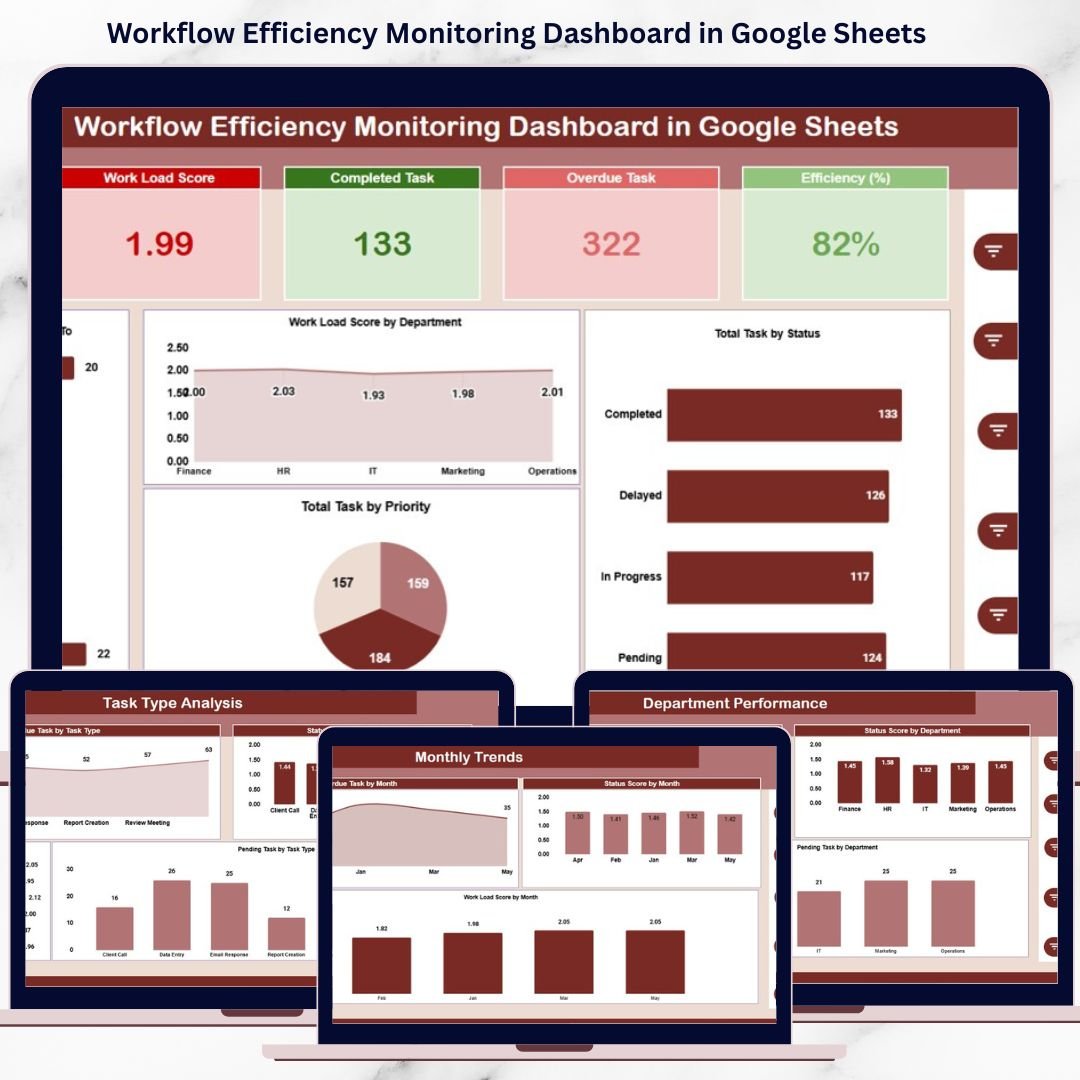
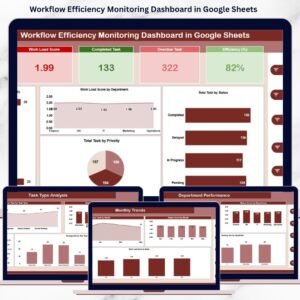
This ready-to-use dashboard provides a centralized, visual, and data-driven way to monitor task progress, workload distribution, overdue tasks, and overall workflow efficiency. Instead of guessing where problems exist, managers gain instant clarity through KPI cards, interactive charts, and a smart search feature—all inside Google Sheets. Because the dashboard is cloud-based, teams collaborate in real time without additional software or complex setup.
Whether you manage projects, operations, or cross-functional teams, this dashboard helps you take control of workflow performance and improve productivity consistently.
✨ Key Features of the Workflow Efficiency Monitoring Dashboard in Google Sheets
📊 1. Executive-Level KPI Cards
Get an instant snapshot of workflow health using key metrics such as Total Tasks, Completed Tasks, Overdue Tasks, Workload Score, and Efficiency %.
📈 2. Visual Performance Charts
Analyze workflow efficiency using department-wise, task-type-wise, priority-wise, and monthly trend charts.
⚡ 3. Real-Time Updates
All KPIs and charts update automatically when task data changes, ensuring accurate reporting at all times.
🔍 4. Smart Search Functionality
Find any task instantly using keyword and field-based filtering.
🤝 5. Google Sheets Collaboration
Multiple users can update, review, and analyze workflows together in real time.
📦 What’s Inside the Workflow Efficiency Monitoring Dashboard
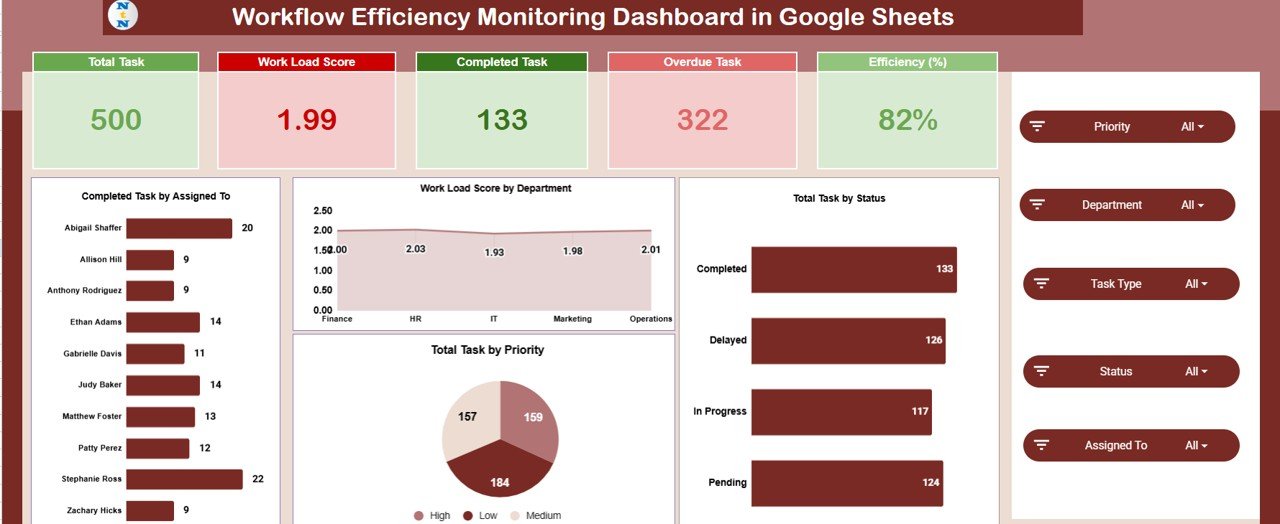
🧭 Overview Sheet Tab (Executive Summary)
This sheet gives leadership a high-level overview of operational performance.
KPI Cards Included:
-
Total Task
-
Work Load Score
-
Completed Task
-
Overdue Task
-
Efficiency (%)
Overview Charts:
-
Completed Task by Assigned To
-
Work Load Score by Department
-
Total Task by Status
-
Total Task by Priority
These visuals help managers quickly assess workload balance, task urgency, and team productivity.
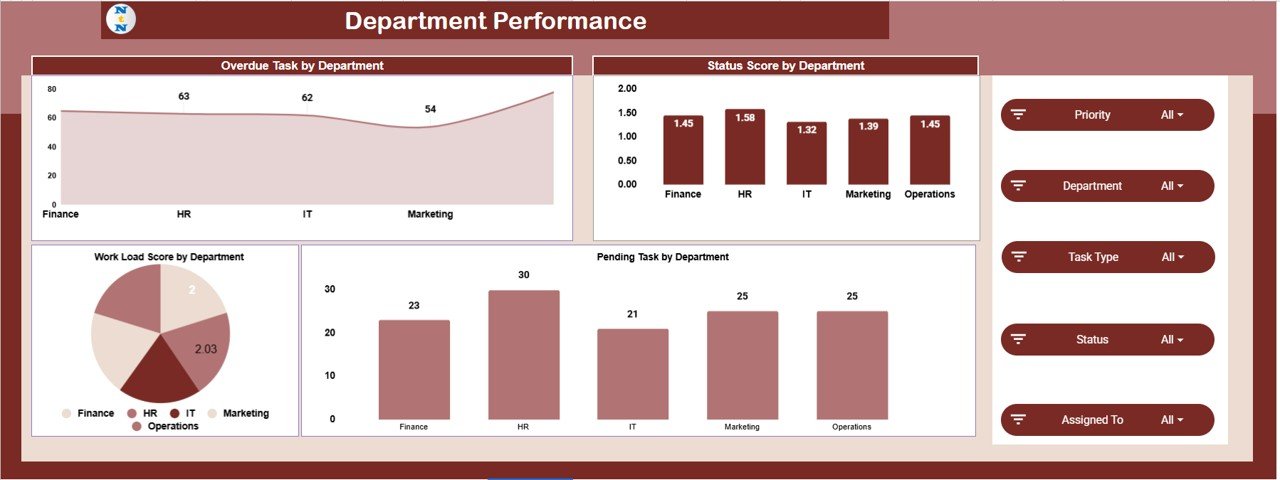
🏢 Department Performance Analysis
This section evaluates workflow efficiency at the department level.
Charts Included:
-
Overdue Task by Department
-
Status Score by Department
-
Pending Task by Department
-
Work Load Score by Department
These insights help leaders identify departments facing delays, excessive workload, or process inefficiencies.
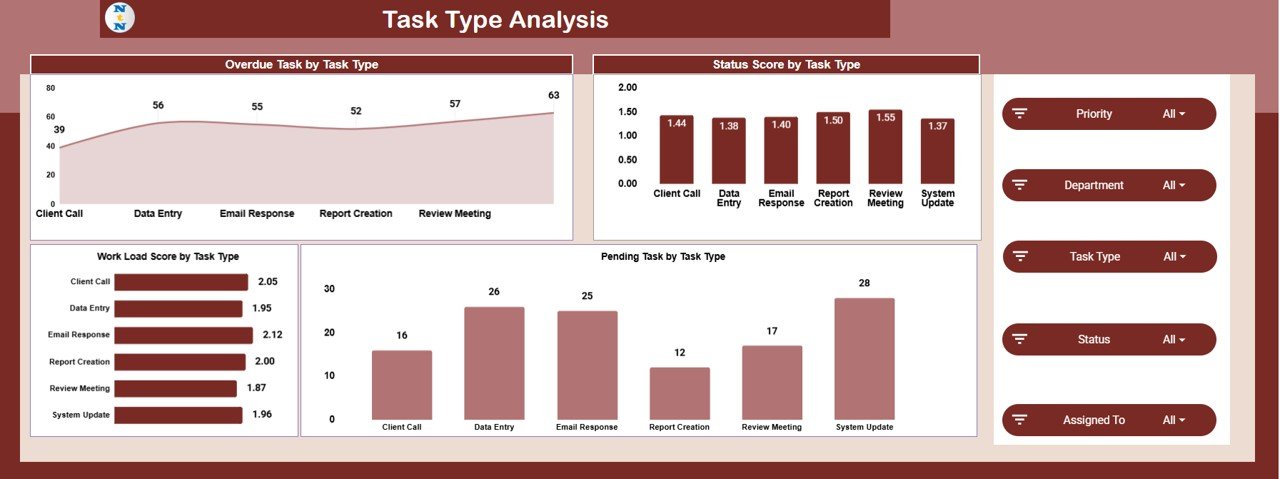
🗂️ Task Type Analysis
Different task types require different effort levels. This section analyzes performance by task category.
Charts Included:
-
Overdue Task by Task Type
-
Status Score by Task Type
-
Pending Task by Task Type
-
Work Load Score by Task Type
This analysis supports smarter workflow design and resource allocation.
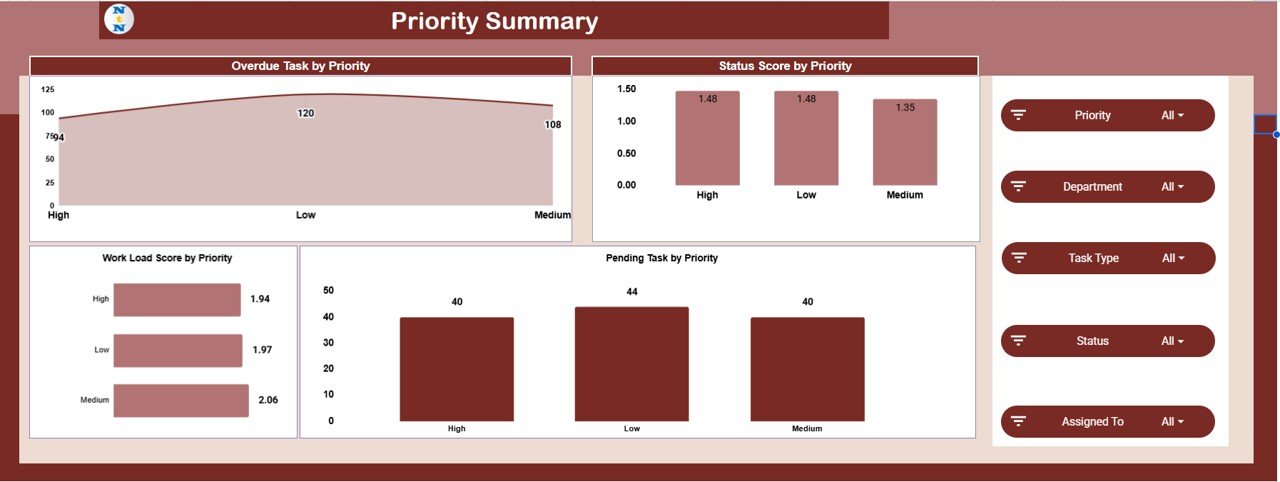
🚦 Priority Summary
This section focuses on how well teams handle task priorities.
Charts Included:
-
Overdue Task by Priority
-
Status Score by Priority
-
Pending Task by Priority
-
Work Load Score by Priority
It ensures high-priority tasks receive proper attention and do not get delayed.
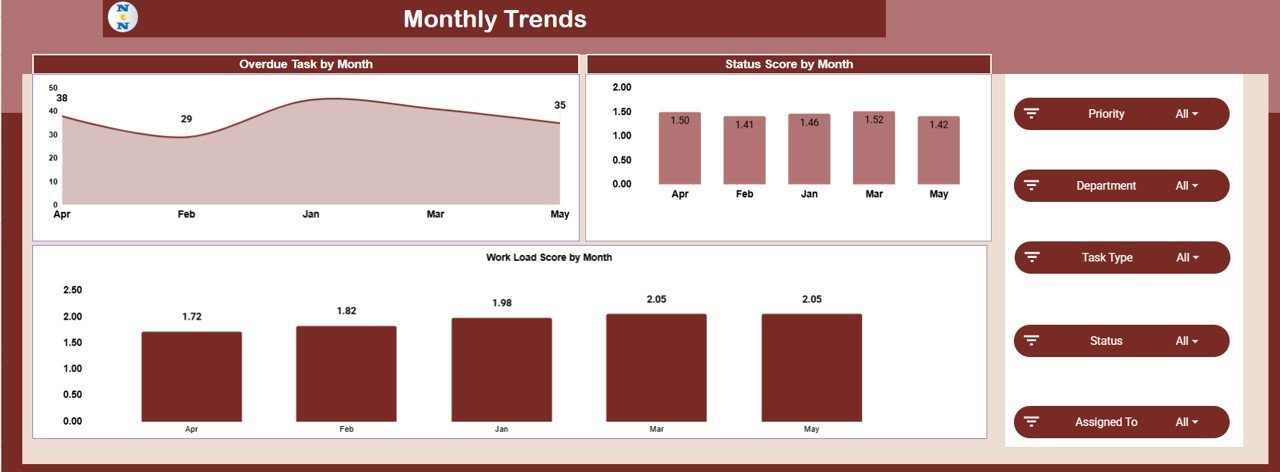
📅 Monthly Trends Analysis
Track workflow performance over time using monthly trends.
Charts Included:
-
Overdue Task by Month
-
Status Score by Month
-
Work Load Score by Month
These trends help measure whether process improvements are delivering results.
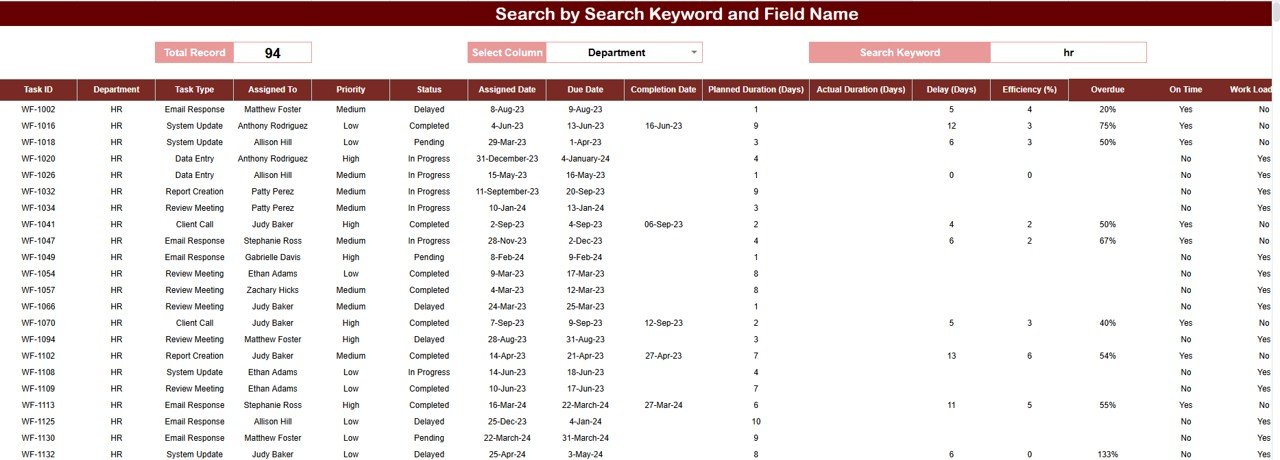
🔍 Smart Search Feature – Find Tasks Instantly
The built-in search feature allows users to filter tasks by:
-
Task Name
-
Assigned To
-
Department
-
Task Type
-
Priority
-
Status
This feature helps teams:
-
Locate specific tasks quickly
-
Respond to management queries faster
-
Track overdue or pending work easily
-
Prepare operational reports in seconds
🎯 Who Can Benefit from This Dashboard
-
📌 Project Managers – Track progress and remove bottlenecks
-
🏢 Operations Teams – Improve workload balance and efficiency
-
👥 Department Heads – Monitor team performance clearly
-
📊 Leadership Teams – Make data-driven decisions
-
🚀 Growing Organizations – Scale workflows without complexity
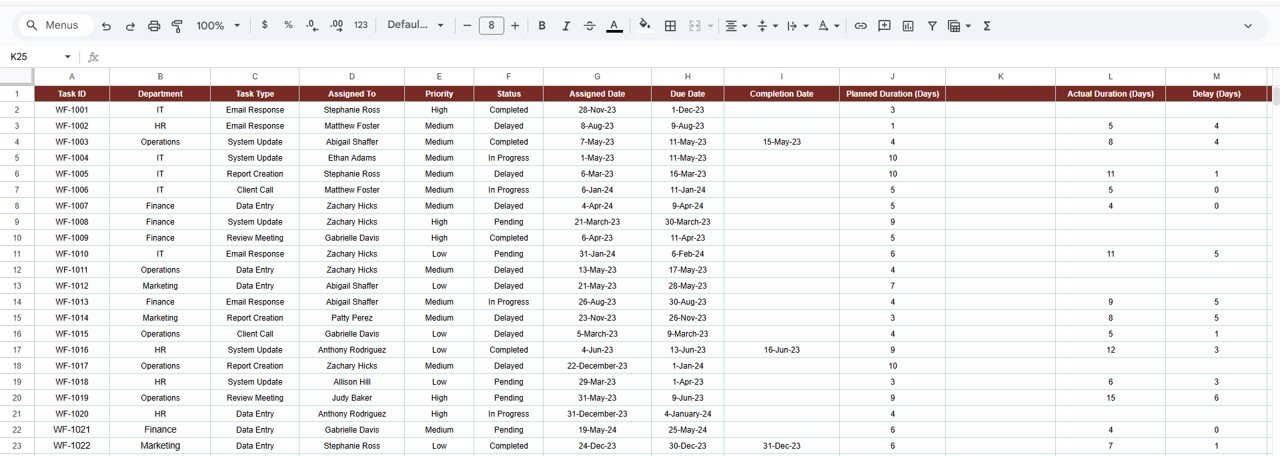
🛠️ How to Use the Workflow Efficiency Monitoring Dashboard
-
Update task data regularly
-
Review overdue tasks daily
-
Balance workloads proactively
-
Monitor priority handling closely
-
Use trends to improve planning and execution
Consistent use leads to better productivity and accountability.
### Click here to read the Detailed blog post
Watch the step-by-step video tutorial:


Reviews
There are no reviews yet.