Public broadcasting organizations operate under constant public scrutiny. Every program decision, budget allocation, and operational outcome must demonstrate value, transparency, and accountability. However, when KPIs are spread across Excel files, emails, and delayed reports, leaders lose visibility and confidence in decision-making.
That is exactly why the Public Broadcasting KPI Dashboard in Power BI becomes a mission-critical performance management solution.
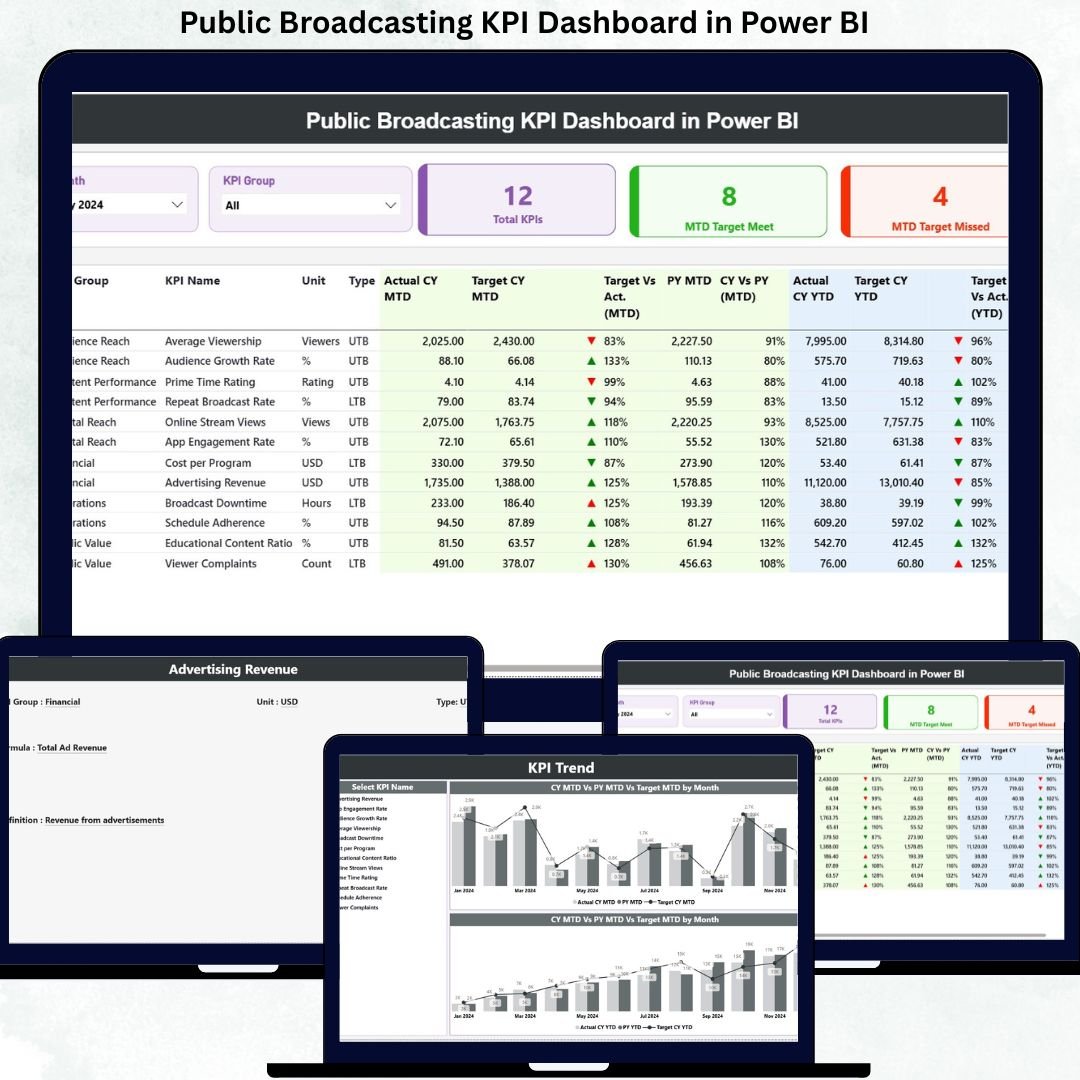
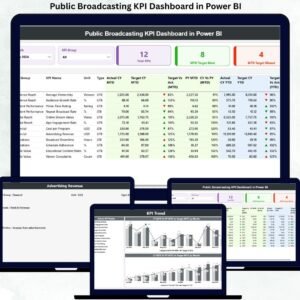
This ready-to-use Power BI dashboard transforms scattered public broadcasting data into a single, interactive, and decision-ready reporting system. Instead of manual summaries and late insights, leadership teams gain real-time visibility into KPI performance, target achievement, trends, and year-over-year comparisons. As a result, organizations move from reactive reporting to proactive governance.
🔑 Key Features of Public Broadcasting KPI Dashboard in Power BI
📊 Centralized KPI Monitoring
Track all public broadcasting KPIs in one structured Power BI dashboard.
🎯 MTD & YTD Performance Tracking
Monitor both short-term results and long-term progress together.
📈 Target vs Actual Comparison
Instantly identify KPIs meeting or missing targets using icons and percentages.
🔄 Year-Over-Year Analysis
Compare current year performance with previous year MTD and YTD values.
🧭 Interactive Month & KPI Group Slicers
Filter insights instantly without rebuilding reports.
📘 Built-In KPI Definition Page
Ensure consistent understanding of KPI formulas, units, and LTB/UTB logic.
⚙️ Excel-Driven Data Input
Update data easily without advanced Power BI or technical skills.
📦 What’s Inside the Public Broadcasting KPI Dashboard in Power BI
This professional dashboard includes three purpose-built analytical pages, designed for clarity and control:
📊 Summary Page
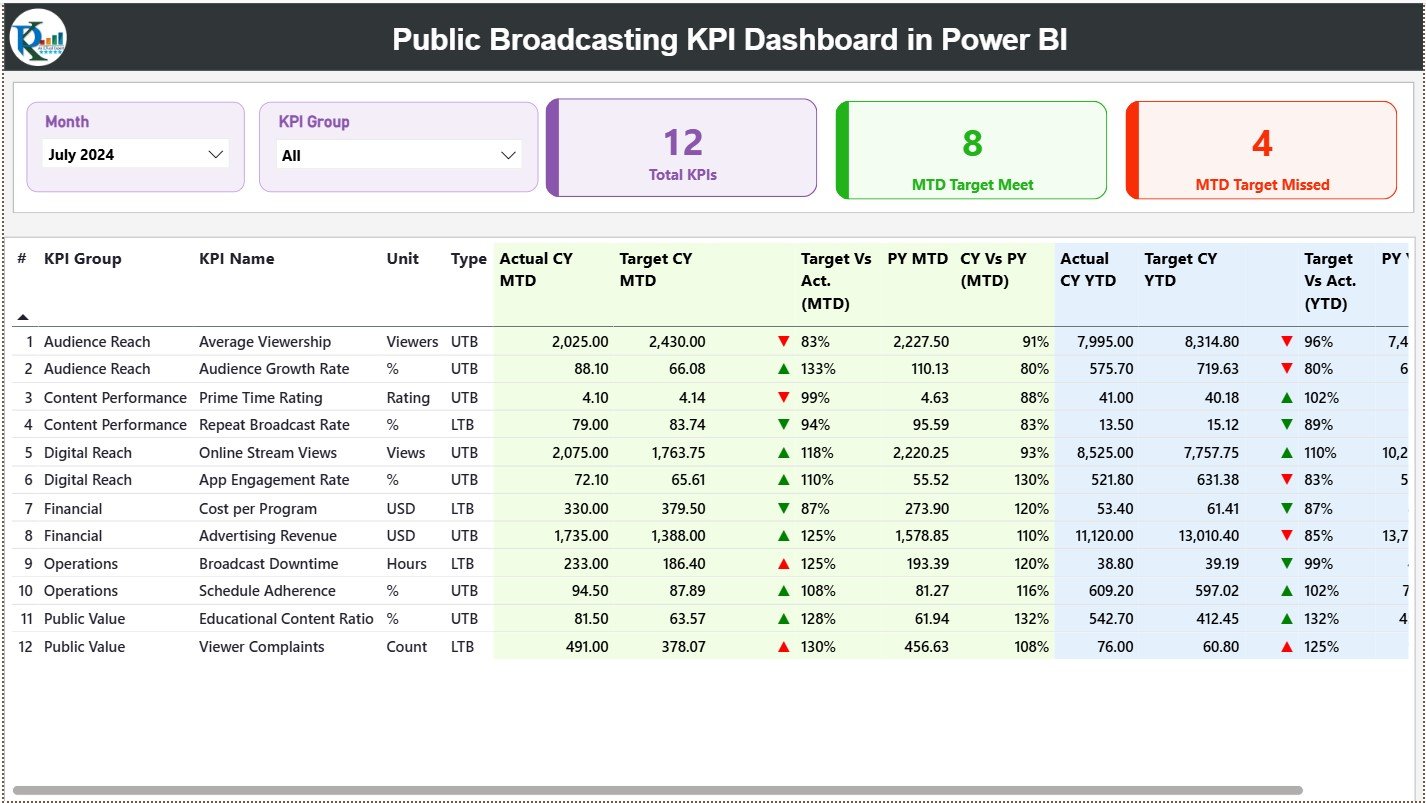
The command center of the dashboard featuring:
-
Month slicer
-
KPI Group slicer
KPI cards displaying:
-
Total KPIs Count
-
MTD Target Met Count
-
MTD Target Missed Count
A detailed KPI performance table showing:
-
KPI Number, Group, Name, Unit, and Type
-
Actual vs Target (MTD & YTD)
-
Previous Year comparisons
-
Visual ▲ / ▼ indicators for instant interpretation
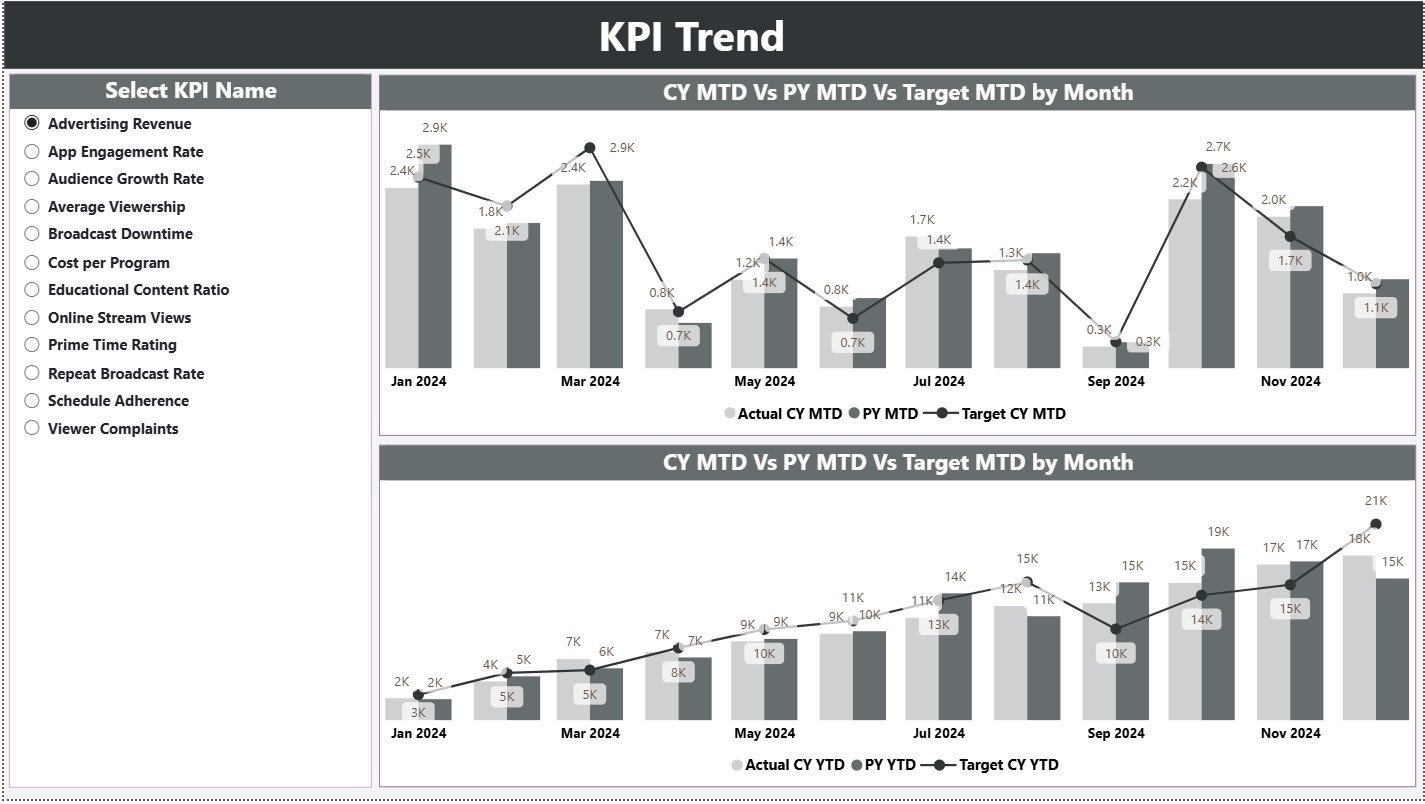
📈 KPI Trend Page
Designed for time-based performance analysis with:
-
KPI Name slicer
-
MTD combo chart (Actual, Target, PY)
-
YTD combo chart (Actual, Target, PY)
This page helps identify trends, seasonality, and emerging performance risks.
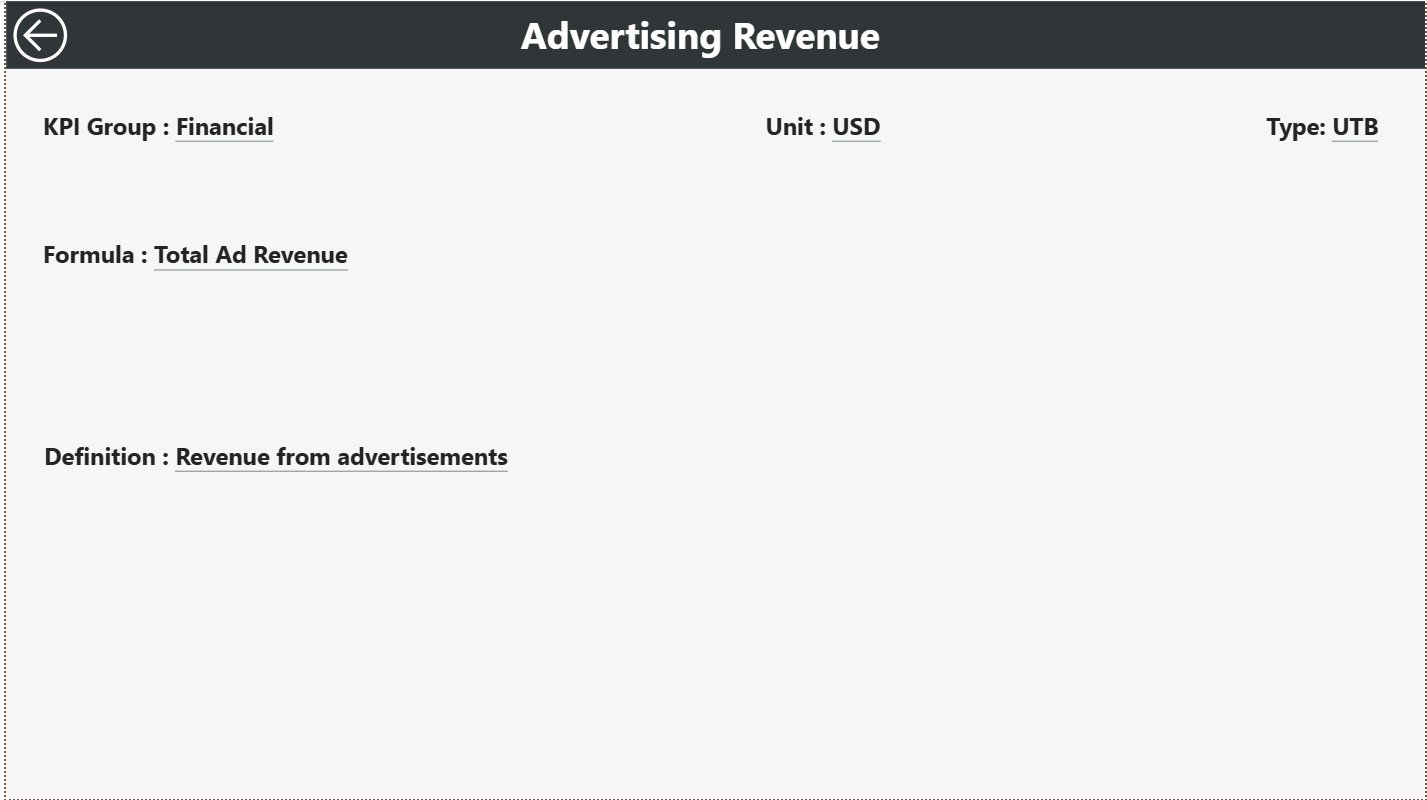
📘 KPI Definition Page
A drill-through reference page displaying:
-
KPI Formula
-
KPI Definition
-
KPI Unit
-
KPI Type (LTB / UTB)
Ensures transparency and eliminates KPI interpretation confusion.
▶️ How to Use the Public Broadcasting KPI Dashboard in Power BI
Using this dashboard is simple and efficient:
1️⃣ Enter actual KPI values in the Input Actual Excel sheet
2️⃣ Enter target values in the Input Target Excel sheet
3️⃣ Maintain KPI structure in the KPI Definition sheet
4️⃣ Refresh the Power BI file
5️⃣ Select Month and KPI Group using slicers
6️⃣ Review KPI status, trends, and comparisons
7️⃣ Take corrective and strategic actions confidently
No advanced Power BI expertise is required.
🎯 Who Can Benefit from This Public Broadcasting KPI Dashboard in Power BI
📺 Public Broadcasting Executives – Gain instant performance visibility
📊 Operations & Compliance Teams – Monitor KPI adherence
💰 Finance & Reporting Teams – Improve accuracy and consistency
🎙️ Content & Programming Leaders – Align strategy with performance
🏛️ Government & Oversight Bodies – Review transparent KPI reporting
The dashboard supports both operational reviews and strategic governance.
👉 Click here to read the Detailed Blog Post
🔔 Visit our YouTube channel to learn step-by-step video tutorials
👉 YouTube.com/@PKAnExcelExpert


Reviews
There are no reviews yet.