
Influencer marketing has become one of the most powerful growth channels for modern brands. Businesses invest heavily in creators across Instagram, YouTube, TikTok, and other platforms. However, many teams still struggle to answer one critical question: Are influencer campaigns actually profitable? When performance is measured only through likes, followers, or impressions, organizations lose visibility into real returns. That is exactly why an Influencer ROI KPI Dashboard in Google Sheets becomes an essential solution.
The Influencer ROI KPI Dashboard in Google Sheets is a ready-to-use performance tracking tool designed to measure influencer campaign success based on cost, engagement, conversions, revenue, and return on investment (ROI). Instead of managing multiple spreadsheets or relying on vanity metrics, this dashboard converts campaign data into clear KPIs, trend analysis, and comparisons—all in one centralized system.
Because the dashboard runs entirely in Google Sheets, it remains cloud-based, collaborative, flexible, and cost-effective. Marketing teams, brand managers, and leadership can access real-time insights without expensive BI tools or technical complexity.
🚀 Key Feature of Influencer ROI KPI Dashboard in Google Sheets
📌 Key Features of the Influencer ROI KPI Dashboard
-
📊 Centralized influencer performance tracking
-
💰 Campaign cost vs revenue visibility
-
📈 ROI, engagement, and conversion KPIs
-
🎯 MTD & YTD performance comparison
-
🔁 Previous year benchmarking
-
📉 Trend analysis for every KPI
-
🔍 Smart KPI-level deep dive
-
⚙️ Fully customizable KPI definitions
-
🤝 Real-time collaboration in Google Sheets
📦 What’s Inside the Influencer ROI KPI Dashboard
The dashboard is built with 6 structured worksheet tabs, each designed for a specific analytical purpose.
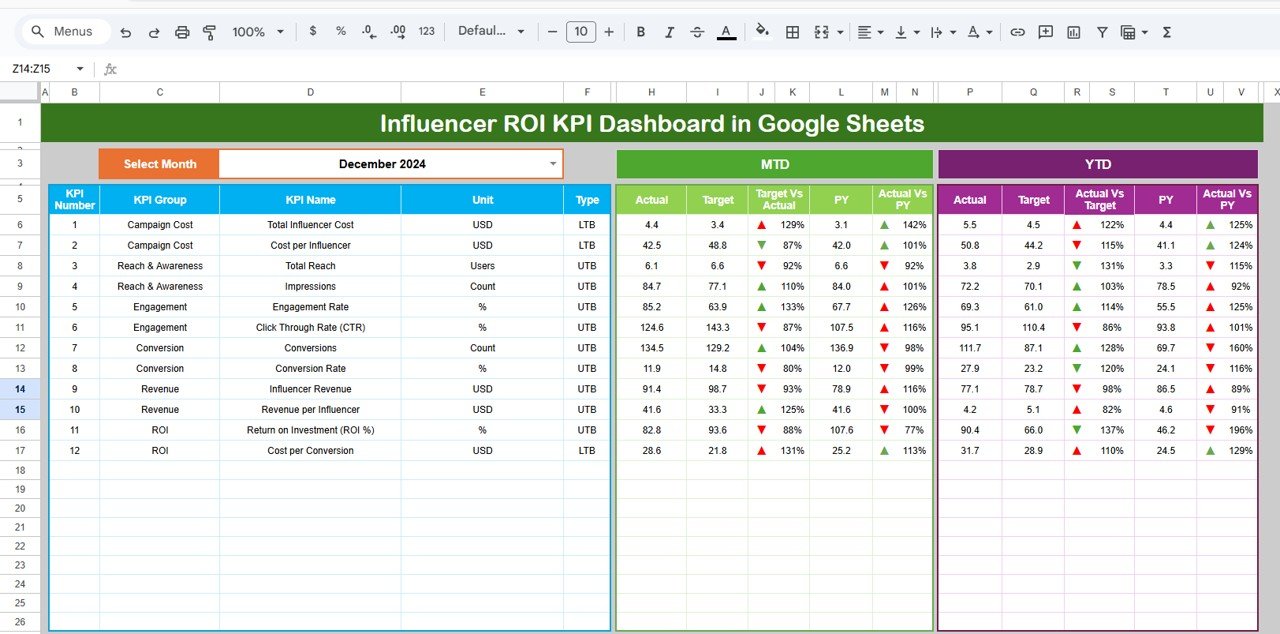
📊 Dashboard Sheet Tab (Main Page)
This is the executive control panel.
-
📅 Month selector in cell D3
-
Instantly updates all KPIs
-
Displays MTD and YTD performance side-by-side
KPIs Displayed
MTD (Month-to-Date)
-
Actual
-
Target
-
Previous Year
-
Target vs Actual
-
Previous Year vs Actual
YTD (Year-to-Date)
-
Actual
-
Target
-
Previous Year
-
Target vs Actual
-
Previous Year vs Actual
🔼 Green arrows indicate improvement
🔽 Red arrows indicate decline
This layout helps leadership review influencer ROI performance within seconds.
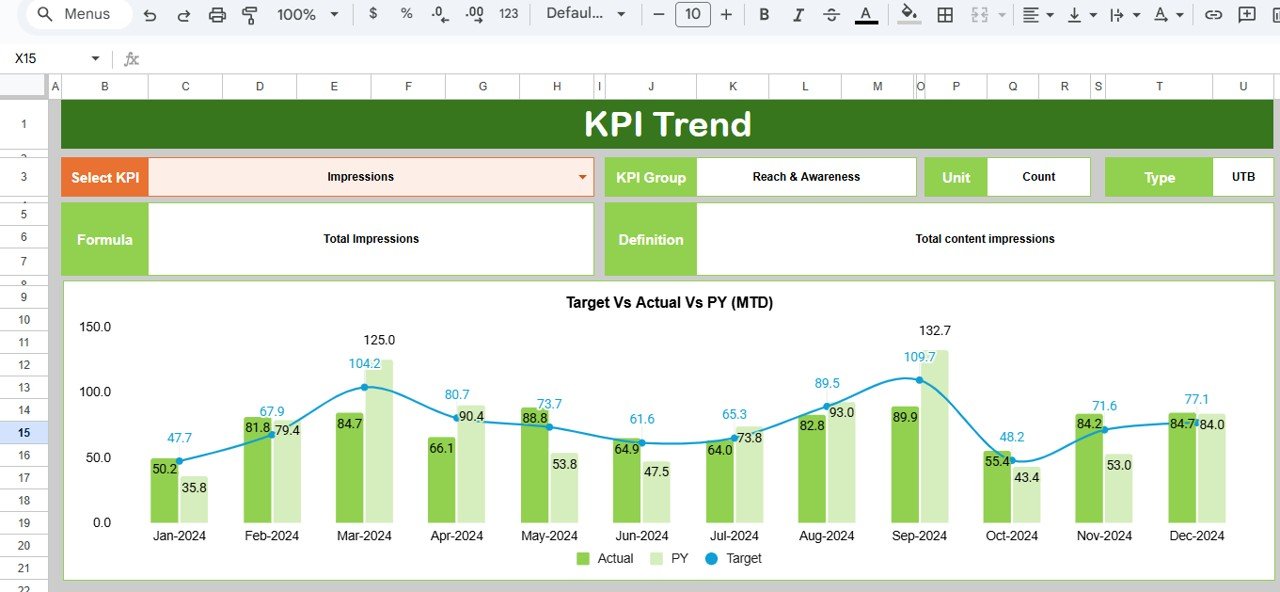
📈 KPI Trend Sheet Tab
This sheet enables deep KPI analysis.
-
Select KPI from dropdown (Cell C3)
-
Automatically displays:
-
KPI Group
-
KPI Unit
-
KPI Type (LTB / UTB)
-
KPI Formula
-
KPI Definition
-
-
Includes monthly trend chart for the selected KPI
This sheet is ideal for identifying growth patterns, optimization opportunities, and declining influencer metrics.
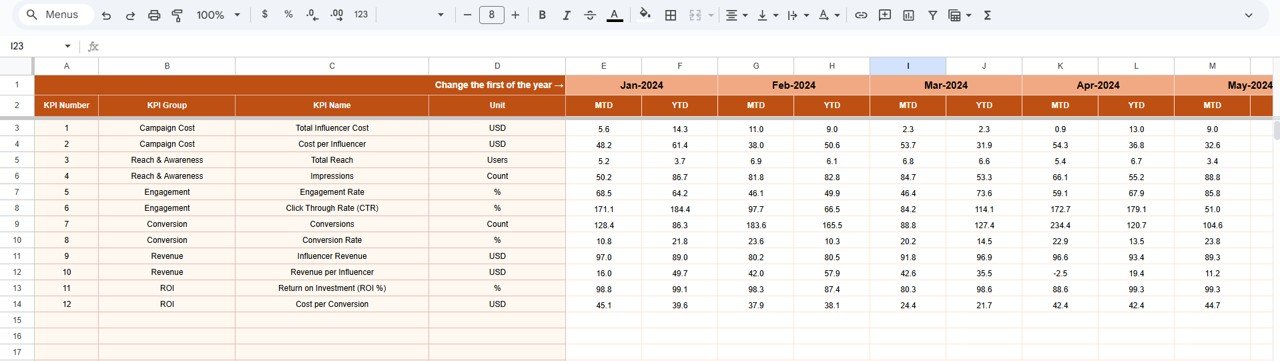
🧾 Actual Number Sheet Tab
This is the data-entry sheet for actual campaign results.
-
Enter MTD and YTD values
-
Select first month of the year in Cell E1
-
Dashboard recalculates automatically
It ensures structured, error-free reporting.
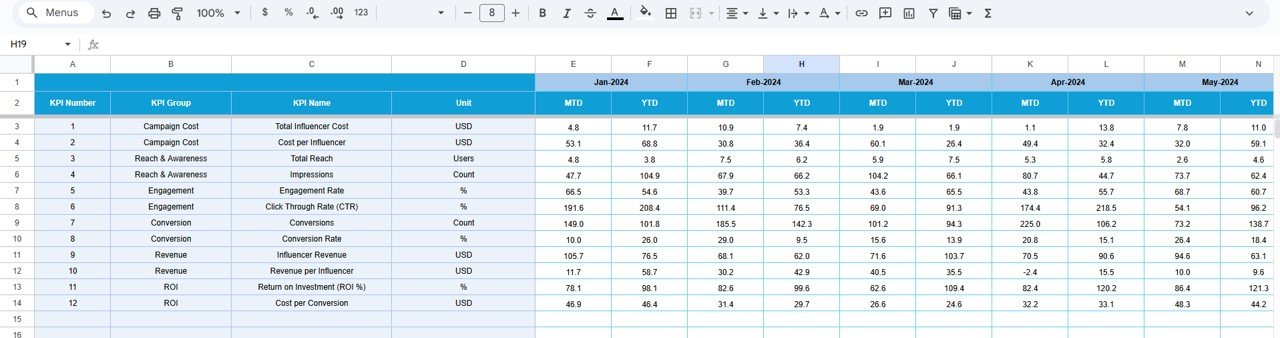
🎯 Target Sheet Tab
This sheet stores planned KPI targets such as:
-
Target ROI
-
Target engagement rate
-
Target conversions
-
Target revenue
Targets allow teams to measure influencer success objectively.
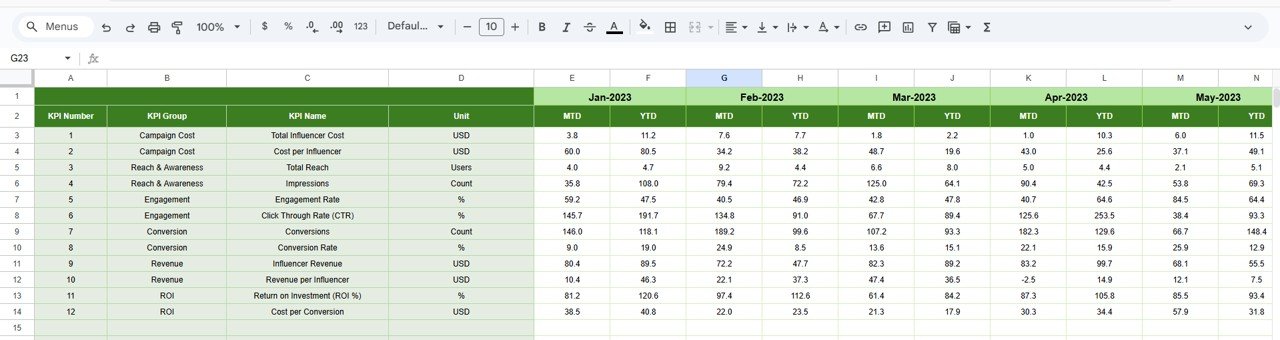
🔁 Previous Year Number Sheet Tab
This sheet stores last year’s KPI values.
-
Enables year-over-year comparison
-
Tracks long-term influencer ROI trends
-
Supports strategic planning
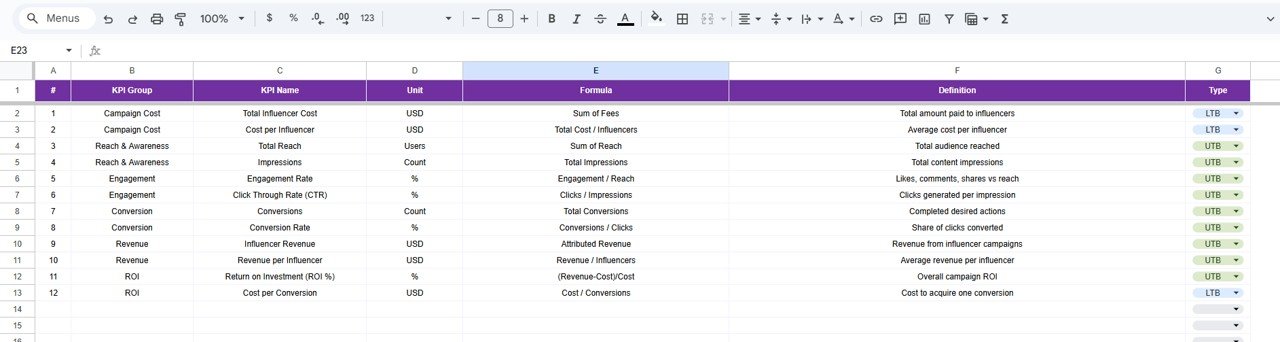
📘 KPI Definition Sheet Tab
This is the backbone of the dashboard.
It includes:
-
KPI Name
-
KPI Group
-
Unit
-
Formula
-
Definition
-
KPI Type (Lower / Upper the Better)
Any change here updates the entire dashboard automatically.
🛠️ How to Use the Influencer ROI KPI Dashboard
1️⃣ Enter campaign actuals
2️⃣ Review MTD & YTD KPIs
3️⃣ Compare targets vs actuals
4️⃣ Analyze KPI trends
5️⃣ Benchmark against previous year
6️⃣ Optimize influencer spend
👥 Who Can Benefit from This Influencer ROI KPI Dashboard
-
📣 Marketing Teams
-
🏷️ Brand Managers
-
📊 Growth & Performance Teams
-
💼 Digital Marketing Agencies
-
🧑💼 Business Owners
### Click here to read the Detailed blog post
Watch the step-by-step video tutorial:


Reviews
There are no reviews yet.