Virtual concerts have completely reshaped the live entertainment industry. Artists, event organizers, and streaming platforms now reach global audiences without venue limitations, while also reducing costs and unlocking new revenue opportunities. Virtual Concerts Dashboard in Excel However, as virtual events scale, managing ticket sales, platform costs, artist fees, audience engagement, and profitability using scattered spreadsheets becomes chaotic.
That is exactly why the Virtual Concerts Dashboard in Excel becomes an essential analytics and decision-making tool.
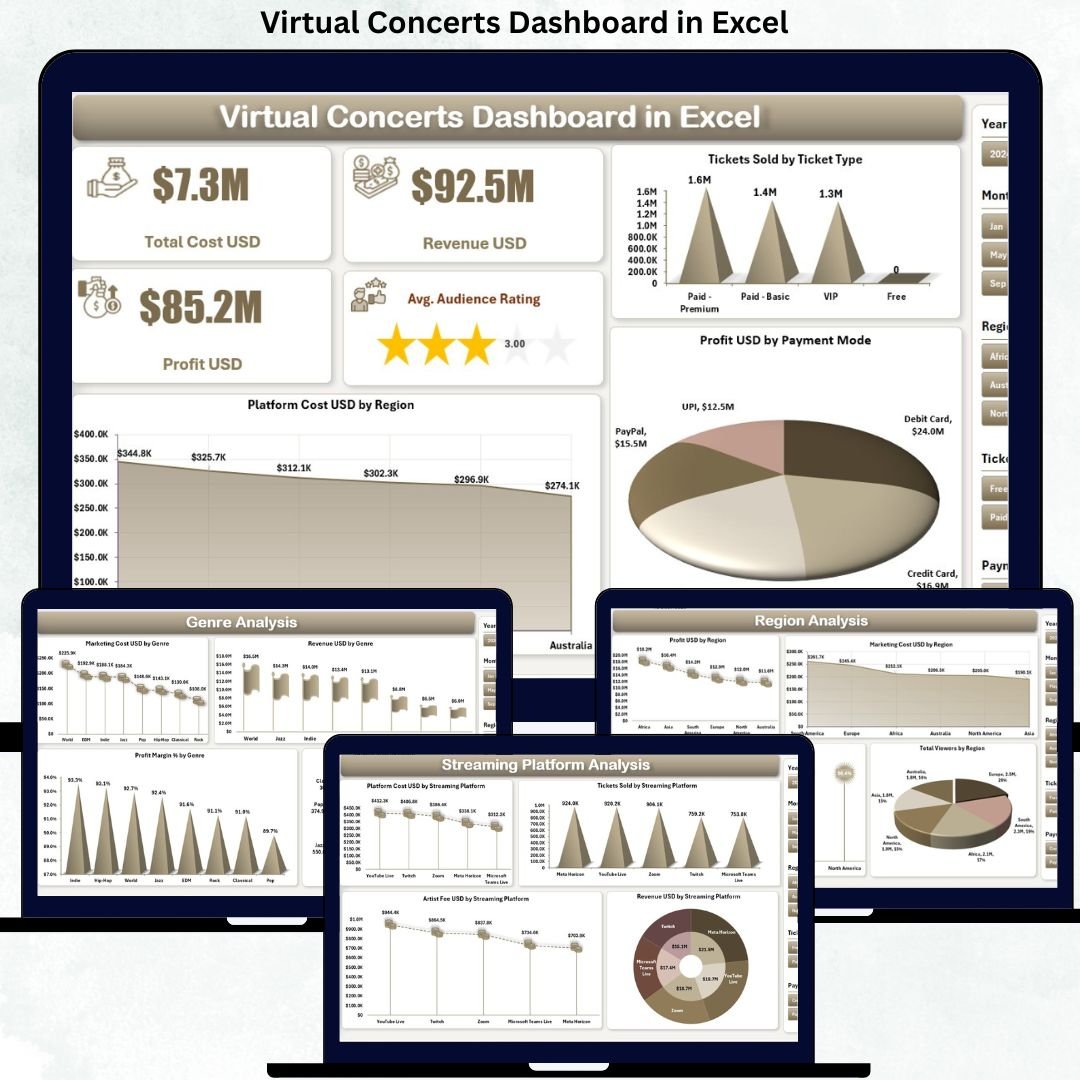
Virtual Concerts Dashboard in Excel This ready-to-use Excel dashboard helps you track financial performance, audience engagement, and operational efficiency for virtual concerts in one centralized view. Instead of switching between multiple files and reports, you gain instant insights into revenue, profit, costs, ratings, and performance trends.
Because the dashboard is built entirely in Excel, it remains flexible, easy to update, and accessible—even for users with basic Excel knowledge. As a result, teams spend less time preparing reports and more time improving event performance.
🚀 Key Features of Virtual Concerts Dashboard in Excel
✅ Centralized Event Performance Tracking – All virtual concert metrics in one dashboard
✅ Revenue, Cost & Profit Analysis – Clear visibility into financial outcomes
✅ Audience Engagement Monitoring – Track ratings and viewer behavior
✅ Genre, Platform & Region Insights – Identify what works best
✅ Monthly Trend Analysis – Monitor growth, seasonality, and sentiment
✅ Interactive Slicers – Filter data instantly without formulas
✅ 5 Analytical Pages – Each page focused on a specific performance angle
✅ 100% Excel-Based – No Power BI or external tools required
📦 What’s Inside the Virtual Concerts Dashboard in Excel
This digital product includes a professionally designed Excel dashboard with 5 interactive analytical pages, supported by structured data and helper sheets.
📊 Dashboard Pages Included
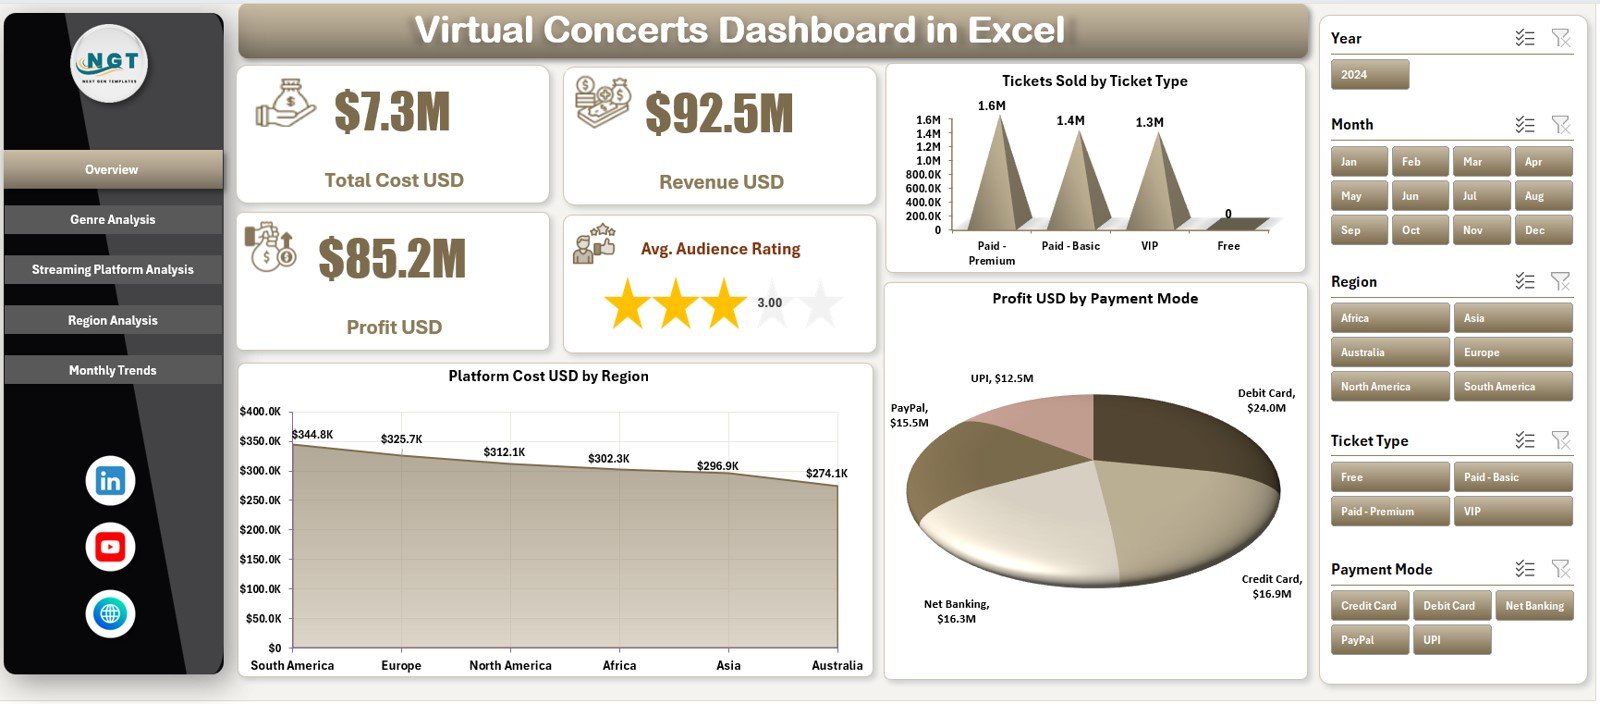
🎯 Overview Page
-
KPI cards showing:
-
Total Cost (USD)
-
Revenue (USD)
-
Profit (USD)
-
Average Audience Rating
-
-
Charts for:
-
Tickets Sold by Ticket Type
-
Platform Cost by Region
-
Profit by Payment Mode
-
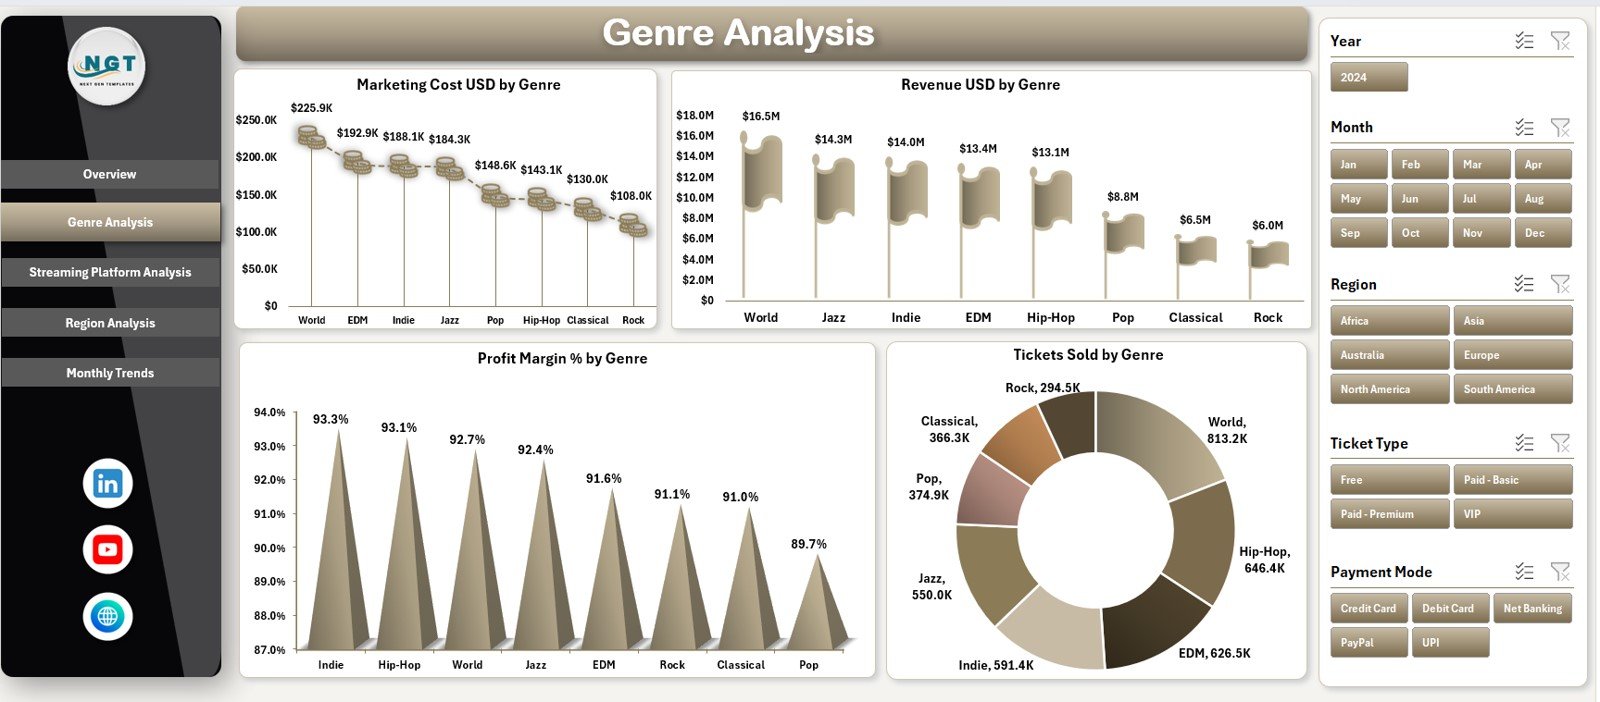
🎶 Genre Analysis Page
-
Marketing Cost by Genre
-
Revenue by Genre
-
Profit Margin (%) by Genre
-
Tickets Sold by Genre
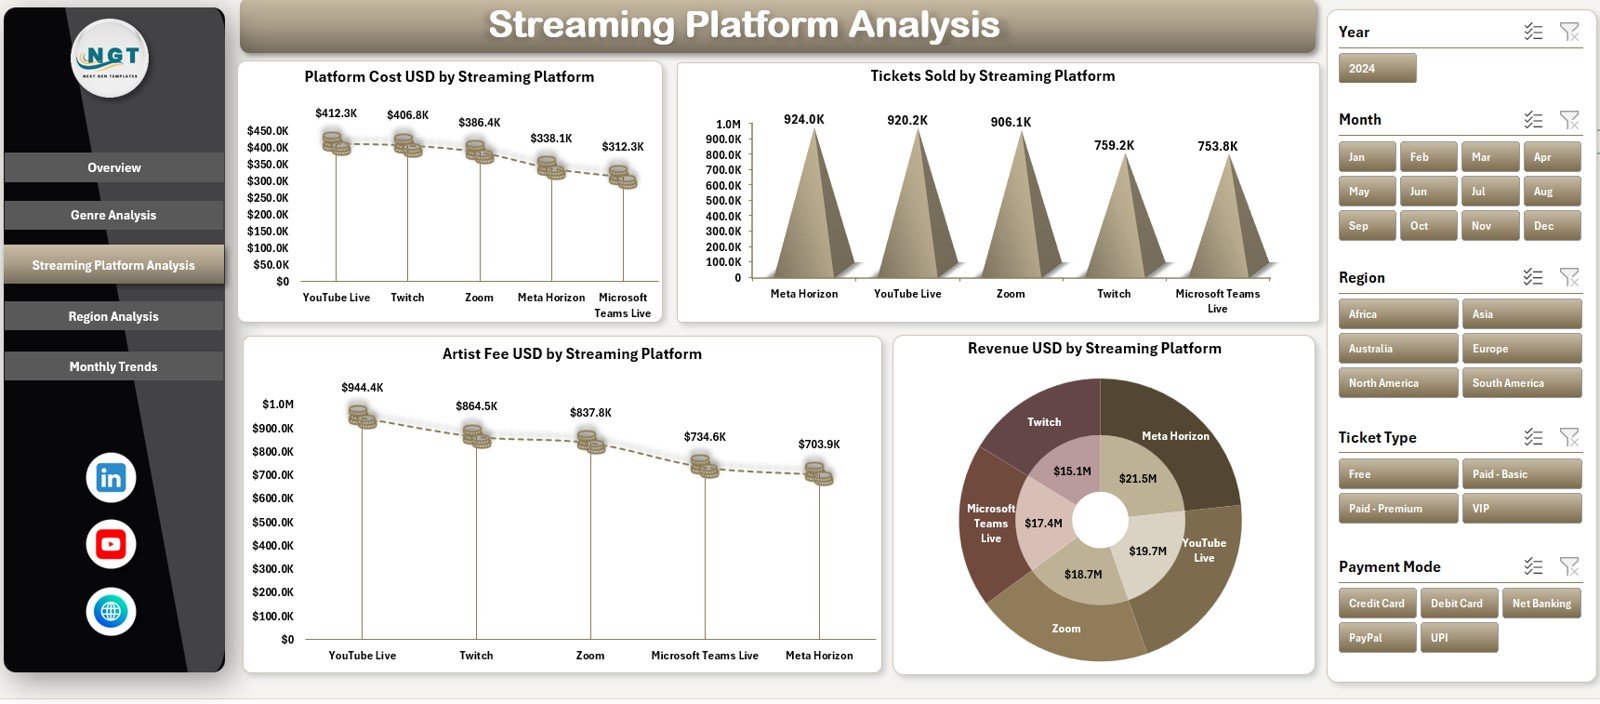
📡 Streaming Platform Analysis Page
-
Platform Cost by Streaming Platform
-
Tickets Sold by Platform
-
Artist Fee by Platform
-
Revenue by Platform
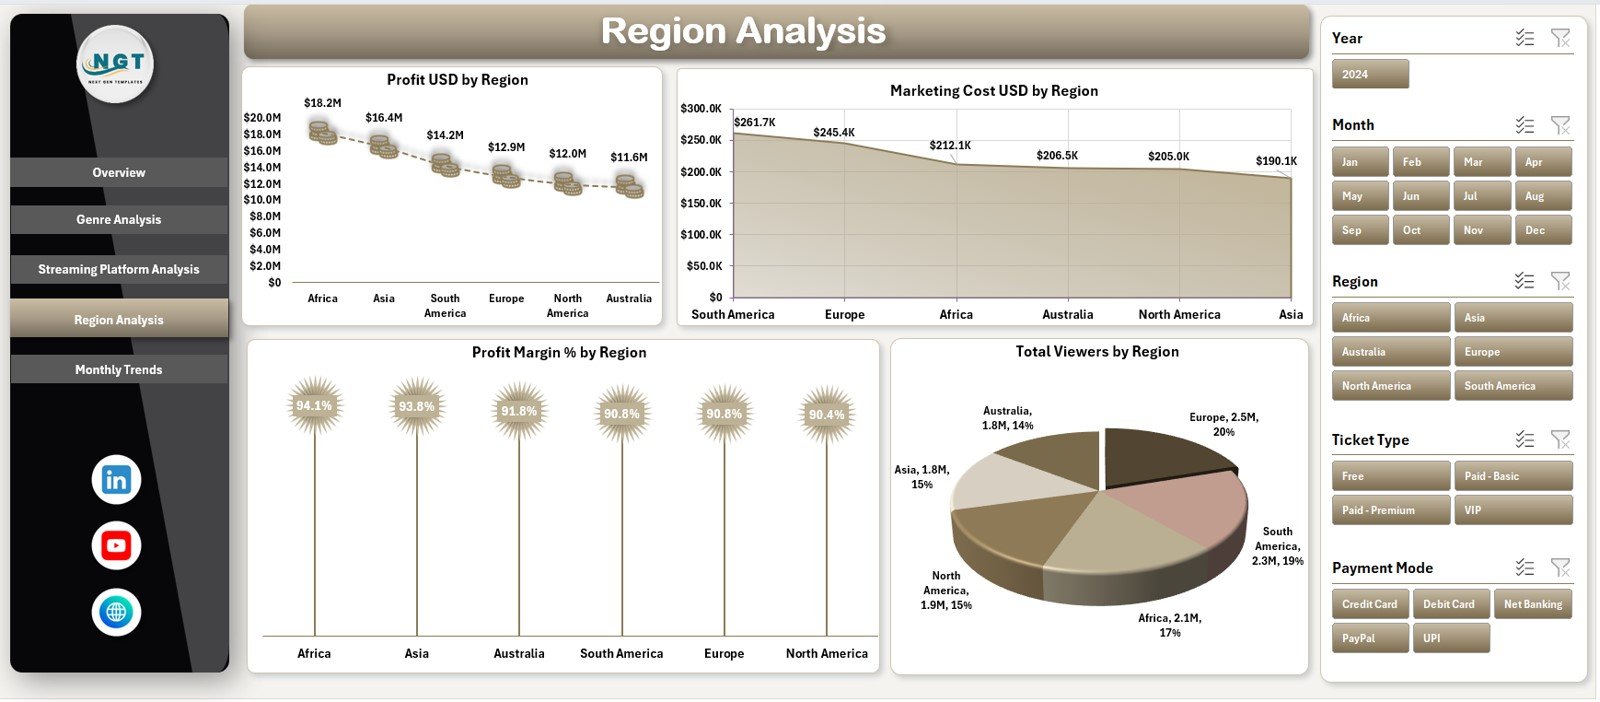
🌍 Region Analysis Page
-
Profit by Region
-
Marketing Cost by Region
-
Profit Margin (%) by Region
-
Total Viewers by Region
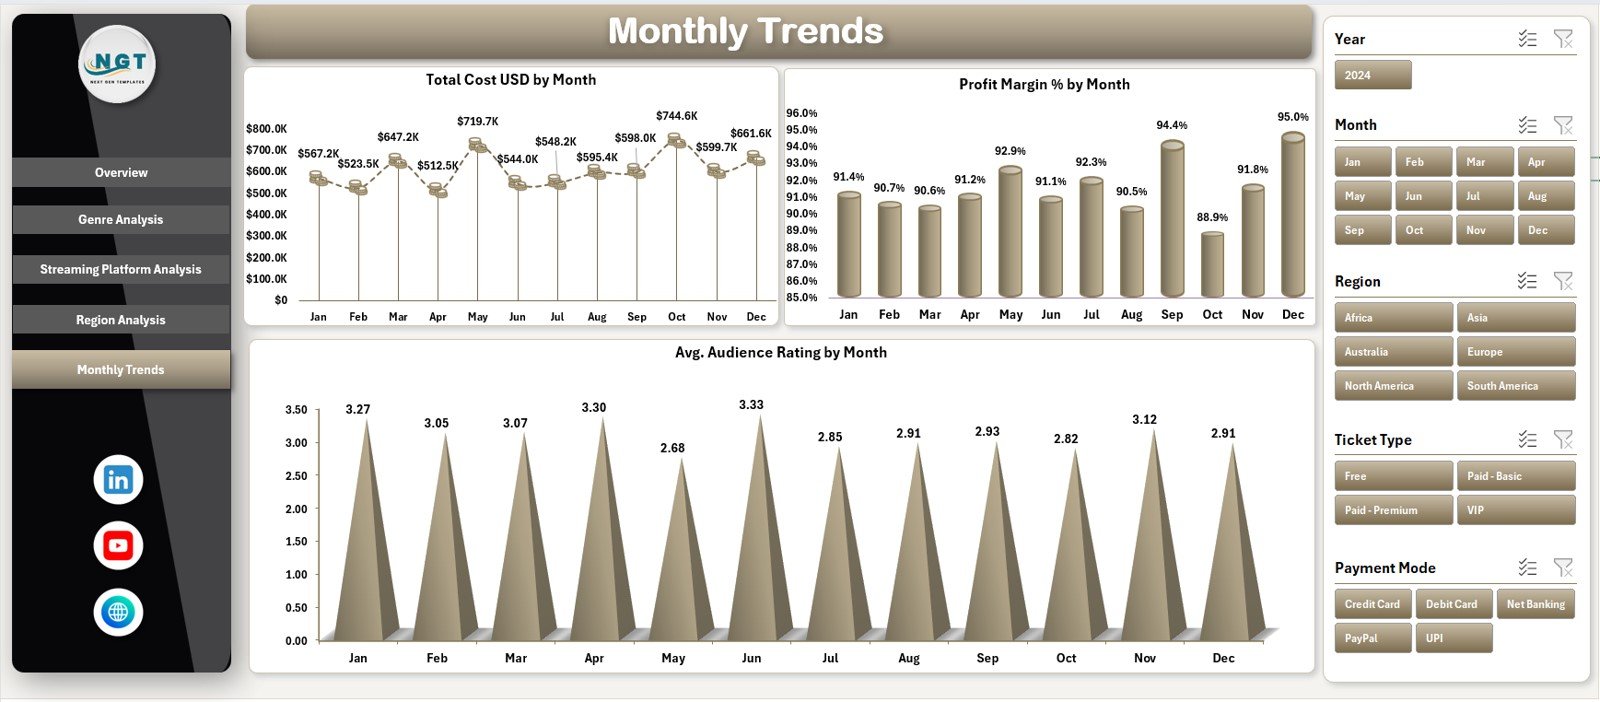
📆 Monthly Trends Page
-
Total Cost by Month
-
Profit Margin (%) by Month
-
Average Audience Rating by Month
🧩 Supporting Sheets
📄 Data Sheet – Stores all concert data (tickets, revenue, costs, ratings, platforms, genres, regions)
⚙️ Support Sheet – Manages dropdowns, validations, and helper calculations
🧭 How to Use the Virtual Concerts Dashboard in Excel
Using this dashboard is simple and intuitive:
1️⃣ Enter virtual concert data into the Data Sheet
2️⃣ Use the Page Navigator to switch between analysis pages
3️⃣ Apply slicers to filter by event, platform, genre, or region
4️⃣ Review KPIs, charts, and trends instantly
5️⃣ Use insights to improve pricing, marketing, and platform strategy
No advanced Excel formulas or technical setup is required.
👥 Who Can Benefit from This Virtual Concerts Dashboard in Excel
🎤 Virtual Event Organizers – Track profitability and audience response
🎵 Music Production Companies – Analyze genre and platform performance
🎸 Artist Management Teams – Understand revenue and engagement trends
📡 Streaming Platforms – Compare platform-wise performance
📊 Marketing & Finance Teams – Optimize spend and pricing strategies
This dashboard works for small events, recurring shows, and large-scale virtual concerts.
📖 Click here to read the Detailed blog post
📺 Visit our YouTube channel to learn step-by-step video tutorials
👉 YouTube.com/@PKAnExcelExpert


Reviews
There are no reviews yet.