
In today’s competitive business environment, customer advocacy has become one of the strongest drivers of sustainable growth. When customers actively recommend your brand, leave positive reviews, share testimonials, and promote your products organically, your acquisition costs reduce and trust builds naturally. However, many organizations struggle to measure customer advocacy effectively because data remains scattered across surveys, CRMs, review platforms, and spreadsheets.
That is exactly where the Customer Advocacy KPI Dashboard in Google Sheets becomes a powerful and practical solution.
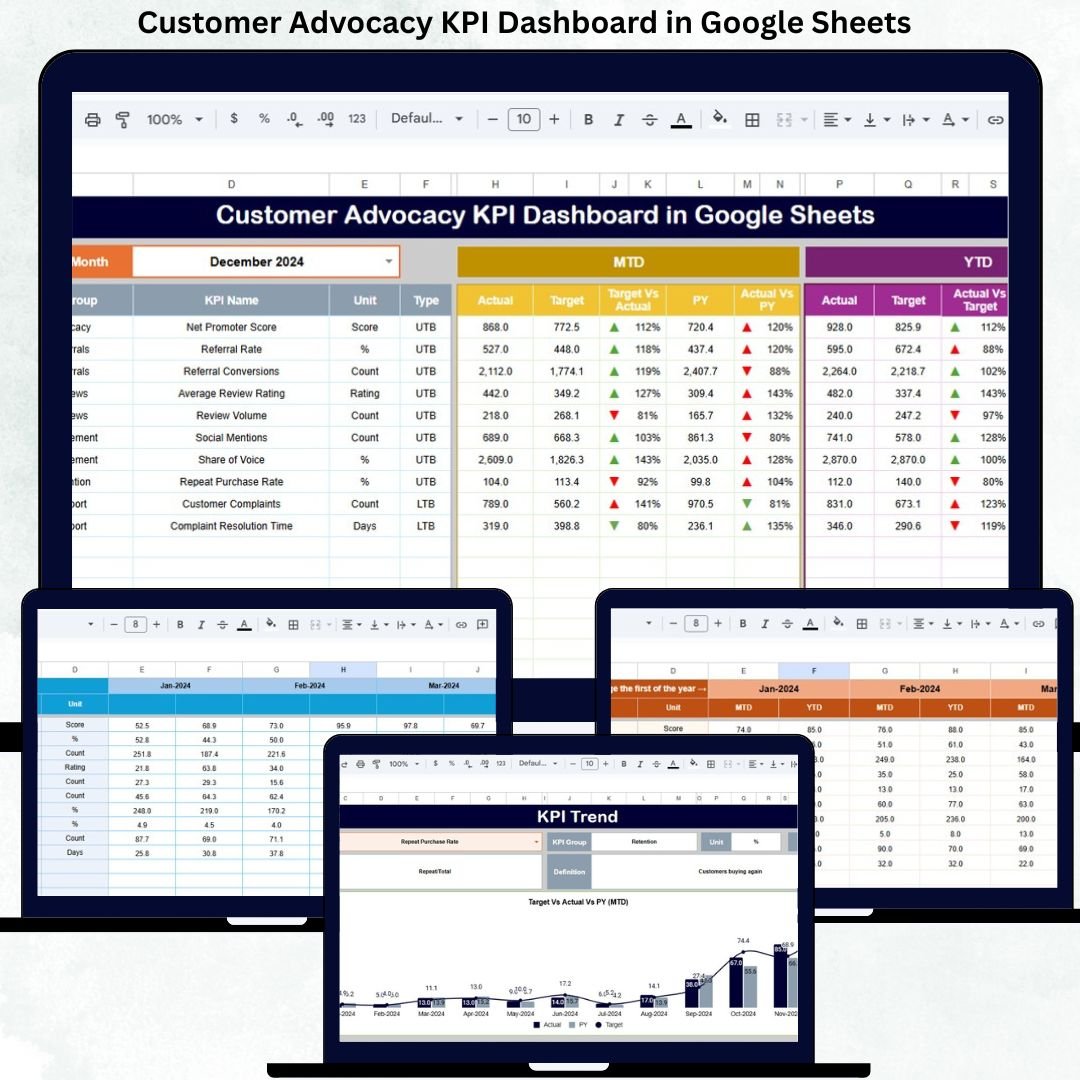
This ready-to-use dashboard helps businesses track, measure, and analyze customer advocacy performance using clearly defined KPIs, visual indicators, and trend analysis. Instead of relying on assumptions, teams can monitor advocacy health using Month-to-Date (MTD), Year-to-Date (YTD), target, and previous-year comparisons—all in one centralized Google Sheets dashboard.
Because the dashboard runs entirely in Google Sheets, it remains cloud-based, collaborative, cost-effective, and extremely easy to use. No expensive BI tools or technical expertise are required. Simply update the data, select the month, and the dashboard automatically delivers actionable insights.
🚀 Key Features of the Customer Advocacy KPI Dashboard
-
📊 Centralized customer advocacy performance tracking
-
📅 Dynamic month selection with automatic refresh
-
🎯 MTD, YTD, Target & Previous Year comparison
-
📈 KPI-wise trend analysis for long-term visibility
-
🔼🔽 Visual performance indicators (improvement / decline)
-
📘 Clear KPI definitions with formulas
-
🤝 Real-time collaboration in Google Sheets
-
⚙️ Fully customizable and scalable design
📦 What’s Inside the Customer Advocacy KPI Dashboard
The dashboard includes 6 structured worksheet tabs, each designed to deliver clarity and control.
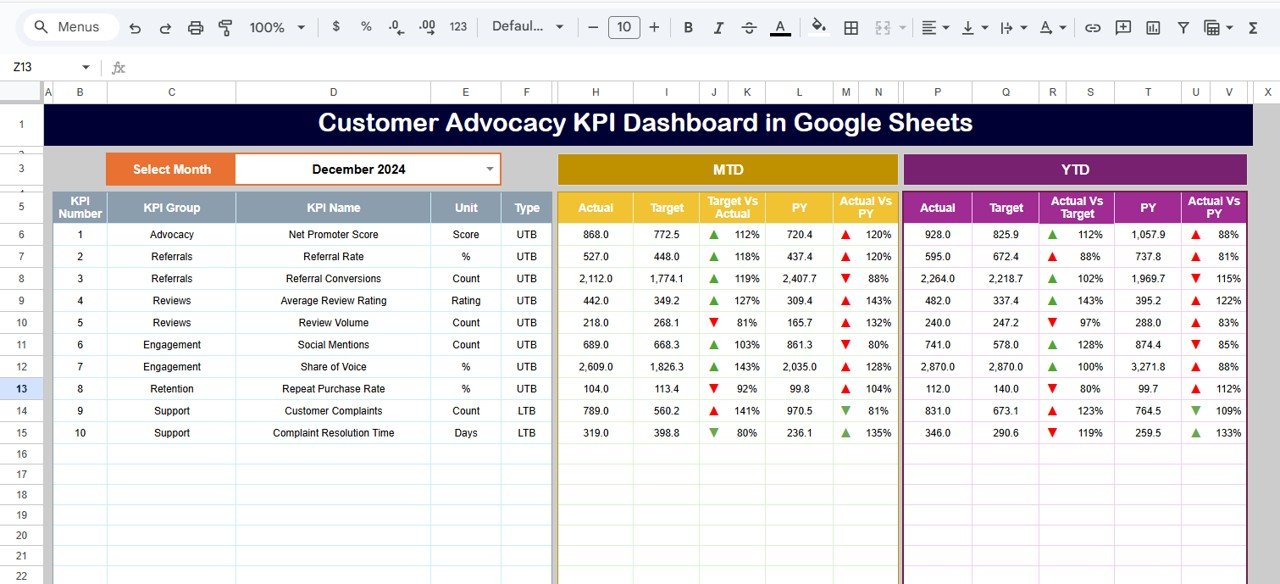
📌 Dashboard Sheet Tab (Main Page)
This is the executive summary page.
-
Select the month from cell D3
-
All KPIs update instantly
Displayed Metrics:
-
MTD Actual, Target & Previous Year
-
Target vs Actual
-
Previous Year vs Actual
-
YTD Actual, Target & Previous Year
-
Performance arrows for quick interpretation
This page allows leadership to understand advocacy performance in seconds.
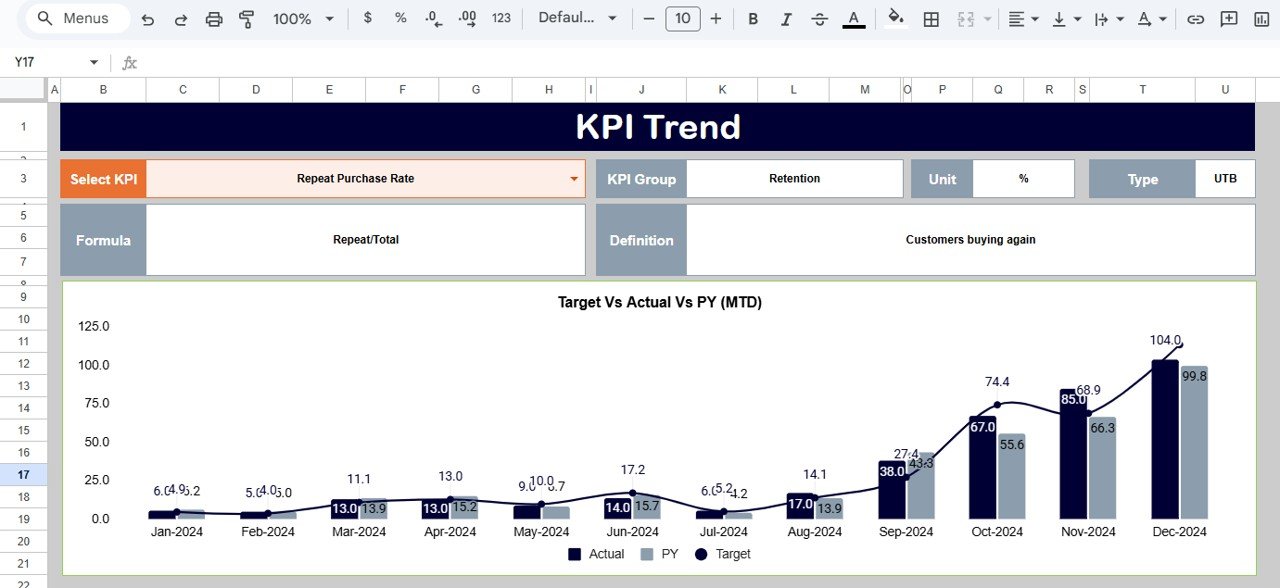
📉 KPI Trend Sheet Tab
This sheet provides deep insight into individual KPIs.
-
Select KPI from cell C3
-
Automatically displays:
-
KPI Group
-
Unit
-
KPI Type (Upper the Better / Lower the Better)
-
Formula
-
Definition
-
Monthly trend chart
-
This helps teams identify growth patterns, stagnation, or decline in advocacy metrics.
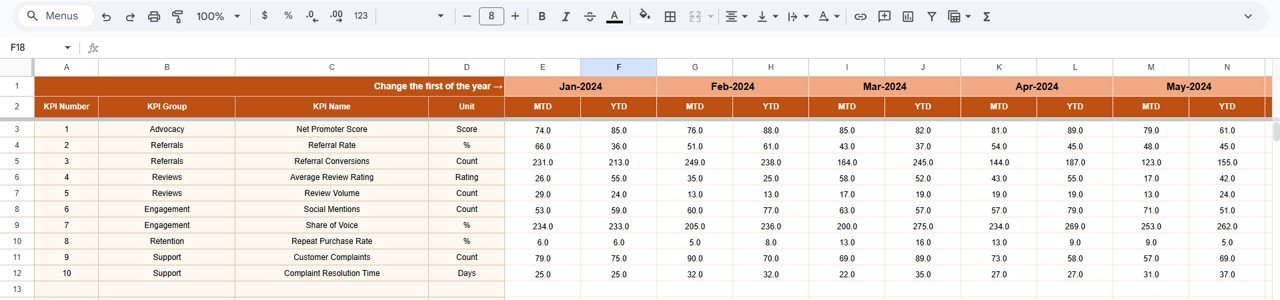
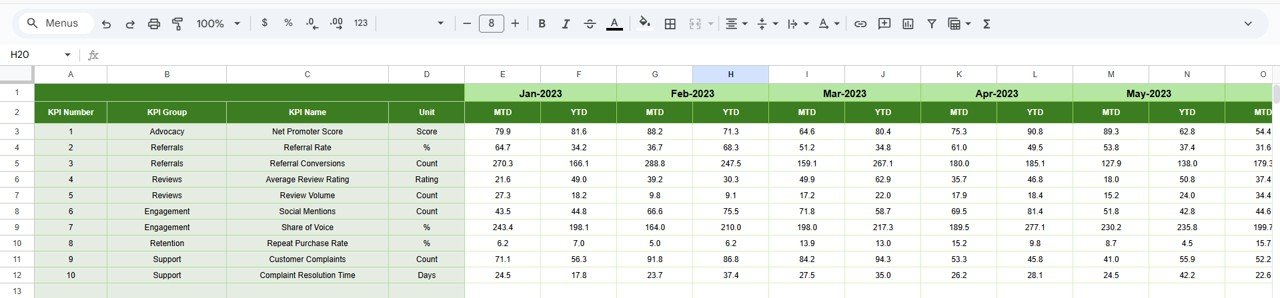
🧮 Actual Number Sheet Tab
This is the data entry sheet.
-
Define first month of the year in cell E1
-
Enter MTD & YTD actual values
-
All visuals update automatically
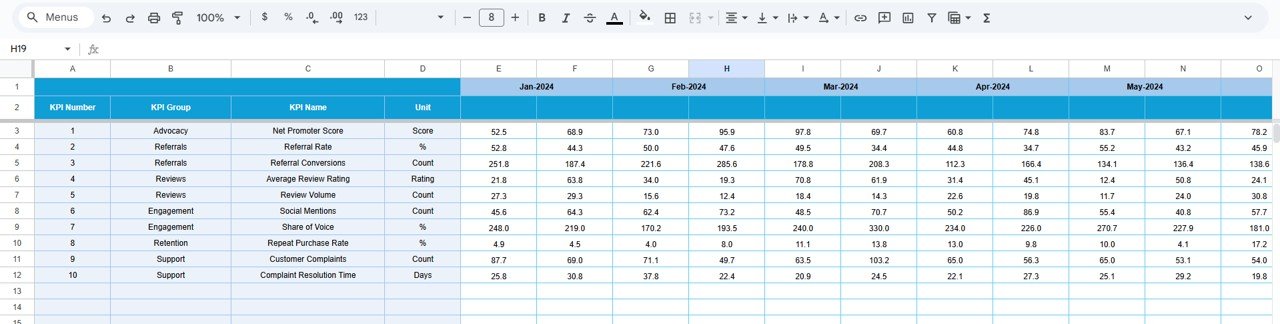
🎯 Target Sheet Tab
This sheet stores:
-
Monthly (MTD) targets
-
Annual (YTD) targets
Targets help teams measure success objectively and drive accountability.
⏮️ Previous Year Number Sheet Tab
This sheet contains last year’s KPI values.
It enables:
-
Year-over-year comparison
-
Benchmarking
-
Long-term advocacy analysis
📘 KPI Definition Sheet Tab
This is the control center of the dashboard.
It includes:
-
KPI Name
-
KPI Group
-
Unit
-
Formula
-
Definition
-
KPI Type (UTB / LTB)
This ensures clarity, consistency, and easy onboarding.
🛠️ How to Use the Customer Advocacy KPI Dashboard
1️⃣ Update advocacy data monthly
2️⃣ Select the reporting month
3️⃣ Review MTD & YTD performance
4️⃣ Compare target vs actual results
5️⃣ Analyze trends using KPI Trend sheet
6️⃣ Improve advocacy strategy using insights
👥 Who Can Benefit from This Dashboard
-
📣 Marketing Teams
-
🤝 Customer Success Teams
-
⭐ Brand & Advocacy Managers
-
📊 CX & Insights Teams
-
🧠 Leadership & Strategy Teams
### Click here to read the Detailed blog post
Watch the step-by-step video tutorial:


Reviews
There are no reviews yet.