Urban transportation infrastructure is expanding rapidly across cities worldwide. Metro Rail Projects Dashboard in Power BI play a vital role in reducing traffic congestion, lowering carbon emissions, and improving public mobility. However, managing metro rail projects is highly complex. These projects involve huge budgets, long execution timelines, multiple contractors, funding agencies, zones, phases, and stations. When data is tracked using scattered Excel files and static reports, project visibility becomes poor and decision-making turns reactive.
That is exactly where the Metro Rail Projects Dashboard in Power BI becomes a game-changing solution.
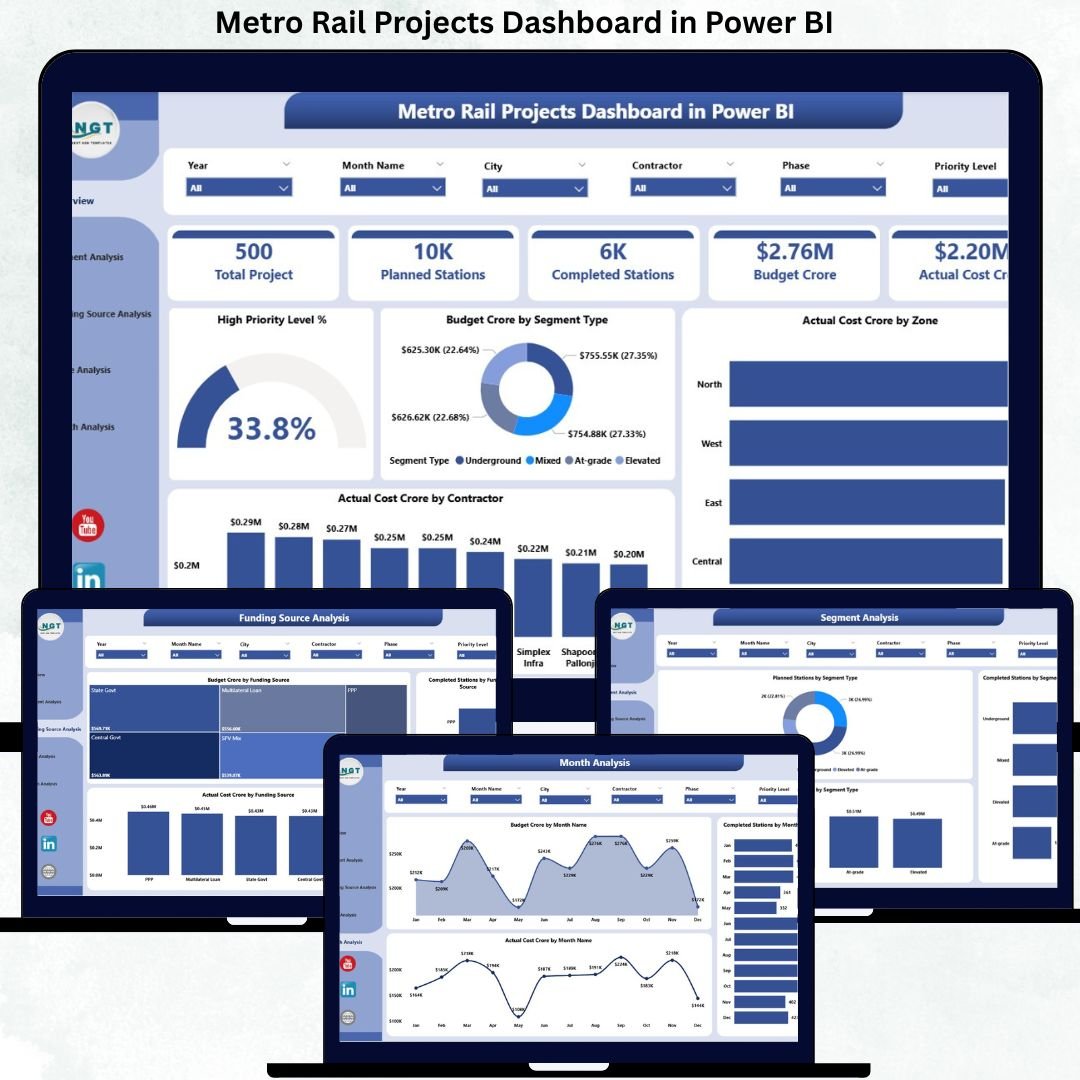
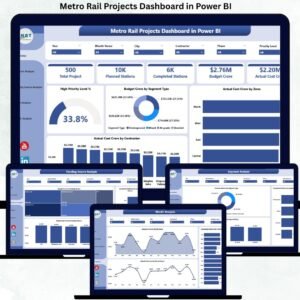
This ready-to-use Power BI dashboard provides a centralized, interactive, and real-time view of metro rail project performance. Instead of spending hours compiling reports, project teams can instantly monitor budget utilization, actual costs, project progress, station completion, funding sources, phases, contractors, and monthly trends—all from one professional dashboard.
Because the dashboard is built in Power BI with flexible Excel-based data inputs, it is easy to update, scalable, and suitable for both ongoing and multi-year metro rail projects.
🚀 Key Features of Metro Rail Projects Dashboard in Power BI
The Metro Rail Projects Dashboard in Power BI is designed with five structured analytical pages, each answering a critical project management question.
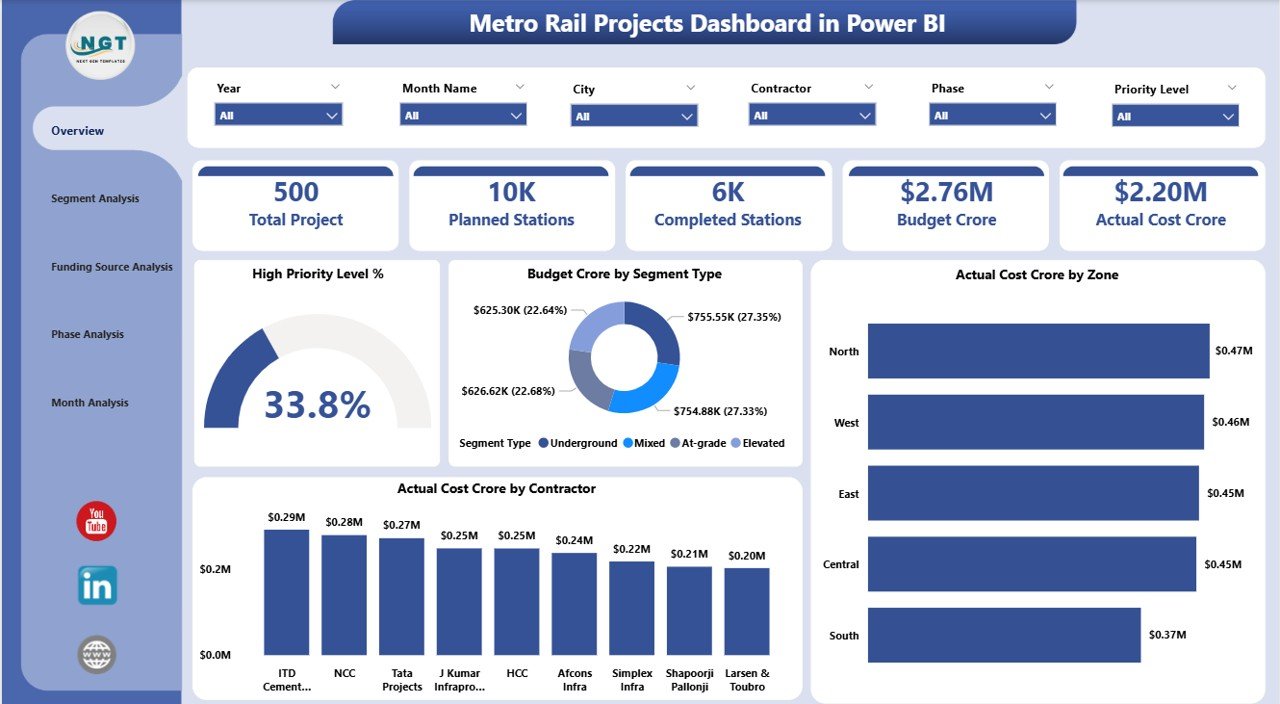
📊 Overview Page – Executive Project Health Snapshot
-
🔹 Interactive slicers for City, Zone, Contractor, Segment Type, and Month
-
🔹 4 KPI Cards highlighting key project indicators
-
🔹 High Priority Level % to track critical project focus
-
🔹 Budget (Crore) by Segment Type for planning clarity
-
🔹 Actual Cost (Crore) by Zone for geographic control
-
🔹 Actual Cost (Crore) by Contractor for accountability
This page enables leadership to instantly assess whether the metro project is on track or requires intervention.
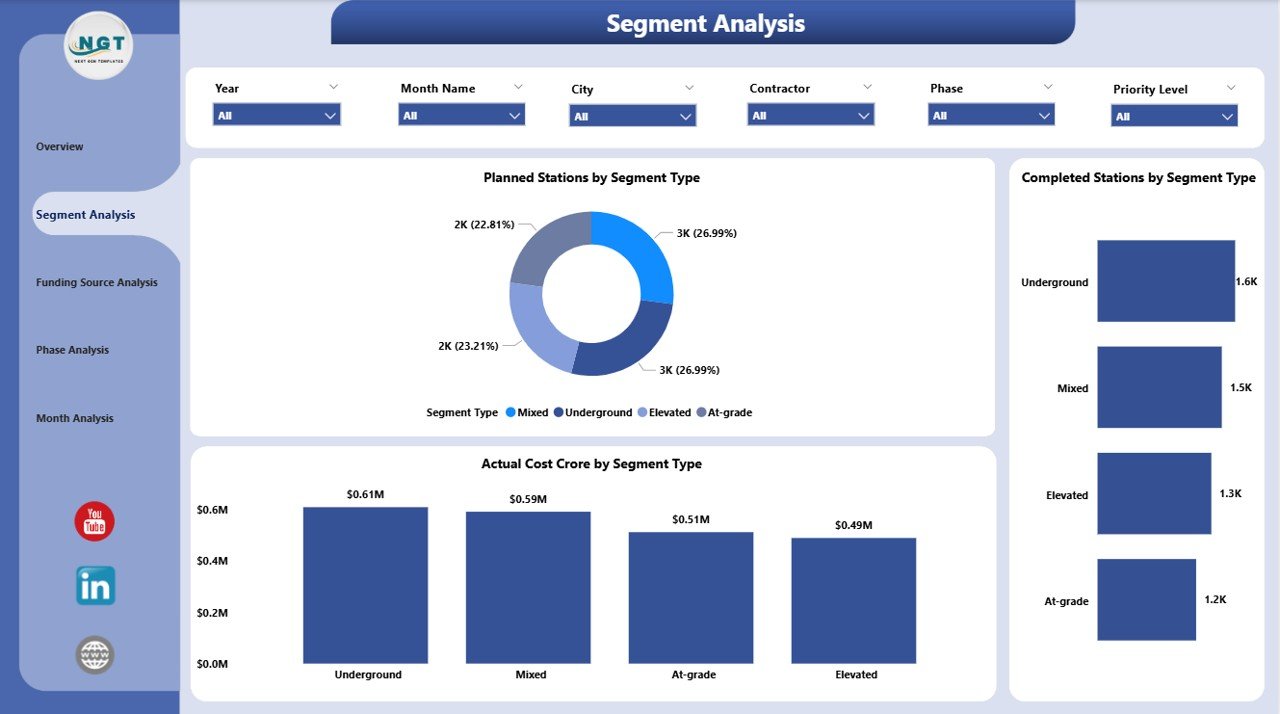
🏗 Segment Analysis Page
-
📍 Planned Stations by Segment Type
-
📍 Completed Stations by Segment Type
-
📍 Actual Cost (Crore) by Segment Type
This analysis helps teams compare elevated, underground, and at-grade segments, identify execution risks, and control segment-wise costs.
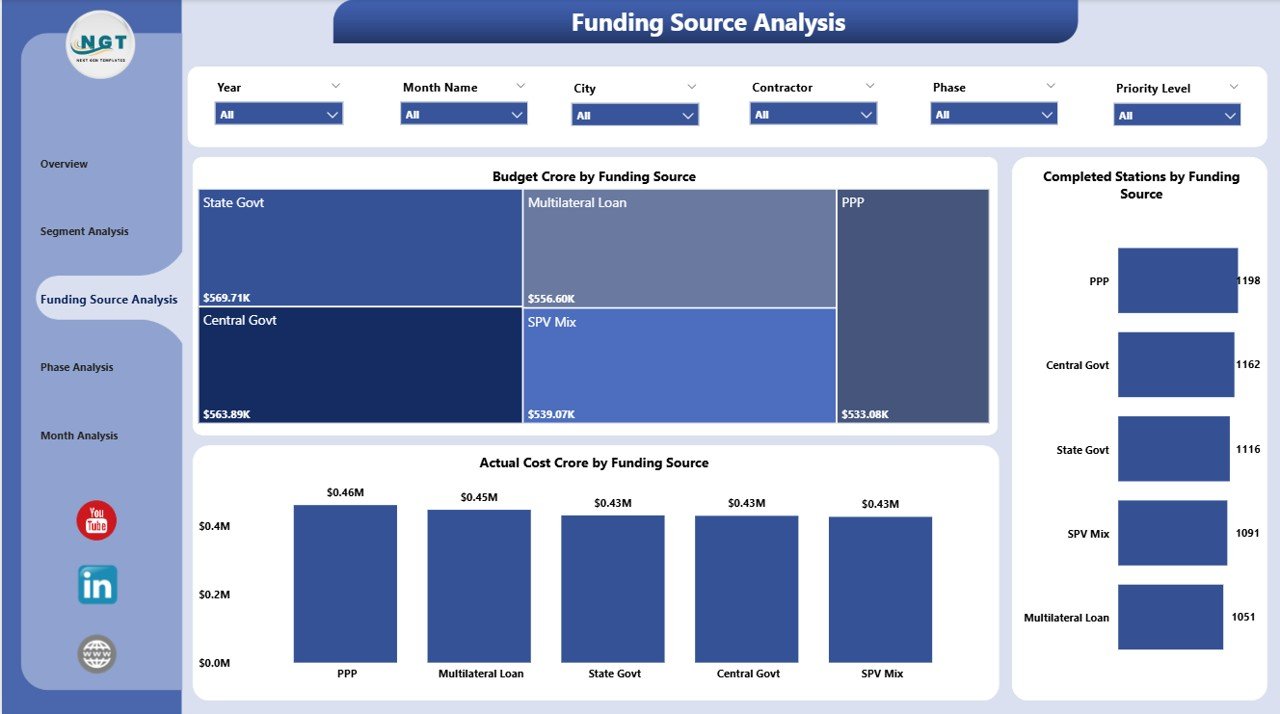
💰 Funding Source Analysis Page
-
📍 Budget (Crore) by Funding Source
-
📍 Completed Stations by Funding Source
-
📍 Actual Cost (Crore) by Funding Source
-
📍 Budget Annual by City
-
📍 Capex Budget by City
-
📍 High Priority Projects by City
This page ensures financial transparency, compliance, and effective fund utilization across cities and agencies.
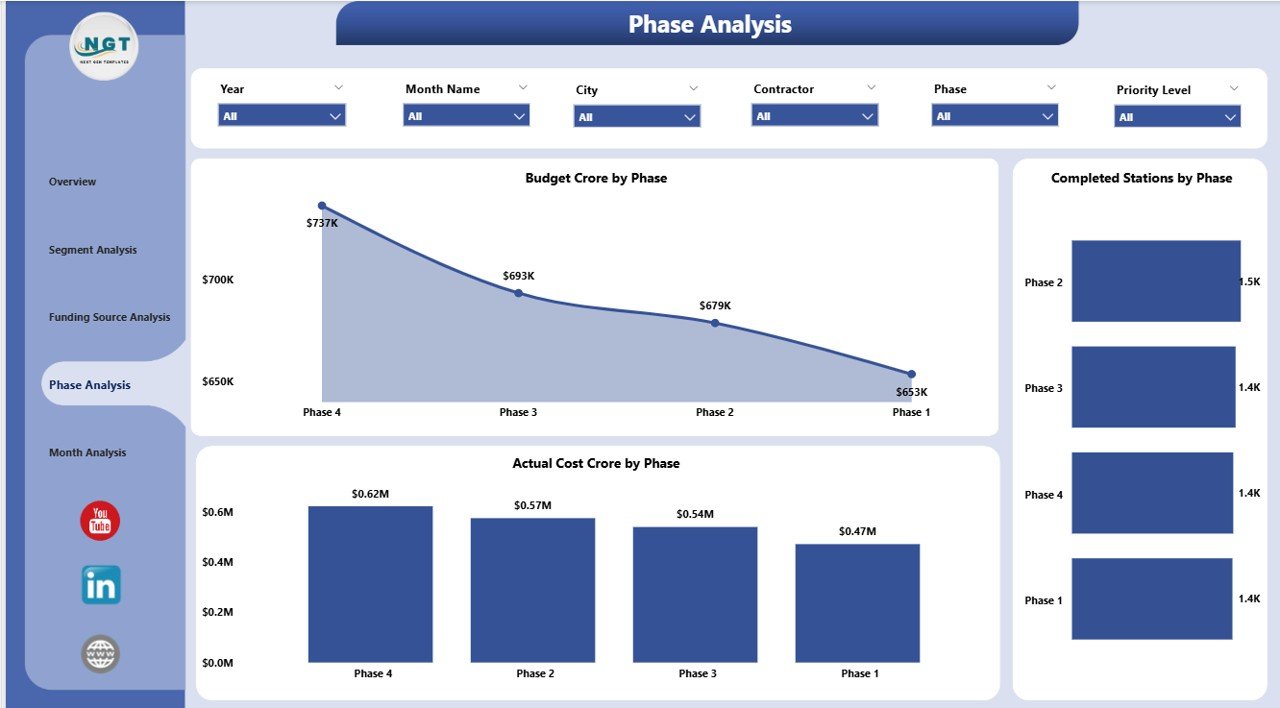
🧩 Phase Analysis Page
-
📍 Budget (Crore) by Phase
-
📍 Completed Stations by Phase
-
📍 Actual Cost (Crore) by Phase
Project managers can easily track phase-wise execution performance and identify phases causing delays or overruns.
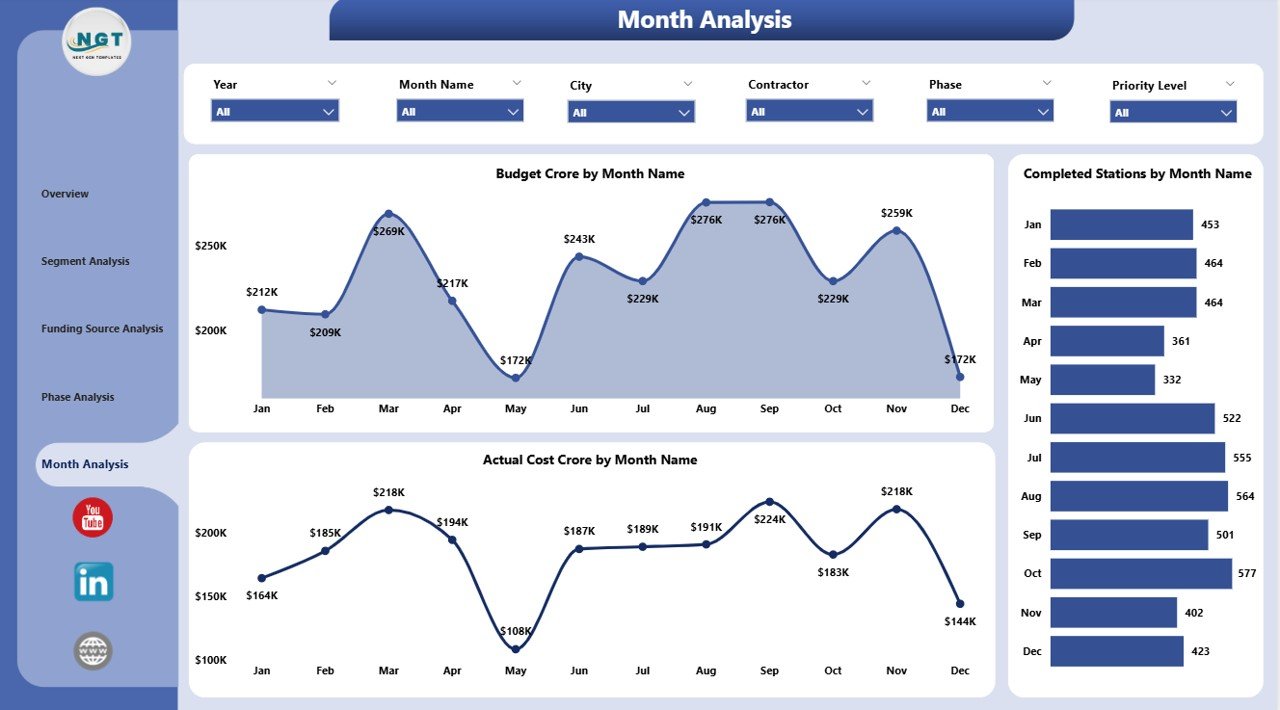
📈 Monthly Trends Page
-
📍 Budget (Crore) by Month
-
📍 Completed Stations by Month
-
📍 Actual Cost (Crore) by Month
Monthly trend analysis helps detect early delays, spending spikes, and execution momentum.
📦 What’s Inside the Metro Rail Projects Dashboard in Power BI
-
✅ Power BI (.pbix) dashboard file
-
✅ Structured multi-page layout (Overview, Segment, Funding, Phase, Trends)
-
✅ Interactive slicers and filters
-
✅ KPI cards and high-impact visuals
-
✅ Ready-to-connect Excel data structure
-
✅ Clean, professional, and presentation-ready design
⚙️ How to Use the Metro Rail Projects Dashboard in Power BI
-
Update project data in Excel (or your connected data source)
-
Refresh the Power BI dashboard
-
Use slicers to filter by city, zone, contractor, phase, or funding source
-
Monitor budget vs actual costs and station progress
-
Identify risks, delays, and overspending early
-
Use insights for executive reviews and stakeholder reporting
No coding or advanced Power BI skills are required for day-to-day usage.
👥 Who Can Benefit from This Dashboard
-
🚆 Metro Rail Project Authorities
-
🏗 Project Directors & Engineering Teams
-
💼 PMOs & Infrastructure Consultants
-
💰 Finance & Budget Control Teams
-
🏛 Government & Urban Development Bodies
-
📊 Infrastructure Analytics Teams
This dashboard works for single-city or multi-city metro rail programs.
### Click here to read the Detailed blog post
📺 Visit our YouTube channel to learn step-by-step video tutorials
👉 https://youtube.com/@PKAnExcelExpert


Reviews
There are no reviews yet.