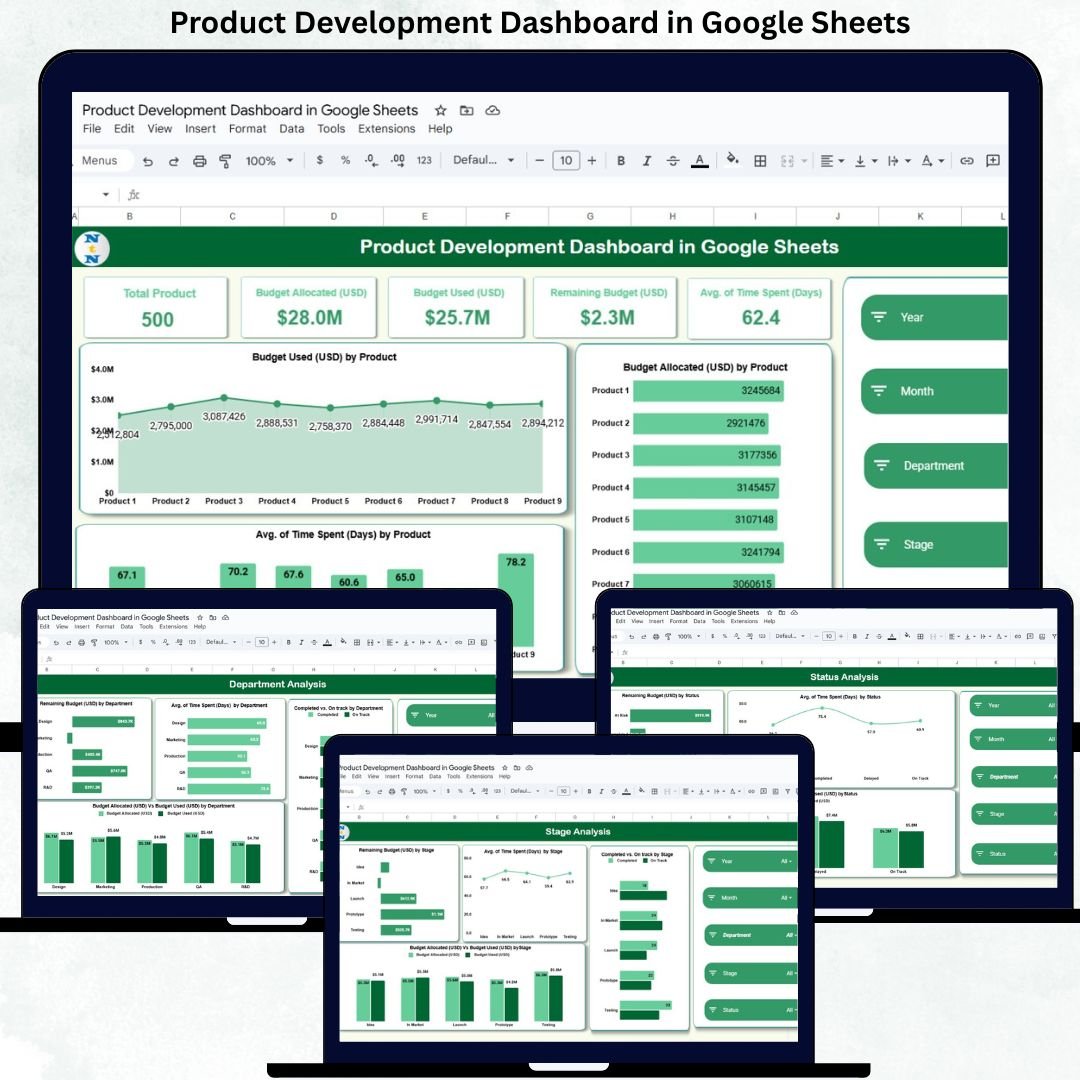


In today’s fast-moving business world, product development teams must work faster, smarter, and more collaboratively. New ideas emerge constantly, customer expectations change quickly, and teams must juggle multiple priorities at once. Without a clear system to track budget, timelines, department performance, and progress across stages, organizations face delays, overspending, and missed opportunities. The Product Development Dashboard in Google Sheets solves this challenge with a powerful, structured, and easy-to-use monitoring solution.
This dashboard collects all key metrics in one place and gives product managers instant clarity on product performance. Whether you’re tracking budgets, comparing departments, analyzing development stages, or monitoring the status of each project, this dashboard displays everything with clean visuals and automated KPIs. As it runs entirely in Google Sheets, it offers real-time collaboration, fast updates, and zero software installation—making it perfect for teams of all sizes.

✨ Key Features of the Product Development Dashboard in Google Sheets
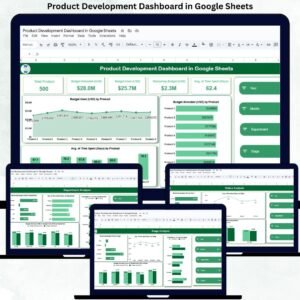
📊 1. Clear KPI Cards for Instant Insights
The dashboard opens with five performance cards that summarize your entire pipeline:
-
Total Products
-
Budget Allocated (USD)
-
Budget Used (USD)
-
Remaining Budget (USD)
-
Avg. Time Spent (Days)
These cards give managers an instant health check of their product development ecosystem.
📈 2. Smart Dashboard Charts for Deeper Analysis
Three powerful visuals display real-time performance across products:
-
Budget Used (USD) by Product
-
Budget Allocated (USD) by Product
-
Avg. Time Spent (Days) by Product
These charts help managers identify costly products, track investment patterns, and compare development durations.
🏢 3. Department-Wise Analysis for Stronger Collaboration
Every department plays a critical role in product development. This section helps managers understand how each function performs.
Charts included:
-
Remaining Budget (USD) by Department
-
Avg. Time Spent (Days) by Department
-
Completed vs. On Track by Department
-
Budget Allocated vs Budget Used by Department
This improves cross-department communication, resource allocation, and performance tracking.
📦 4. Stage Analysis to Identify Bottlenecks
Products move through stages like Concept, Prototype, Testing, Pre-Launch, and Release. This view highlights:
-
Time consumption
-
Budget usage
-
Completion rates
-
Delays and potential risks
By identifying which stage slows the process, teams can improve development flow.
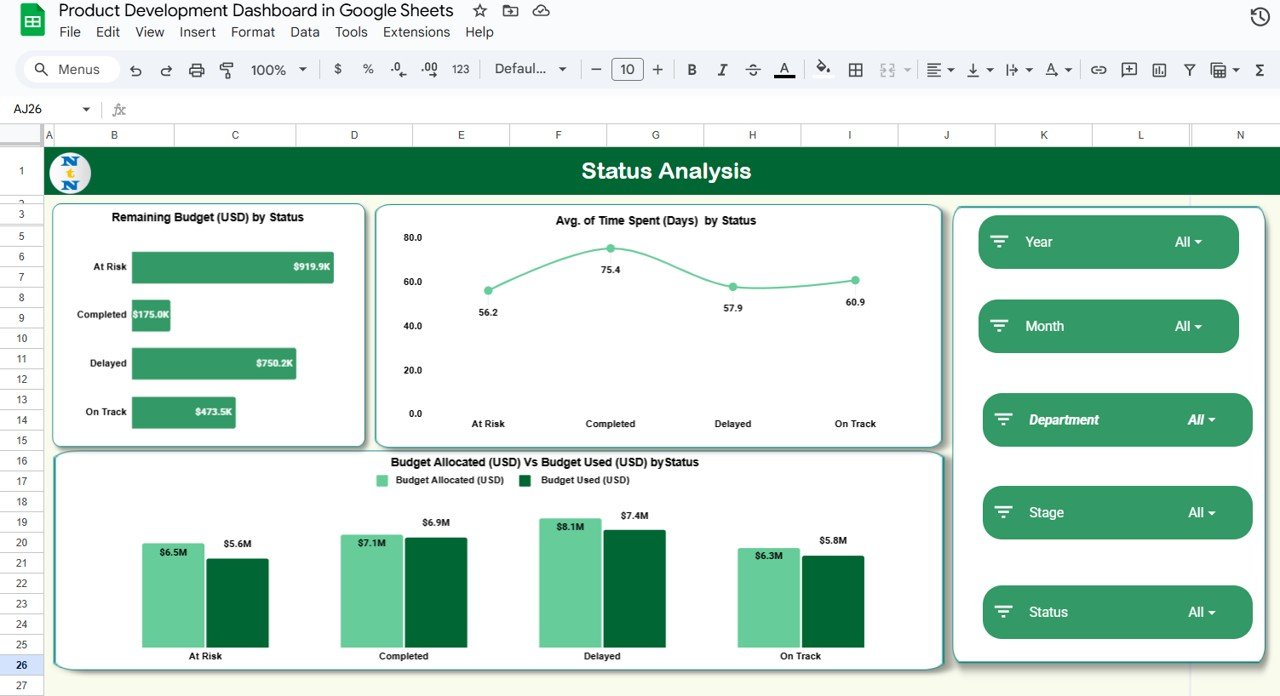
⏳ 5. Status Analysis for Better Project Monitoring
Statuses such as Completed, On Track, Delayed, and On Hold reveal the real health of your pipeline. This section shows:
-
Remaining Budget by Status
-
Avg. Time Spent by Status
-
Budget Allocated vs Budget Used by Status
This helps managers detect risks early and boost on-time delivery.
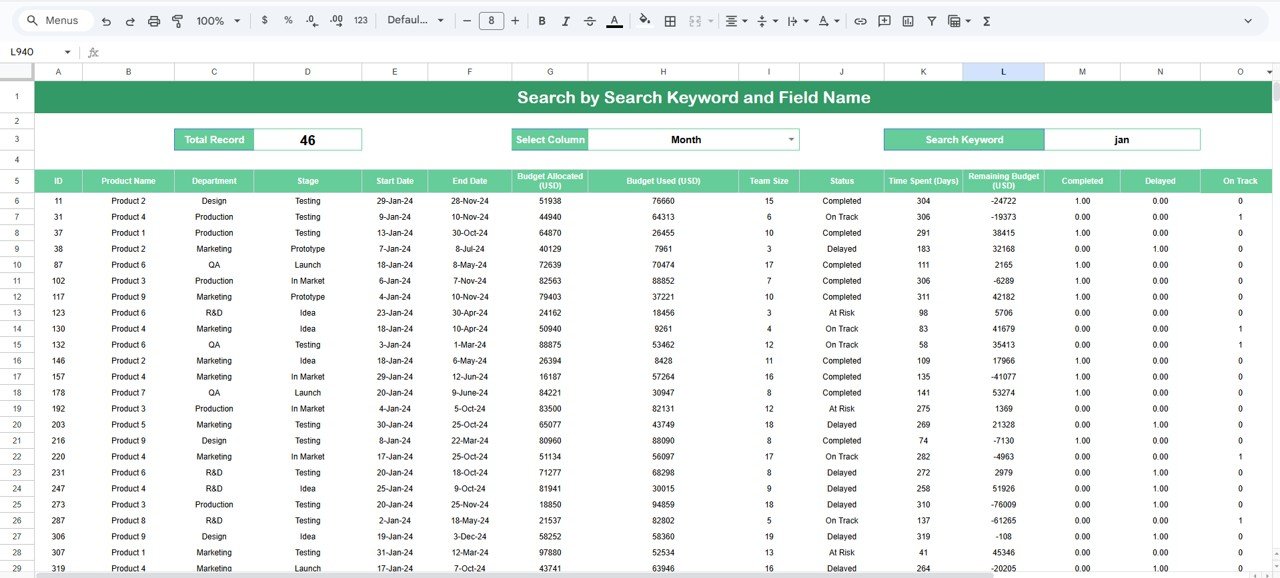
🔍 6. Smart Search Function to Find Anything Instantly
Search by keyword and field name to locate any product detail in seconds. No scrolling. No manual filtering. Perfect for review meetings.
📦 What’s Inside the Product Development Dashboard in Google Sheets
🖥️ Dashboard Sheet Tab
Your central reporting page with all KPIs and visuals.
🏢 Department Analysis Sheet
Shows team-wise performance and budget usage.
🔄 Stage Analysis Sheet
Highlights bottlenecks and development durations.
📌 Status Analysis Sheet
Tracks progress and identifies risk-prone projects.
🗂️ Data Sheet
All product entries stored in one structured table.
🔍 Search Panel
Filter results instantly for faster decision-making.
🛠️ How to Use the Product Development Dashboard in Google Sheets
1️⃣ Enter Product Data in the Data Sheet
Update product name, department, stage, status, budget, and time spent regularly.
2️⃣ Refresh Dashboard Automatically
The visuals update instantly—no formulas or coding required.
3️⃣ Review Department & Stage Insights Weekly
This ensures early detection of delays or overspending.
4️⃣ Use Search Before Meetings
Quickly pull product details using keyword-based search.
5️⃣ Compare Statuses for Risk Management
Take action immediately when “Delayed” or “On Hold” numbers rise.
🎯 Who Can Benefit from This Product Development Dashboard
📅 Product Managers
Track development flow, identify risks, and monitor KPIs instantly.
🏢 R&D & Engineering Teams
Understand their performance and optimize development time.
📊 Leadership & Strategy Teams
Review insights for better decision-making and planning.
📦 Operations Teams
Manage resources effectively across departments and stages.
🚀 Startups & Growing Companies
Monitor innovation pipeline and control budget usage effortlessly.
### Click here to read the Detailed blog post
Watch the step-by-step video tutorial:


Reviews
There are no reviews yet.