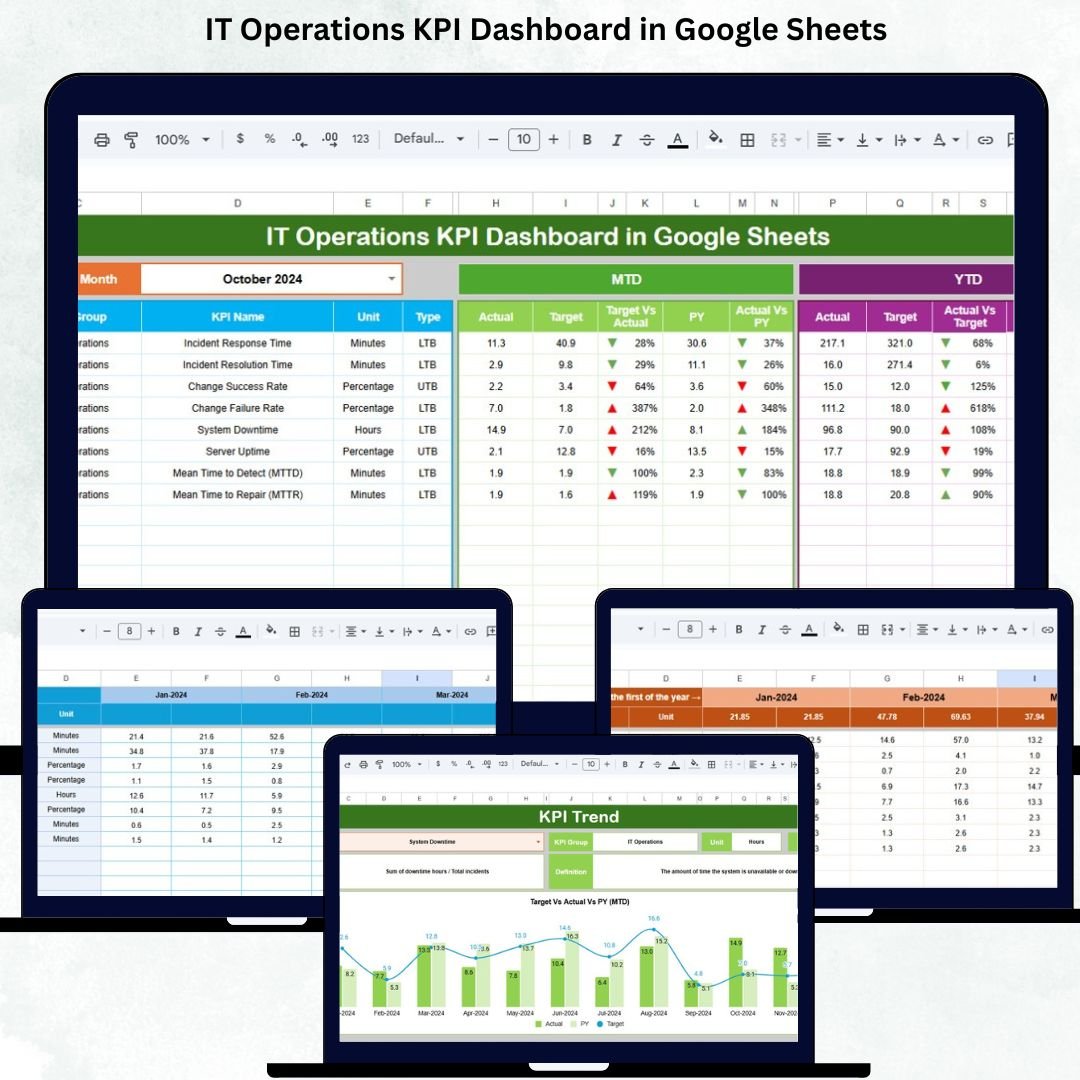

Modern businesses depend heavily on IT systems to operate smoothly. From servers and networks to applications and support services, IT operations teams ensure that everything stays online, secure, and efficient. However, as infrastructure grows more complex, IT teams often struggle with scattered reports, delayed incident tracking, unclear performance metrics, and limited visibility into service quality. This is exactly where the IT Operations KPI Dashboard in Google Sheets delivers massive value.IT Operations KPI Dashboard in Google Sheets
This ready-to-use dashboard provides a centralized and structured way to monitor IT performance in real time. Instead of juggling multiple tools and reports, IT leaders can track incidents, uptime, response time, capacity utilization, service quality, and operational cost—all in one interactive dashboard. Because it is built entirely in Google Sheets, the dashboard remains simple, flexible, collaborative, and accessible without expensive ITSM tools or coding.IT Operations KPI Dashboard in Google Sheets
🚀 Key Features of the IT Operations KPI Dashboard in Google Sheets
📊 Real-Time IT Performance Monitoring
Track all critical IT operations KPIs related to incidents, availability, response efficiency, system stability, and workload. As soon as data changes, the dashboard updates automatically.
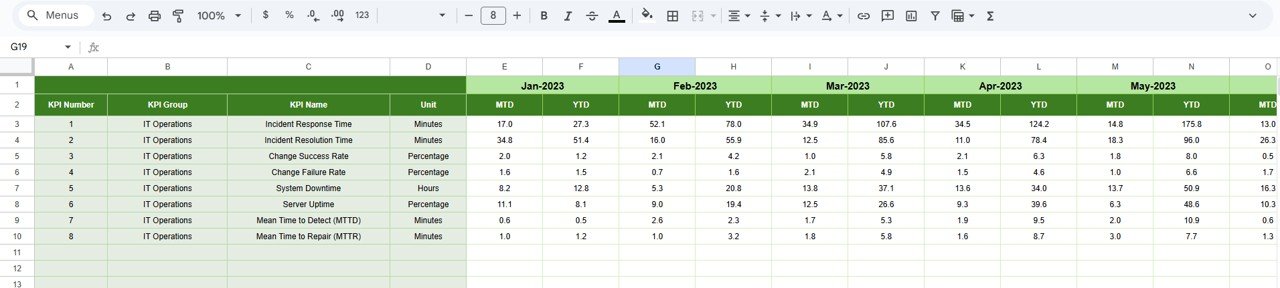
📅 MTD & YTD Performance Comparison
Monitor both Month-to-Date (MTD) and Year-to-Date (YTD) metrics, including:
-
Actual performance
-
Target benchmarks
-
Previous year values
-
Target vs Actual gaps
-
Previous Year vs Actual comparison
This ensures long-term as well as short-term visibility.
🚦 Visual Performance Indicators
Conditional formatting with arrows provides instant insights:
-
🟢 Green arrow → Performance improved
-
🔴 Red arrow → Performance declined
No need to read lengthy reports—issues are visible instantly.
📈 KPI Trend Analysis
Analyze month-wise KPI behavior to:
-
Spot recurring incident patterns
-
Identify rising downtime risks
-
Measure operational maturity
-
Improve proactive decision-making
📦 What’s Inside the IT Operations KPI Dashboard in Google Sheets
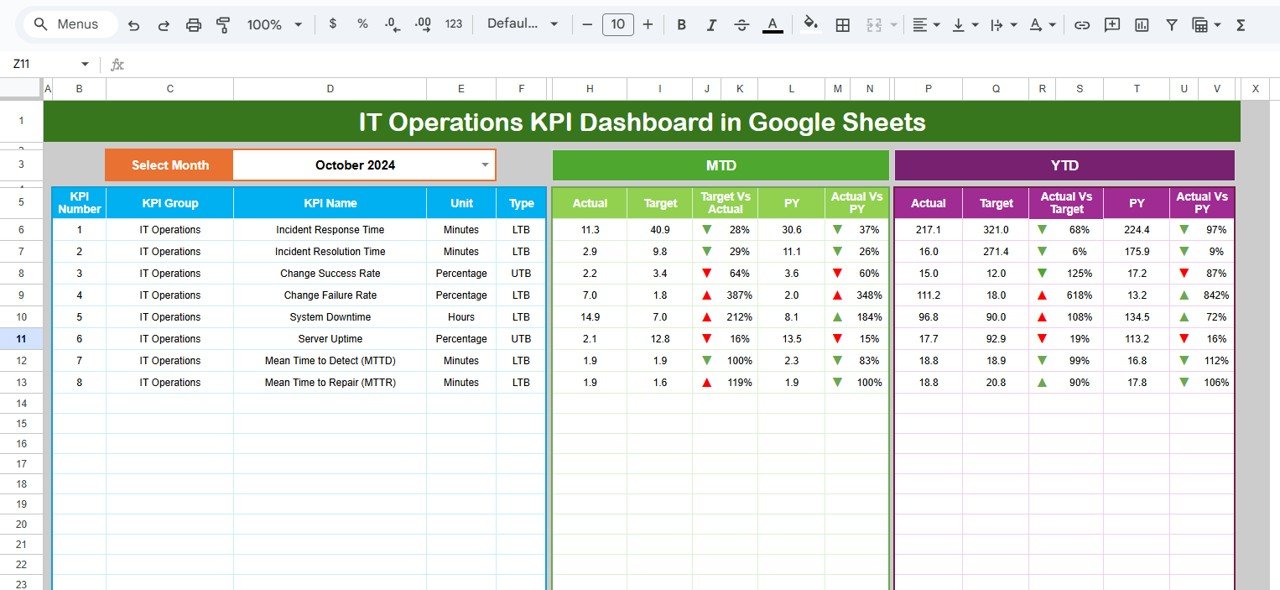
🖥️ Dashboard Sheet (Main Page)
This is the executive summary of IT operations.
When you select a month from cell D3, all KPIs refresh automatically.
It displays:
-
MTD Actual, Target, PY & variances
-
YTD Actual, Target, PY & variances
-
Performance arrows for fast review
Ideal for leadership reviews, governance meetings, and daily monitoring.
📊 KPI Trend Sheet
Select any KPI from the dropdown in cell C3 to view:
-
KPI Group
-
Unit of measurement
-
KPI Type (Upper / Lower the Better)
-
KPI Formula
-
KPI Definition
-
12-month trend chart
This sheet supports deep analysis and early issue detection.
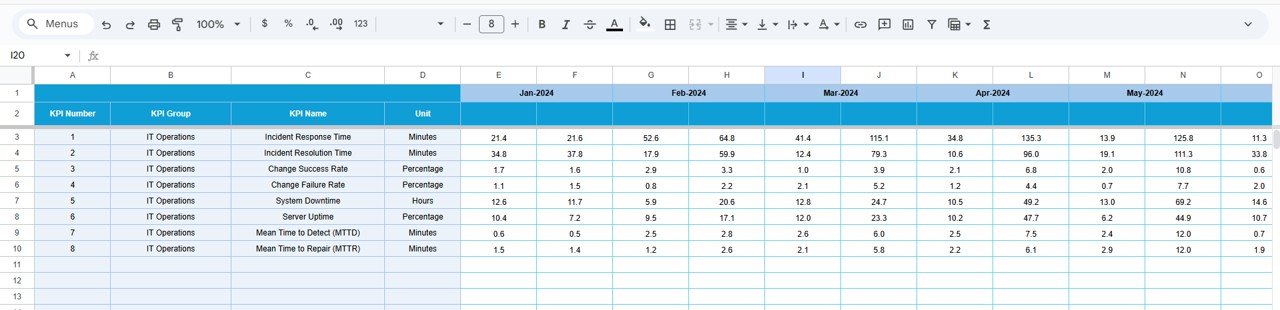
📝 Actual Number Sheet
Enter:
-
MTD Actual values
-
YTD Actual values
Set the business year start month in cell E1, and the structure adjusts automatically.
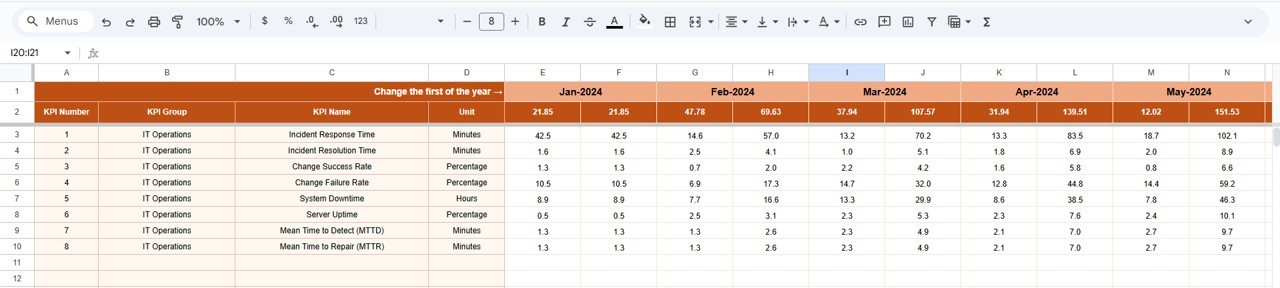
🎯 Target Sheet
Define performance goals:
-
Monthly (MTD) targets
-
Annual (YTD) targets
This helps IT teams measure success against SLAs and operational goals.
📆 Previous Year Number Sheet
Store last year’s data to:
-
Measure year-over-year improvement
-
Evaluate operational maturity
-
Support trend-based planning
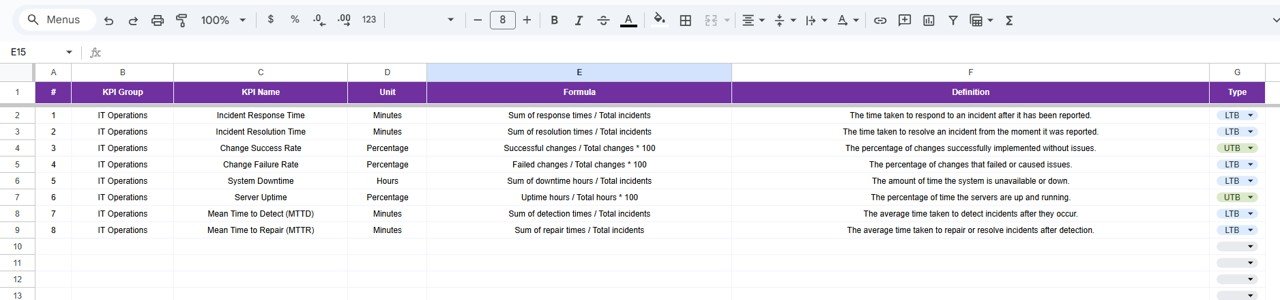
📘 KPI Definition Sheet
Ensures KPI governance and clarity by documenting:
-
KPI Name
-
KPI Group
-
Unit
-
Formula
-
Definition
-
KPI Type (UTB / LTB)
This aligns IT, management, and executives on the same metrics.
🛠️ How to Use the IT Operations KPI Dashboard
1️⃣ Update actual IT metrics every month
2️⃣ Maintain realistic performance targets
3️⃣ Review KPIs and arrows during meetings
4️⃣ Analyze trends instead of isolated values
5️⃣ Use insights to improve SLAs and uptime
No complex tools. No training required.
👥 Who Can Benefit from This IT Operations KPI Dashboard
🖥️ IT Operations & Infrastructure Teams
Monitor incidents, uptime, and workload effectively.
📋 Service Desk & Support Teams
Track response efficiency and resolution trends.
🧑💼 IT Managers & CIOs
Get instant visibility into operational health.
🏢 Business Leadership
Understand IT stability and risk exposure clearly.
Click here to read the Detailed blog post
Watch the step-by-step video tutorial:


Reviews
There are no reviews yet.