New: NextGenTemplates Academy - video courses on Excel formulas with AI and Pivot Tables & dashboards. Early-bird: 20% off with code EARLYBIRD20 - first 20 orders only.See the courses →
$19.99Original price was: $19.99.$12.99Current price is: $12.99.
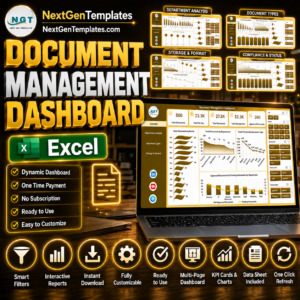
Efficiently track and manage your document-related KPIs with this comprehensive Excel dashboard, featuring real-time data analysis and trend tracking. 🌟📊
Key Features:
Home Sheet: Quick navigation to all dashboard sheets via six shortcut buttons.
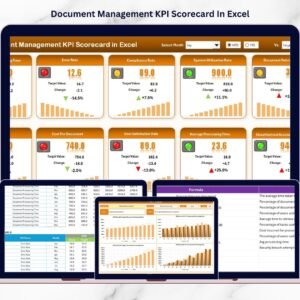
Dashboard Sheet: Displays MTD & YTD data with visual comparisons.
KPI Trend Sheet: Track trends with graphs for MTD and YTD.
Actual Numbers Input Sheet: Easily input actual monthly data.
Target Sheet: Set monthly and yearly targets for each KPI.
Previous Year Numbers: Compare data with previous year’s performance.
KPI Definition Sheet: Define each KPI’s group, formula, and unit for clarity.
User-Friendly Design: Navigate effortlessly with drop-down menus for month selection.
Year-over-Year Comparison: Analyze historical data to track progress.
Real-Time Updates: Instantly see the impact of input data changes on the dashboard.
Have your own data? Build a dashboard from your Excel, CSV or Google Sheets file free in Dashboard Studio →
Excel Pivot Tables & Dashboards: Basic to Advanced
From your first Pivot Table to the Data Model, DAX, Power Query and a one-page KPI dashboard. 11h 51m of video by PK, with practice files, quizzes and a capstone.
The Document Management KPI Dashboard in Excel is a powerful tool designed to help organizations track and optimize their document management processes. This easy-to-use Excel dashboard gives you an insightful overview of key performance indicators (KPIs) related to document management, making it easier to monitor efficiency, accuracy, cost, and user satisfaction in your operations. It provides a detailed, data-driven approach to assessing document handling and can help improve workflows, reduce errors, and enhance the overall document management system within your business.
Key Features of the Document Management KPI Dashboard
The Document Management KPI Dashboard comes with several functional sheets, each serving a distinct purpose. This ensures that all the relevant aspects of document management are covered, while offering a streamlined, organized method for tracking performance over time.
1. Home Sheet – Centralized Access for Ease of Use
The Home Sheet acts as the command center of the dashboard. This sheet includes six simple navigation buttons that allow users to quickly jump to specific sections, such as the Dashboard, KPI Trend Sheet, and other sheets that provide detailed insights into your document management performance. With this user-friendly design, you can easily navigate through different views and data points without any hassle.
2. Dashboard Sheet – Real-Time Overview of KPIs
The Dashboard Sheet is the heart of the Document Management KPI Dashboard. Here, you can see a high-level overview of your KPIs, including Month-to-Date (MTD) and Year-to-Date (YTD) actual data, targets, and comparisons with previous years. The dashboard includes intuitive charts that highlight areas of performance that need attention, with the use of color-coded indicators (green for good performance, yellow for caution, and red for poor performance). This visual representation allows quick and easy analysis at a glance, making it easier to identify trends and take corrective actions when necessary.
Document Management
3. KPI Trend Sheet – Track Trends Over Time
The KPI Trend Sheet allows users to analyze the trends of key performance indicators over time. With drop-down menus, you can select the KPI you want to track, and it will generate graphs for both MTD and YTD data, providing a clear understanding of how your document management processes have evolved. This feature helps highlight improvements or deterioration in performance, allowing you to make data-driven decisions to optimize the workflow.
4. Actual Numbers Input Sheet – Simple and Quick Data Input
The Actual Numbers Input Sheet makes it easy to input the actual values for your KPIs on a monthly basis. With this sheet, you can simply enter the real data and instantly see how it compares to your targets and previous year’s performance. This feature helps ensure your team stays on track and can continuously monitor performance, updating it on a regular basis to maintain an up-to-date record of your key metrics.
5. Target Sheet – Set Clear Performance Goals
The Target Sheet allows you to set specific targets for each KPI. Whether monthly or yearly, the targets can be adjusted easily, providing clarity on your performance goals. This sheet helps businesses keep their document management team aligned with organizational objectives, ensuring a standard of excellence in processing, retrieval, accuracy, cost efficiency, and customer satisfaction.
6. Previous Year Numbers Sheet – Historical Performance Comparison
The Previous Year Numbers Sheet provides a space to input data from the previous year for comparison. By including past performance data, you can identify long-term trends, gauge improvements or regressions, and use this historical context to forecast and plan future improvements. This sheet is critical for businesses looking to track year-over-year performance and ensure that continuous improvement is taking place.
7. KPI Definition Sheet – Define Key Metrics for Clarity
The KPI Definition Sheet is where you can define each KPI. Here, you will find essential information such as the KPI name, group, unit, formula, and a detailed description. This ensures consistency in tracking and analyzing KPIs, particularly for teams who might be new to the process or those who need a refresher on the definitions and formulas behind each metric. By having all the information in one place, you avoid confusion and ensure that everyone in the organization understands the performance metrics being tracked.
8. Easy Customization for Different Document Management Needs
The Document Management KPI Dashboard is highly customizable to fit the unique needs of your organization. Whether you’re tracking document retrieval times, system utilization rates, or cost per document, you can adjust the dashboard to track the specific KPIs that matter most to your operations. The ability to easily add or remove KPIs makes this tool flexible for any type of document management system.
9. Visual Comparisons and Conditional Formatting for Quick Insights
The dashboard comes equipped with conditional formatting, making it simple to interpret the data quickly. Performance indicators such as actual vs. target values are highlighted using arrows and color coding, offering a visual representation of your performance. These visual comparisons allow you to assess the health of your document management processes at a glance and make timely decisions based on the data.
10. Helps Drive Efficiency and Improve Document Management
By using the Document Management KPI Dashboard, you gain the ability to continuously track, measure, and improve your document management workflows. This tool will help identify bottlenecks, inefficiencies, and areas where improvements can be made, ultimately driving cost savings, improving document retrieval times, enhancing user satisfaction, and ensuring better compliance with standards.
Why Choose the Document Management KPI Dashboard?
In today’s data-driven world, being able to track and optimize document management is crucial to maintaining an efficient operation. This Document Management KPI Dashboard allows businesses to stay ahead of the curve by providing real-time, actionable insights into the key processes that drive your organization’s document handling efficiency. Whether you’re aiming to improve compliance, enhance accuracy, or reduce processing times, this dashboard serves as a comprehensive tool for managing and improving all aspects of document management.
With its user-friendly interface, customizable KPIs, and detailed reporting features, the Document Management KPI Dashboard in Excel ensures that you are always in control of your document management performance. By implementing this dashboard, your business can not only achieve efficiency but also gain a competitive edge in the market.
Open the KPI Definition sheet and enter each KPI’s name, group, unit, formula and description.
Enter your monthly or yearly goals for each KPI in the Target sheet.
Add last year’s figures in the Previous Year Numbers sheet so the dashboard can compare years.
Enter actual values each month in the Actual Numbers Input sheet.
Open the Dashboard sheet to see MTD and YTD actuals against targets and previous year, with color-coded arrows.
Use the drop-down on the KPI Trend sheet to pick a KPI and view its MTD and YTD charts.
Who Can Use This Dashboard
Records managers, document control teams, office and operations managers, and compliance staff can use it to report on document retrieval times, processing accuracy, cost per document and user satisfaction each month.
Compatibility and Requirements
Works in Microsoft Excel desktop (Excel 2016 or later, or Microsoft 365).
Seven: Home, Dashboard, KPI Trend, Actual Numbers Input, Target, Previous Year Numbers and KPI Definition. The Home sheet has navigation buttons to the other sheets.
Can I track my own document KPIs?
Yes. You can add or remove KPIs, such as document retrieval time, system utilization rate or cost per document, and define each one on the KPI Definition sheet.
How does it show good and poor results?
Conditional formatting colors each KPI green, yellow or red and adds arrows that compare actual values with targets.
Does it compare this year with last year?
Yes. Figures entered in the Previous Year Numbers sheet appear next to the current MTD and YTD values on the Dashboard.
Microsoft Excel 2016 or later on desktop (Microsoft 365 recommended). Many of our formula templates also open in Excel 2013 and Excel for the web - the exact requirement is listed in this product's description.
Does it work on Mac?
Yes. Formula-based Excel templates (no macros) work in Excel for Mac 2016 or later.
Does it work on mobile or Excel Online?
You can view it in the Excel mobile app and Excel for the web, but for entering data, using slicers and refreshing pivots we recommend desktop Excel.
How do I add my own data?
Replace the sample rows on the data sheet with your own (keep the column headers), then click Data > Refresh All so every chart and pivot updates.
Some sheets are protected - how do I edit them or change the logo?
A few of our trackers, data entry systems and dashboards protect sheets so formulas are not overwritten by mistake. Go to Review > Unprotect Sheet - most have no password. If Excel asks for one, message us with your order number and we will share it straight away.
How many records can it handle?
It has been tested with several thousand rows and suits normal small-business volumes. Excel itself handles over 1 million rows.
Is it a one-time payment or a subscription?
One-time payment. No subscription, no per-user fees and nothing to renew - the file is yours to keep.
How do I get the file after payment?
Instantly. The download link appears on screen after checkout, is emailed to you, and stays under My Account > Downloads on our website. If the email does not arrive within a few minutes, check your spam or promotions folder.
Is a user manual included?
Most of our newer products include a PDF user manual in the download. If yours does not have one, message us with your order number and we will send it.
Do I get free updates?
Bug fixes are always free - if something does not work as described, we fix it and send you the corrected file. New versions with new features are not included in the price, unless this product's description says otherwise.
Can you customise it for me?
Yes. Small changes to this template (your columns, categories, logo, colours, minor layout) cost the template price plus $40-80 (Rs 3,000-6,000 + GST), quoted once you send your list. A fully custom build is usually $100-200 (Rs 8,000-18,000 + GST) with two revision rounds. Email your requirements to [email protected] or message us on WhatsApp.
Can I use it for my business or my clients?
Yes, for your own personal or internal business use, for as long as you like. Reselling or redistributing the template is not allowed.
What is your refund policy?
Because these are digital downloads, they are non-refundable once delivered - except when the product does not match its description (report it within 48 hours of purchase) or there is a technical problem our team cannot fix within 72 hours. Email [email protected] with your order number.
How do I get help?
Email [email protected] (Mon-Fri, 10 AM-7 PM IST) or message us on WhatsApp +91 80770 90260 (chat only, no calls). Please include your order number.
Still have a question? Click Need help? at the bottom-left to ask our assistant, or message us on WhatsApp.
Application
MS Excel
Template Type
KPI Dashboard
Price
Paid
Business Or Department
Operations Management
Reviews
There are no reviews yet.
Only logged in customers who have purchased this product may leave a review.

































Reviews
There are no reviews yet.