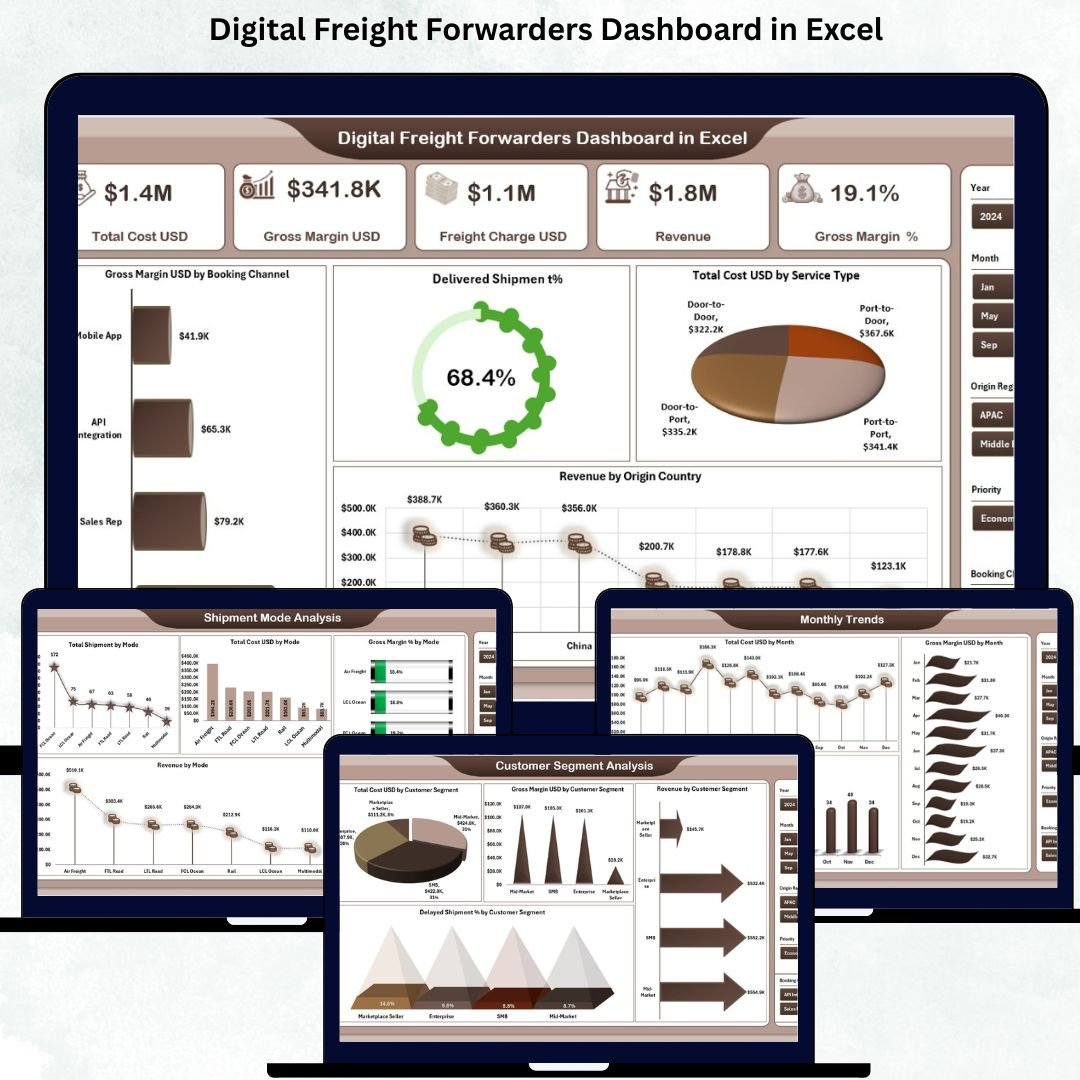
The freight forwarding industry operates at high speed—with complex routes, rising expectations, unpredictable delays, and tight margins. To stay competitive, logistics companies must monitor cost, revenue, margin, customer segments, and delivery performance instantly. A traditional spreadsheet cannot provide this clarity. That’s why logistics teams now rely on the Digital Freight Forwarders Dashboard in Excel, a ready-to-use analytical solution that transforms raw freight data into powerful business insights.
This dashboard brings all your operational and financial KPIs into one clean interface. Digital Freight Forwarders Dashboard in Excel It helps users track total cost, revenue, freight charges, gross margin, shipments, delays, customer behavior, mode performance, and monthly patterns with just a few clicks. Because it runs 100% inside Excel, you enjoy flexibility, ease of use, transparency, and a familiar working environment—without investing in costly BI tools.
Whether you’re a freight forwarder, logistics manager, operations head, analyst, or founder, this dashboard gives you complete control over performance and helps you take smarter, faster decisions.
✨ Key Features of the Digital Freight Forwarders Dashboard in Excel
📊 Instant Visibility of All Freight KPIs
Track total cost, revenue, gross margin, freight charges, delayed shipment percentage, duty & tax, surcharges, and more—everything updates automatically.
🚚 Shipment Performance Insights
Analyze delivery efficiency, understand mode-wise behavior (Air, Sea, Road, Rail), and uncover delivery delays instantly.
💰 Deep Financial Analysis
View cost vs. revenue vs. gross margin clearly using KPI cards, allowing teams to evaluate profitability at every level.
👥 Customer Segment Understanding
Identify high-profit customer groups, spot risky segments, and compare revenue distribution across customer categories.
🧭 Left-Side Page Navigator
Switch between pages instantly without searching for sheet tabs.
📈 Monthly Trend Intelligence
Understand seasonal changes, shipment fluctuations, rising costs, and margin improvements over time.
💡 Excel-Based Simplicity
No complex setup—just paste your data in the Data Sheet and the dashboard updates automatically.
📦 What’s Inside the Digital Freight Forwarders Dashboard in Excel
This dashboard contains 5 powerful analytical pages, plus supportive backend sheets.
✔ 1. Overview Page – Complete Freight Performance Snapshot
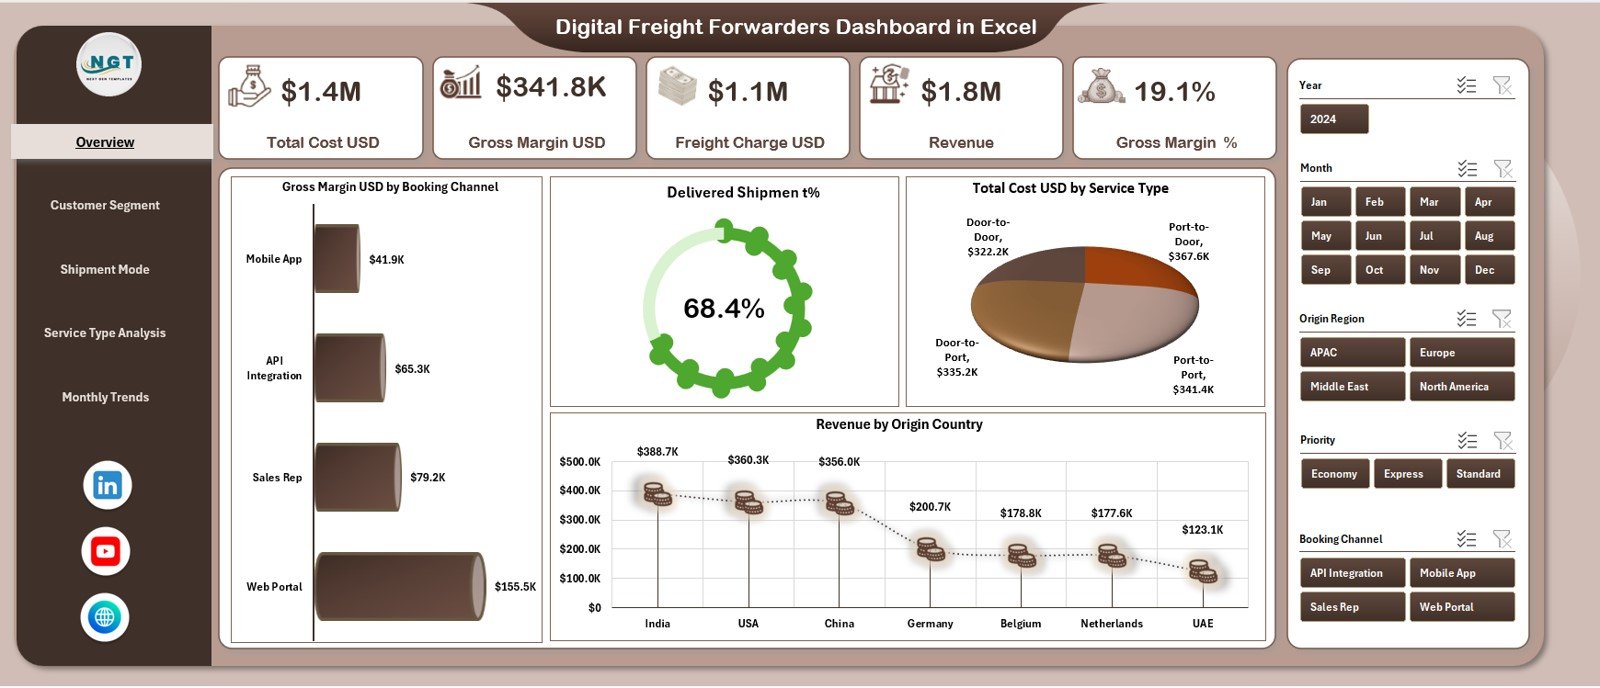
The Overview Page displays the most important KPIs through five summary cards:
-
Total Cost (USD)
-
Revenue (USD)
-
Freight Charge (USD)
-
Gross Margin (USD)
-
Gross Margin %
You also get four high-impact charts:
-
Gross Margin USD by Booking Channel
-
Delivered Shipment %
-
Total Cost USD by Service Type
-
Revenue by Origin Country
This page gives a complete picture of financial and operational performance.
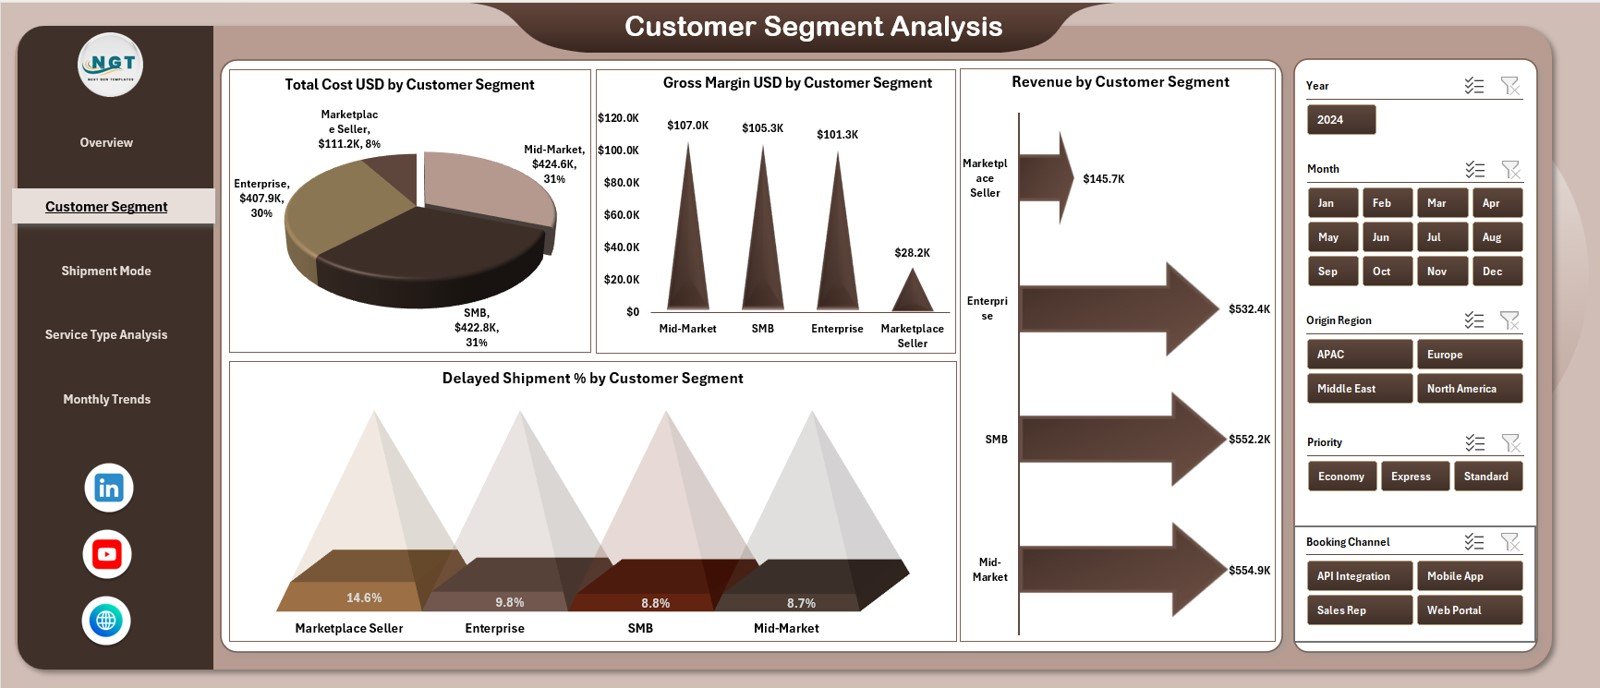
✔ 2. Customer Segment Analysis – Identify Profitable Customers
This page breaks down customer behavior and profitability through:
-
Total Cost USD by Customer Segment
-
Gross Margin USD by Customer Segment
-
Revenue by Customer Segment
-
Delayed Shipment % by Customer Segment
You instantly learn which customers drive profits or require operational attention.
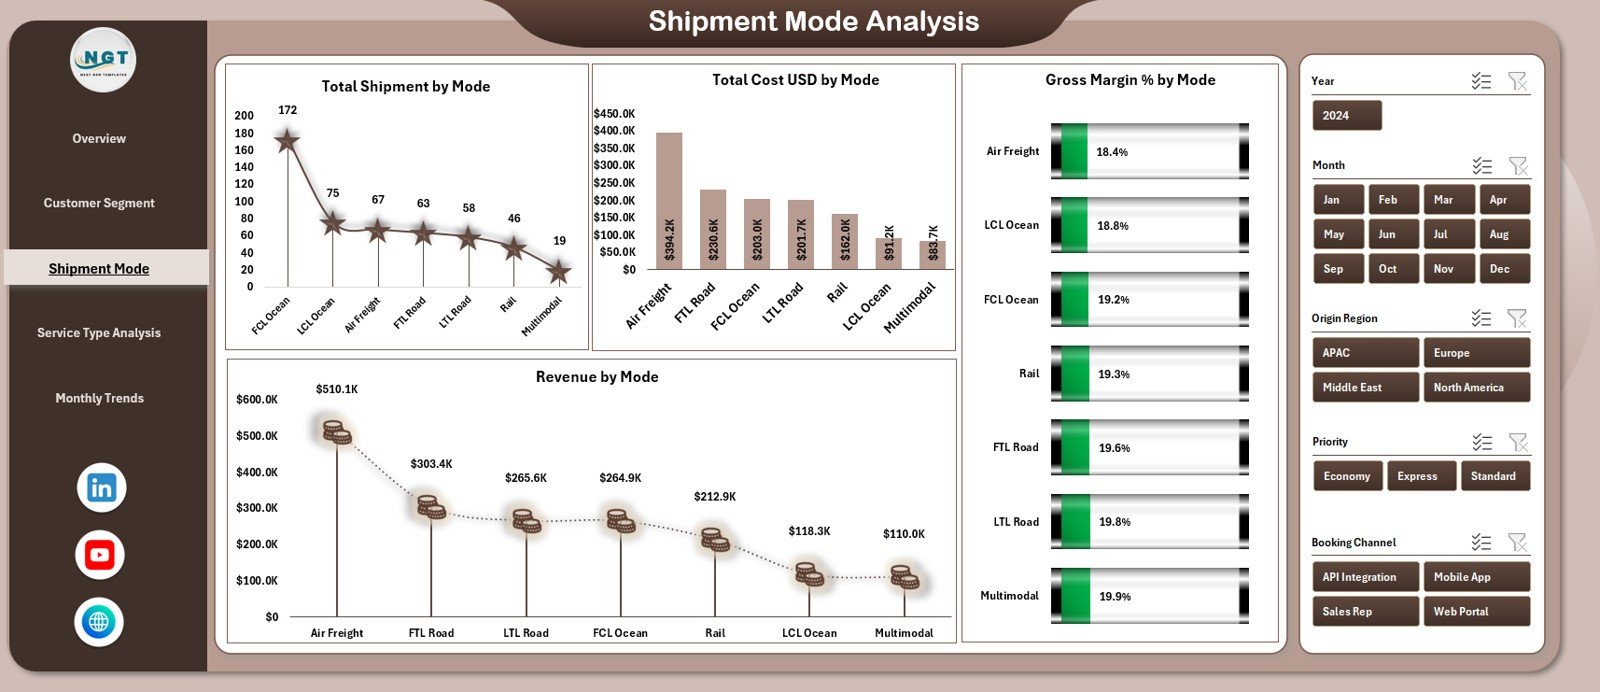
✔ 3. Shipment Mode Analysis – Compare All Transport Modes
Freight companies use multiple modes, each with unique cost and margin behavior. This page shows:
-
Total Shipments by Mode
-
Revenue by Mode
-
Total Cost USD by Mode
-
Gross Margin % by Mode
Perfect for optimizing routing and pricing strategies.
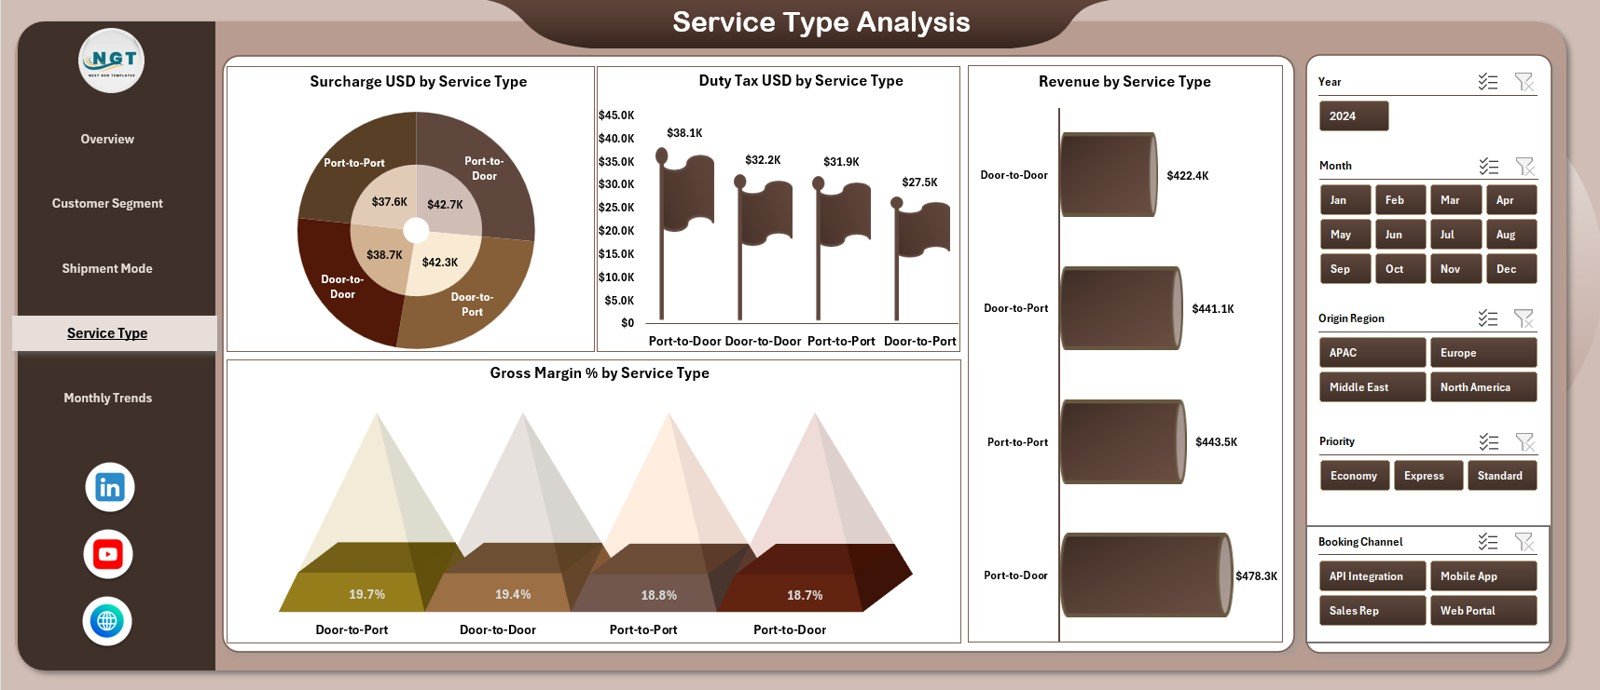
✔ 4. Service Type Analysis – Monitor All Logistics Services
Track the performance of standard, express, customs handling, warehousing, and other service types using:
-
Revenue by Service Type
-
Surcharge USD by Service Type
-
Duty & Tax USD by Service Type
-
Gross Margin % by Service Type
Perfect for understanding which services need cost control or improved pricing.
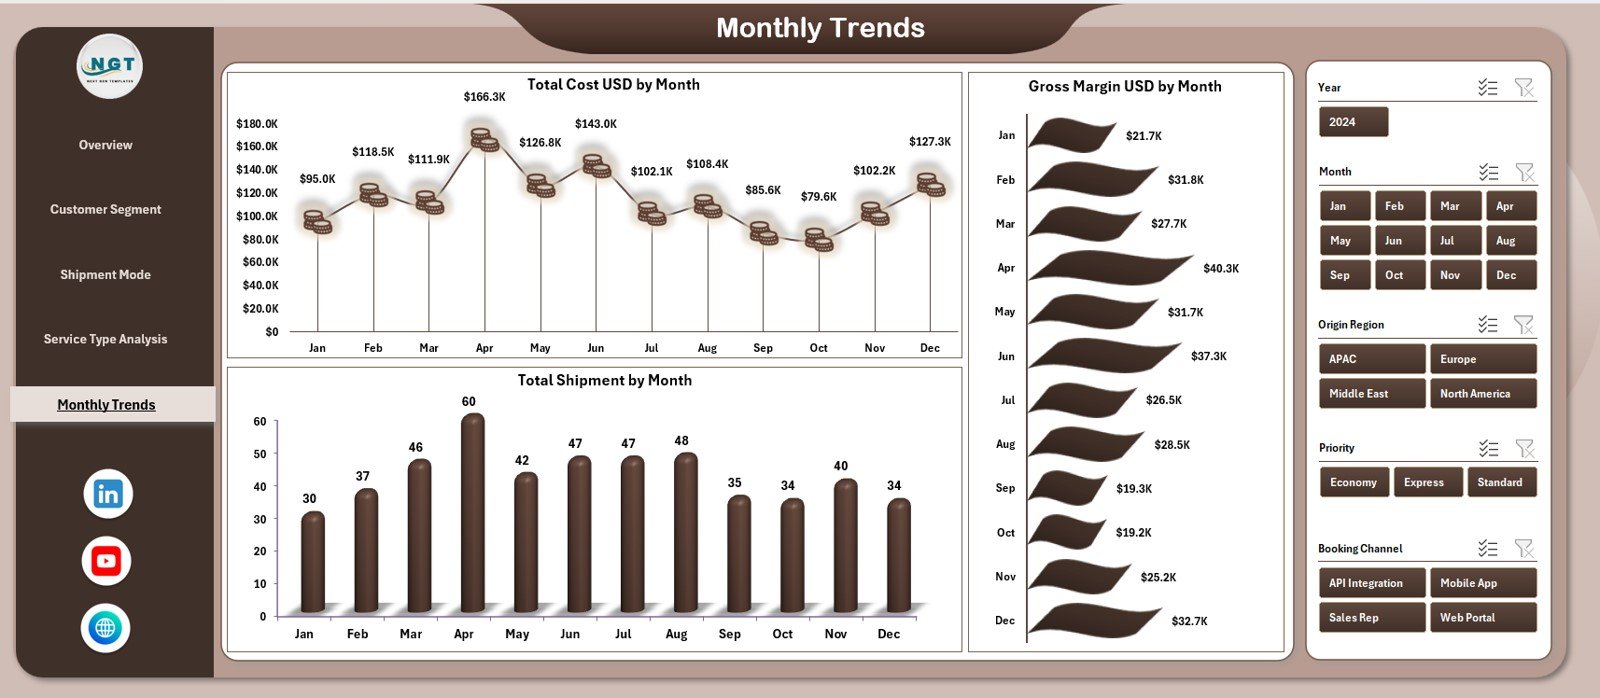
✔ 5. Monthly Trends – Analyze Business Movement Over Time
Monthly fluctuations show growth opportunities and risk periods.
Charts include:
-
Total Cost USD by Month
-
Gross Margin USD by Month
-
Total Shipment by Month
Ideal for forecasting and capacity planning.
🛠 How to Use the Digital Freight Forwarders Dashboard in Excel
Using this dashboard is extremely simple:
1️⃣ Paste raw data into the Data Sheet
2️⃣ Select slicers on each dashboard page
3️⃣ Analyze charts and KPI cards
4️⃣ Compare customer, mode, service type, and monthly trends
5️⃣ Use insights for pricing, routing, staffing, and budgeting
No formulas or technical changes required.
👥 Who Can Benefit from This Dashboard
This dashboard is best suited for:
🚛 Freight forwarders
📦 Logistics companies
✈ Air & sea cargo operators
📍 3PL and 4PL providers
📊 Analysts & finance teams
🏢 Logistics tech startups
🌍 Global shipping coordinators
Anyone who needs visibility into freight cost, revenue, and shipment performance will benefit.


Reviews
There are no reviews yet.