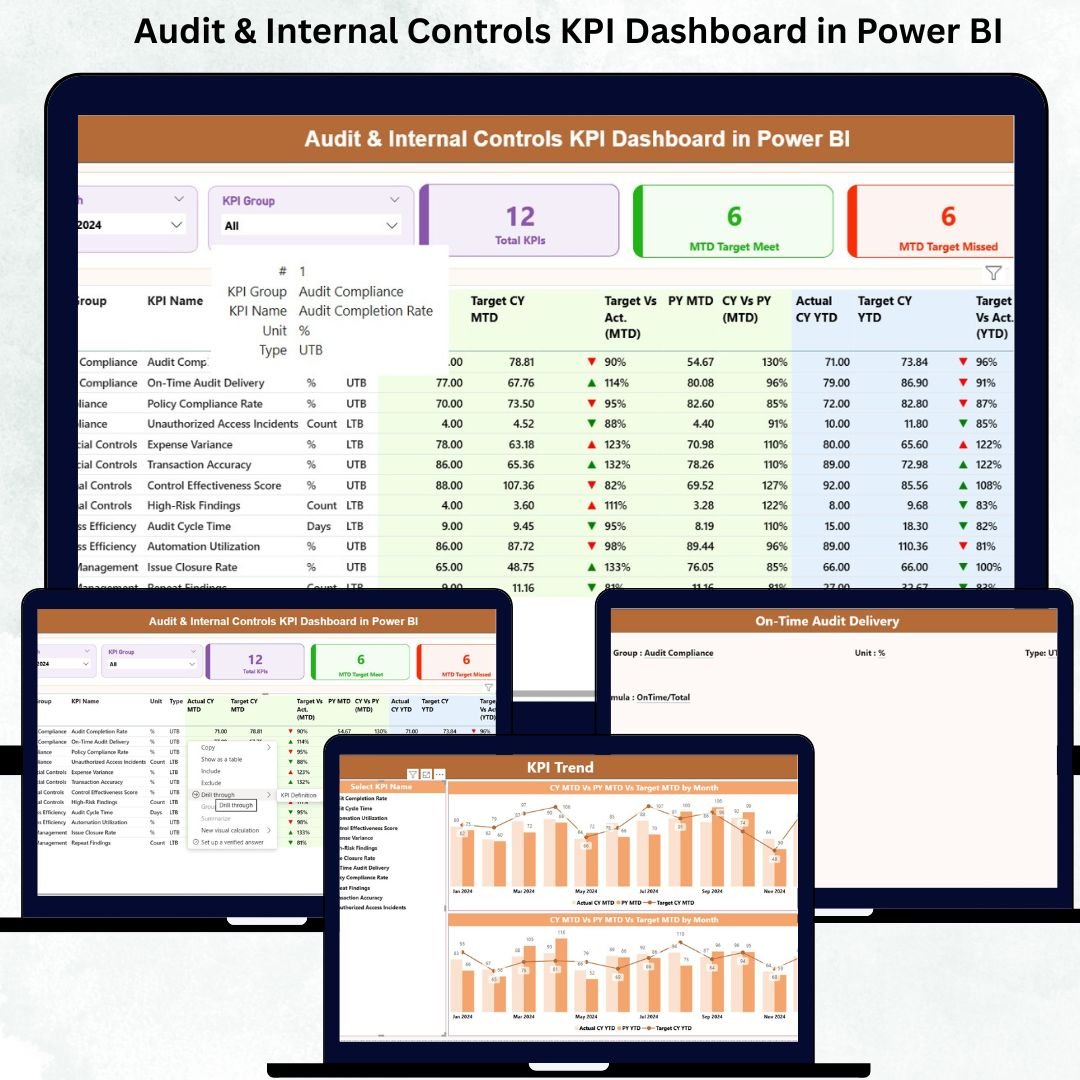
The Audit & Internal Controls KPI Dashboard in Power BI is a comprehensive, ready-to-use digital solution designed to help organizations monitor, manage, and improve audit and internal control processes efficiently. In today’s fast-paced business world, ensuring compliance, managing risks, and maintaining robust internal controls are more critical than ever. This dashboard provides real-time insights, interactive visualizations, and actionable data to empower audit teams, management, and compliance officers to make informed decisions with confidence.Audit & Internal Controls KPI Dashboard in Power BI
Key Features of Audit & Internal Controls KPI Dashboard in Power BI 📊
-
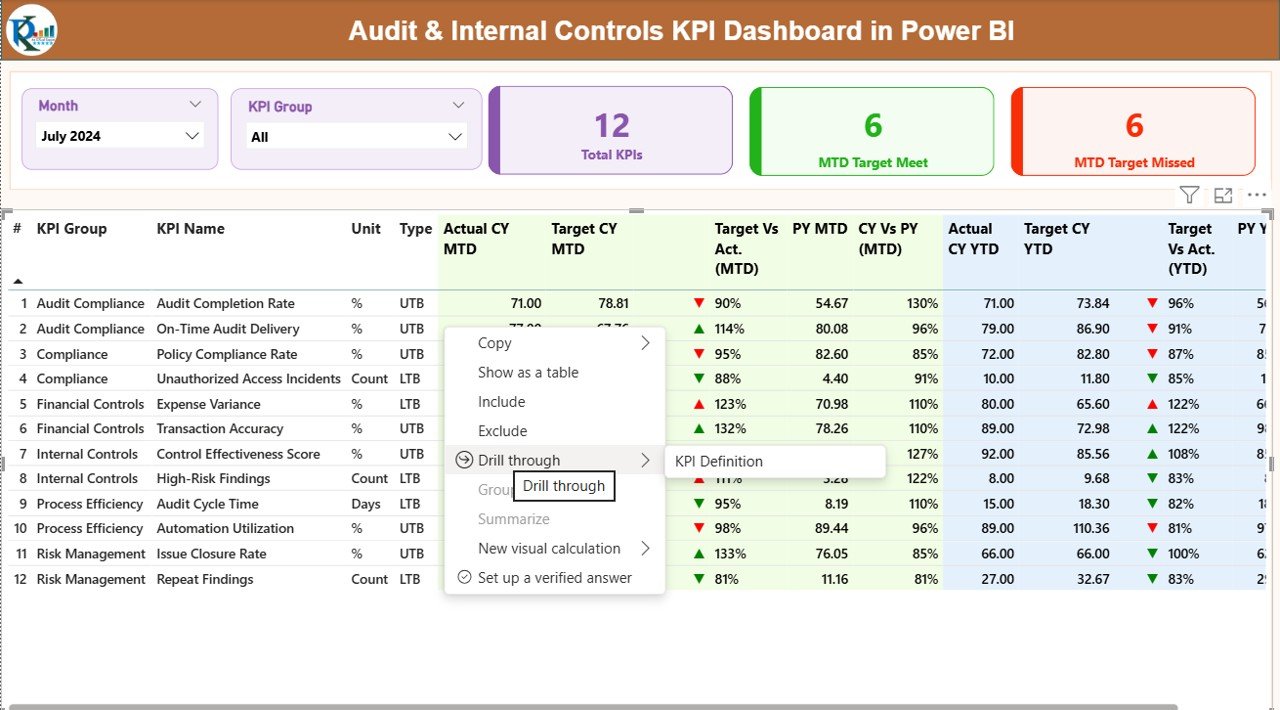
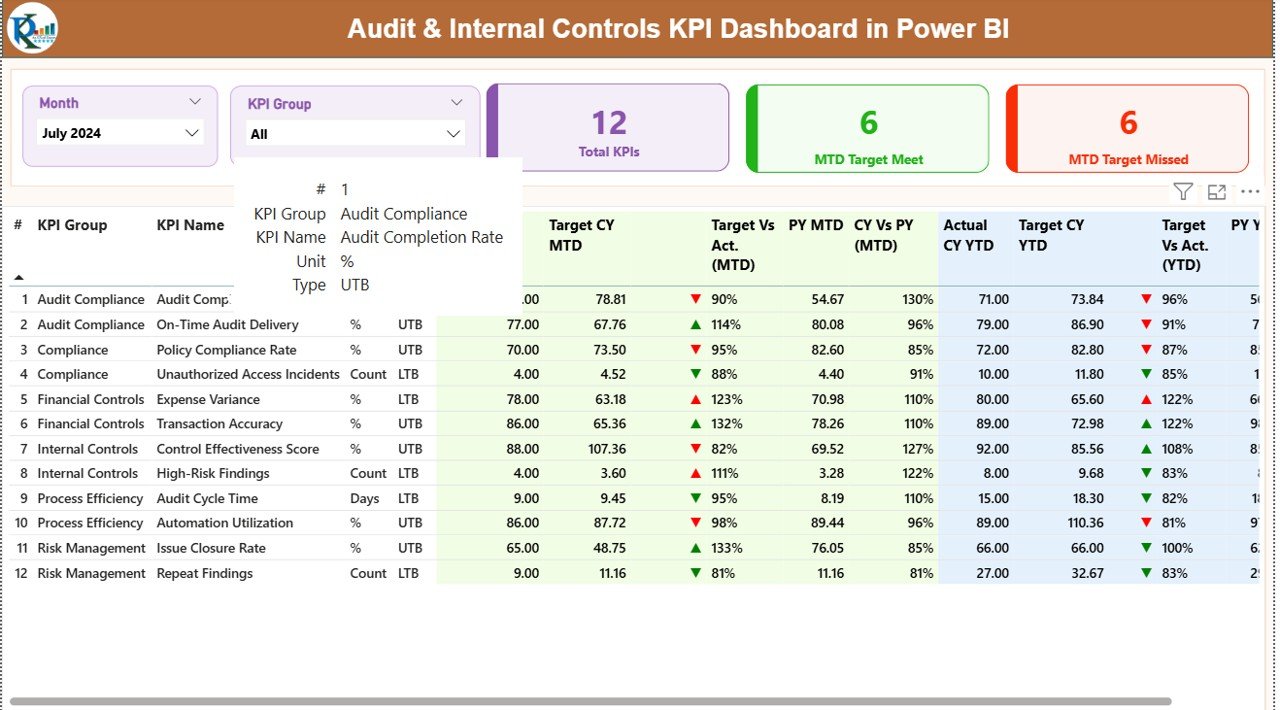
Summary Page: The central hub provides quick insights with slicers to filter KPIs by month or category. Key metrics like total KPIs, MTD target met, and MTD target missed are displayed in easy-to-read cards, while detailed KPI tables track actual vs target performance both MTD and YTD.
-
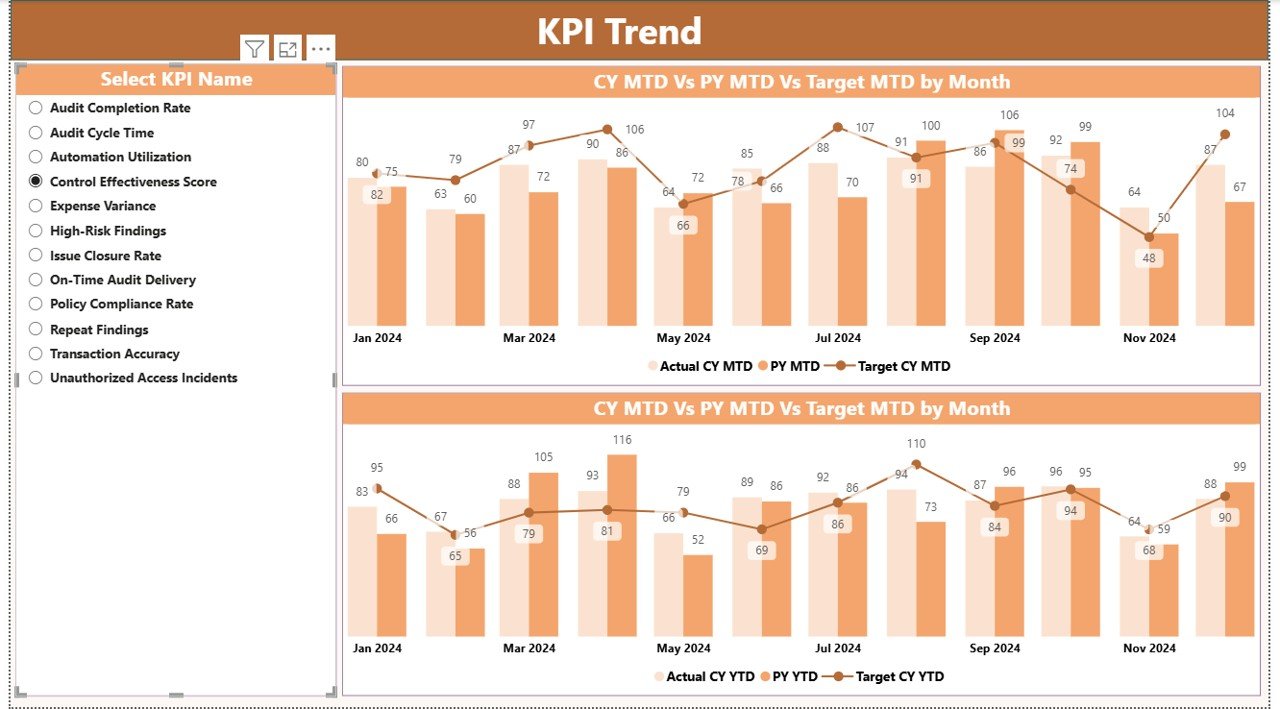
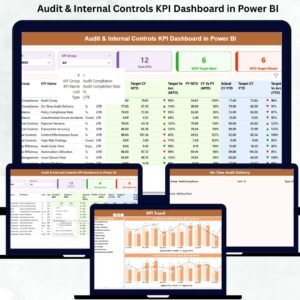
KPI Trend Page: Visualize trends over time with combo charts comparing current year, previous year, and targets. Use KPI name slicers to focus on specific metrics for better planning and forecasting.Audit & Internal Controls KPI Dashboard in Power BI
-
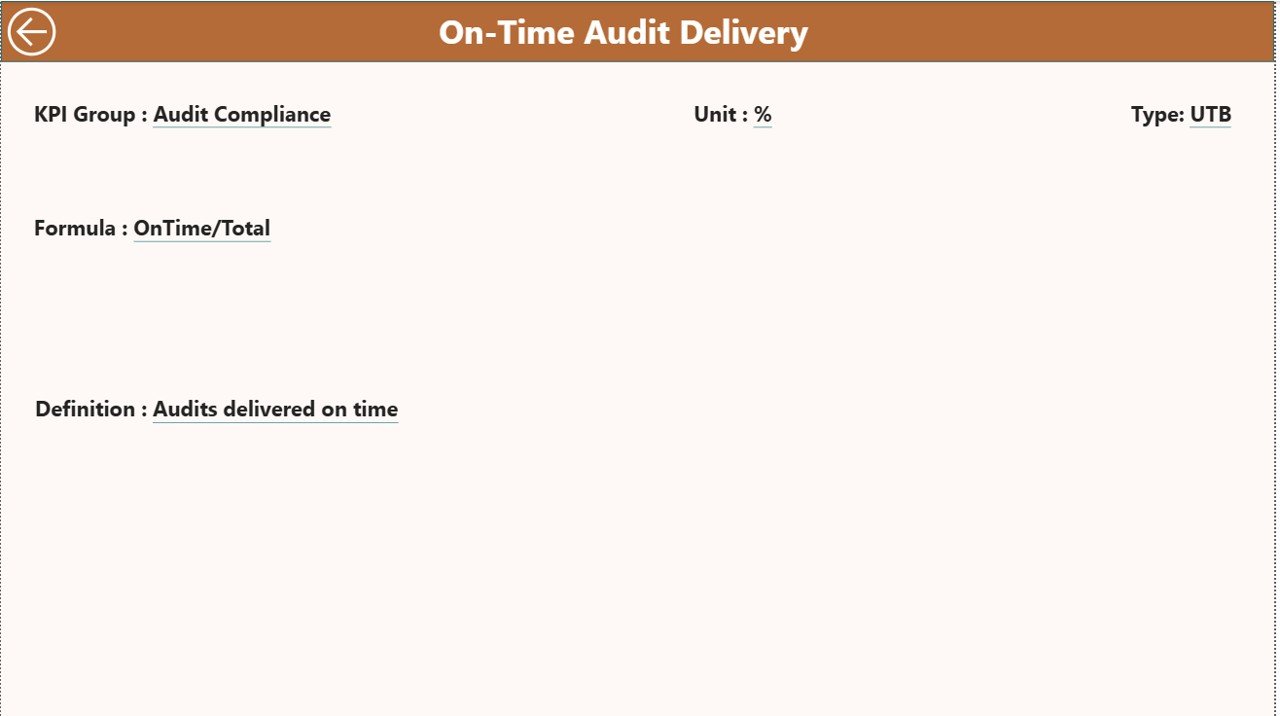
KPI Definition Page: Ensures consistent KPI interpretation across teams. Contains detailed definitions, formulas, units, and type (LTB/UTB) for each KPI.
-
Excel-Driven Data Source: Easily update KPI numbers in Excel sheets, and Power BI refreshes automatically to provide real-time insights.
-
Automation & Collaboration: Share dashboards securely with stakeholders, schedule automatic refreshes, and maintain transparency across teams.
What’s Inside the Audit & Internal Controls KPI Dashboard 📂
-
Input_Actual Sheet: Track monthly and YTD actual KPI values.
-
Input_Target Sheet: Enter KPI targets to measure performance accurately.
-
KPI Definition Sheet: Standardize KPI calculations and definitions.Audit & Internal Controls KPI Dashboard in Power BI
-
Interactive Summary Page: Quick overview with cards, tables, and slicers.
-
Trend Analysis Page: Visual comparison of current vs previous year performance.
-
Drill-through KPI Definition Page: In-depth insights into each KPI.
How to Use the Audit & Internal Controls KPI Dashboard 🛠️
-
Collect KPI Data: Gather historical and current KPI data from all departments.
-
Update Excel Sheets: Fill in actual, target, and KPI definitions in the provided Excel file.
-
Load Data into Power BI: Connect Excel as a data source and verify all fields.
-
Configure Summary & Trend Pages: Set slicers, cards, and combo charts for interactive analysis.
-
Use Drill-Through Pages: Explore detailed KPI definitions for accurate interpretation.
-
Validate Dashboard: Ensure MTD/YTD calculations and metrics are accurate.
-
Share & Monitor: Publish dashboards, set refresh schedules, and collaborate with stakeholders.
Who Can Benefit from This Audit & Internal Controls KPI Dashboard 🎯
-
Audit Teams: Streamline audit planning, execution, and reporting.
-
Management: Make informed, data-driven decisions for risk management and operational efficiency.
-
Compliance Officers: Monitor adherence to policies and regulatory requirements effectively.
-
Board of Directors: Gain transparency into audit results, control effectiveness, and high-risk issues.
Why Choose This Dashboard?
-
Improved Audit Efficiency: Centralized KPI tracking reduces manual effort.
-
Real-Time Insights: Always stay updated with the latest data.
-
Enhanced Decision-Making: Identify gaps and trends to act proactively.
-
Simplified Reporting: Replace complex spreadsheets with visually appealing dashboards.
-
Increased Accountability: Teams take ownership with clear KPI metrics.
Click here to read the Detailed blog post 📝
Watch the step-by-step video tutorial:


Reviews
There are no reviews yet.