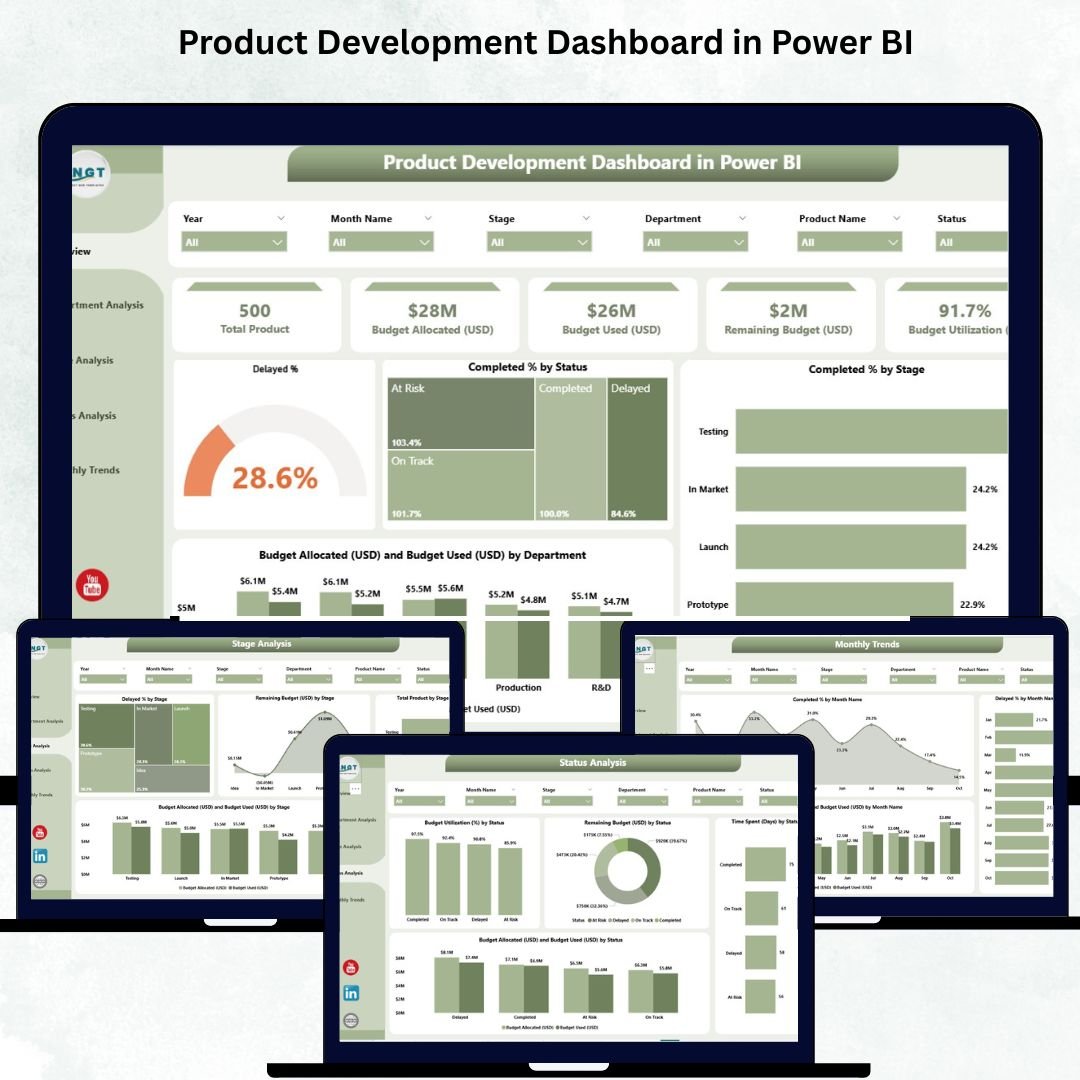
The Product Development Dashboard in Power BI is a game-changing analytics solution designed for organizations that want to accelerate innovation, improve efficiency, and manage projects smarter. In a world where speed and precision define success, this dashboard brings real-time visibility to your entire product lifecycle — from concept to launch.
Built in Microsoft Power BI, it connects seamlessly with Excel data sources to provide a dynamic, interactive, and data-driven overview of product progress, budgets, and departmental performance. Whether you oversee R&D, production, or marketing, this dashboard helps teams stay on schedule, within budget, and aligned with strategic goals.
✨ Key Features of the Product Development Dashboard in Power BI
✅ 📊 Overview Page – Complete Project Snapshot
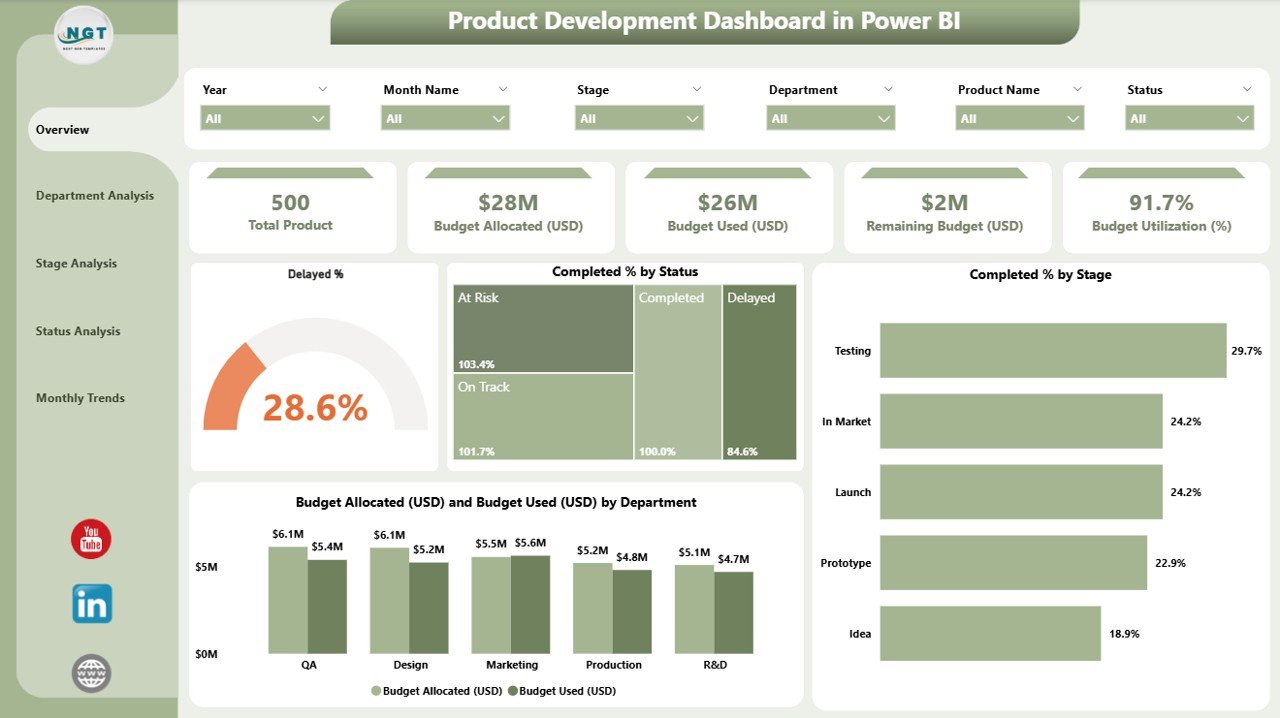
Get an at-a-glance summary of all active projects with interactive visuals.
Includes five key performance cards:
-
Delayed Percentage (%)
-
Completed Percentage (%)
-
Total Projects
-
Budget Allocated (USD)
-
Budget Used (USD)
Charts Displayed:
-
Delayed % by Status
-
Completed % by Stage
-
Budget Allocated vs. Budget Used by Department
-
Project Distribution by Status
💡 Perfect for executives and managers who need quick insights into development efficiency and cost control.
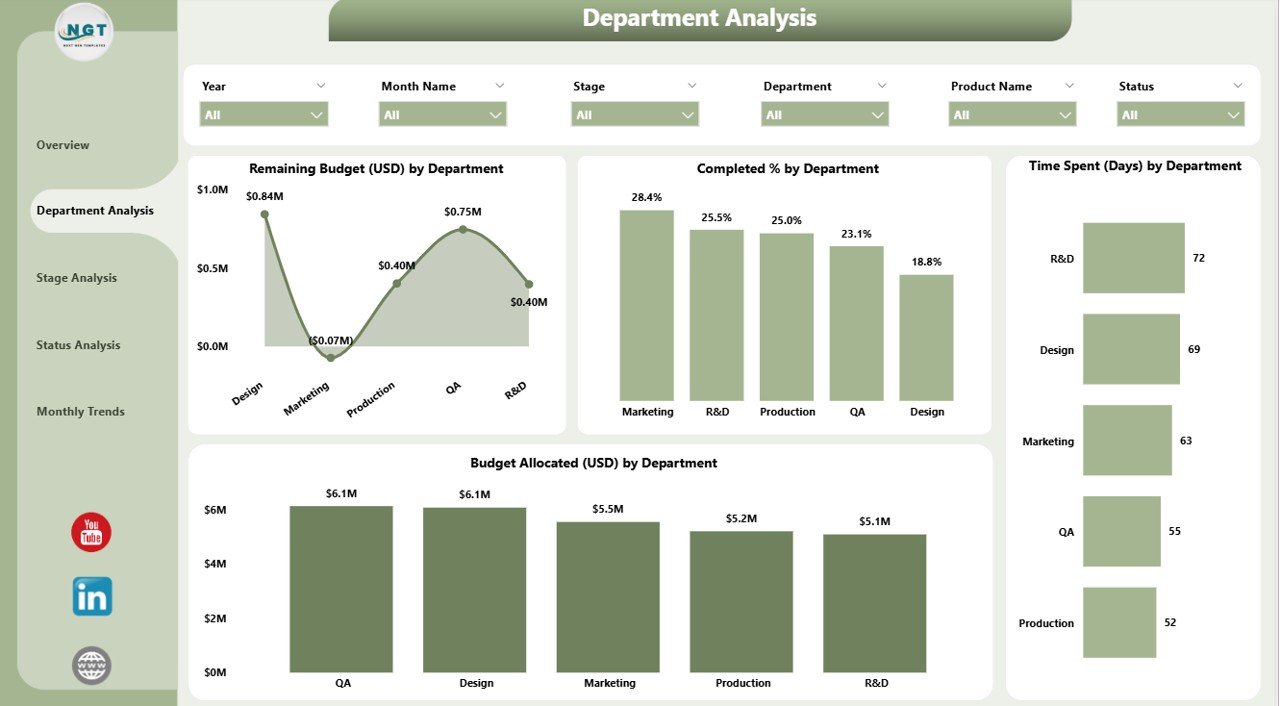
✅ 🏢 Department Analysis Page – Compare Department Performance
Understand how different departments perform in terms of time, cost, and outcomes.
Visuals include:
-
Remaining Budget (USD) by Department
-
Completed % by Department
-
Time Spent (Days) by Department
-
Budget Allocation (USD) by Department
📈 Identify departments excelling in delivery and spot areas of overspending or inefficiency instantly.
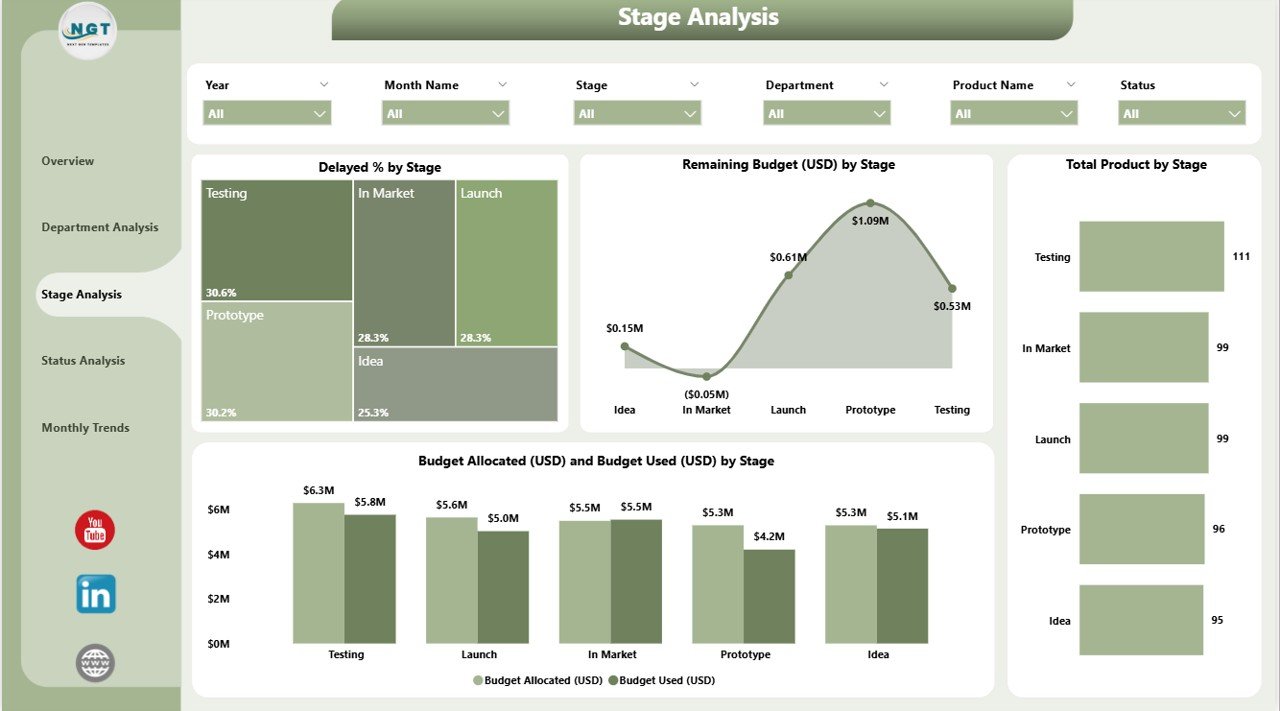
✅ 🧩 Stage Analysis Page – Track Each Development Phase
Monitor product performance through every development stage — from idea to launch.
Charts include:
-
Delayed % by Stage
-
Remaining Budget (USD) by Stage
-
Total Products by Stage
-
Budget Used (USD) by Stage
⚙️ Pinpoint where bottlenecks occur and allocate resources efficiently across stages.
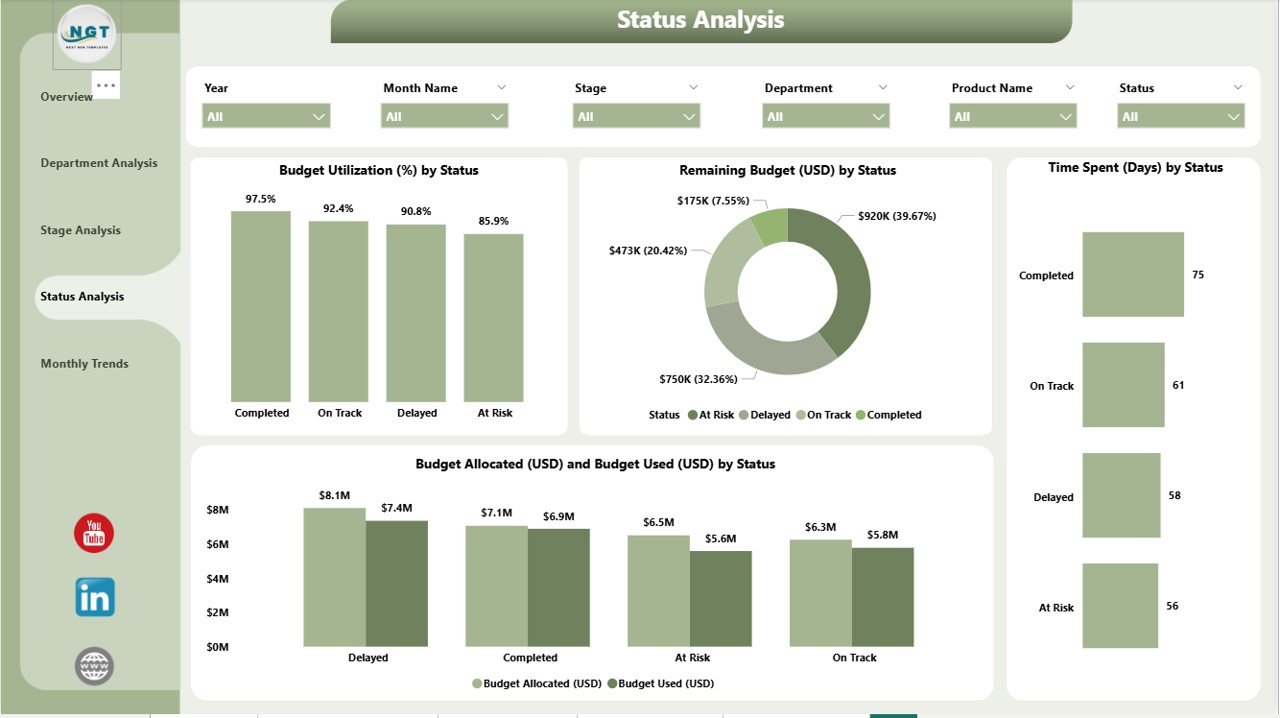
✅ 📌 Status Analysis Page – Monitor Real-Time Progress
Analyze projects based on their current status (In Progress, Completed, Delayed, Pending Approval).
Visuals include:
-
Budget Utilization (%) by Stage
-
Remaining Budget (USD) by Status
-
Time Spent (Days) by Status
-
Budget Allocated vs. Budget Used (USD) by Stage
🧭 Detect risks early and make informed adjustments to keep every project on track.
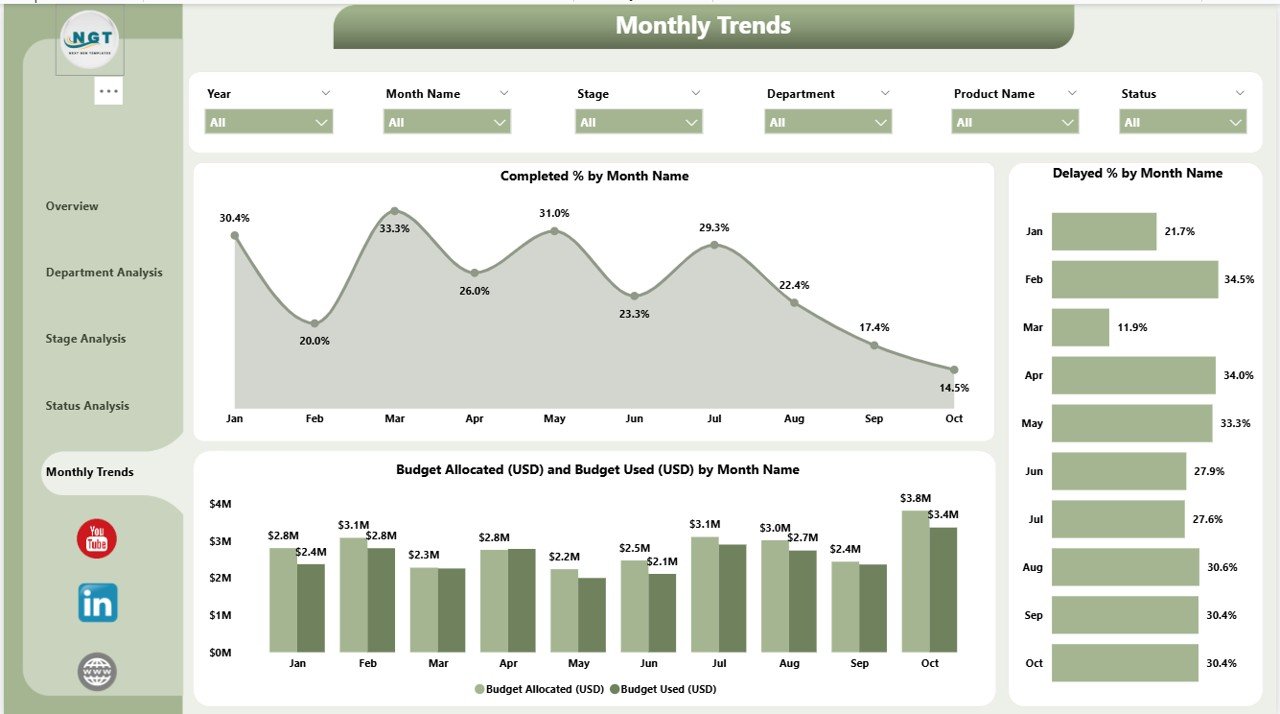
✅ 📅 Monthly Trends Page – Time-Based Performance Overview
Track month-over-month trends to understand productivity, efficiency, and cost movement.
Charts include:
-
Completed % by Month
-
Delayed % by Month
-
Budget Allocated vs. Budget Used (USD) by Month
📆 Use trend analysis to forecast upcoming project needs, optimize schedules, and balance budgets.
📦 What’s Inside the Dashboard
📁 Power BI (.PBIX) File – Fully interactive dashboard with filters and slicers.
📊 Excel Data Source File – Cleanly structured with project, budget, and status details.
⚙️ Auto-Refresh Setup – Just update your Excel file, and the visuals refresh automatically.
💡 No complex setup needed — plug in your data and start monitoring instantly!
👥 Who Can Benefit from This Dashboard
🏢 Product Managers – Gain total visibility over project timelines and costs.
💼 R&D Teams – Track innovation projects and resource usage.
🏭 Manufacturing Units – Analyze production stages and efficiency.
💰 Finance Teams – Control budget allocation and monitor spending.
📊 Executives & Stakeholders – Get strategic insights through visual summaries.
💡 Advantages of the Product Development Dashboard in Power BI
✅ Centralized Data Visibility – Access all key metrics from one dashboard.
✅ Real-Time Insights – Track projects as they evolve with automatic updates.
✅ Enhanced Collaboration – Ensure all departments work from the same dataset.
✅ Smarter Budget Control – Compare allocated vs. used budgets instantly.
✅ Improved Time Management – Identify and resolve delays proactively.
✅ Customizable & Scalable – Tailor KPIs and visuals to your business needs.
⚡ Turn your product development process into a transparent, data-driven workflow.
🧠 Best Practices for Using the Dashboard
✔️ Keep your Excel dataset clean and updated.
✔️ Use slicers to filter data by department, stage, or project status.
✔️ Set up scheduled data refreshes for real-time insights.
✔️ Highlight critical KPIs with conditional formatting.
✔️ Share your Power BI report securely via Power BI Service.
These practices ensure consistent, reliable, and actionable insights from your dashboard.
🔗 Click here to read the Detailed Blog Post
🎥 Visit our YouTube channel to learn step-by-step video tutorials


Reviews
There are no reviews yet.