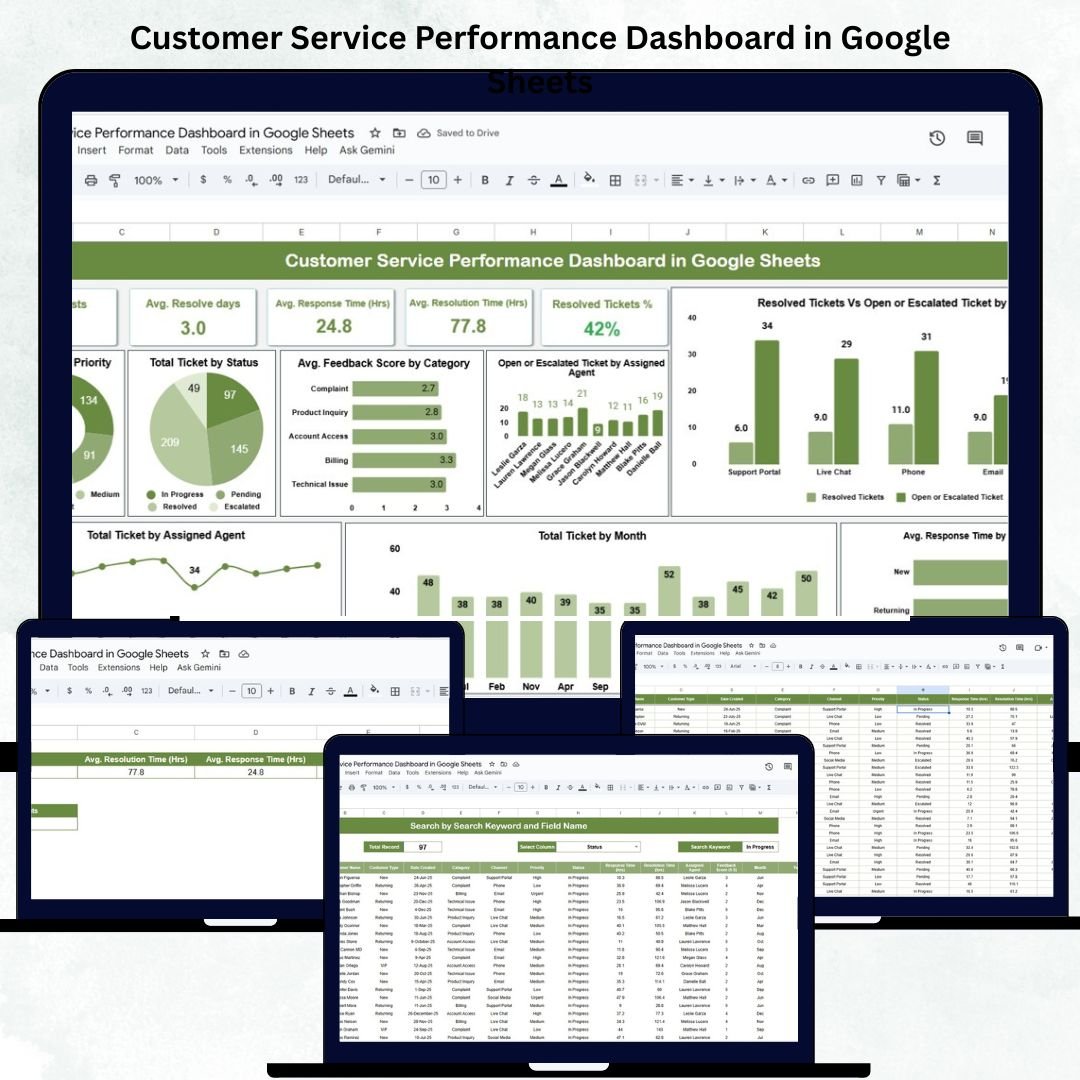
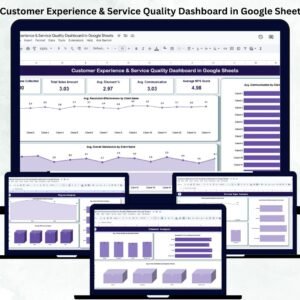
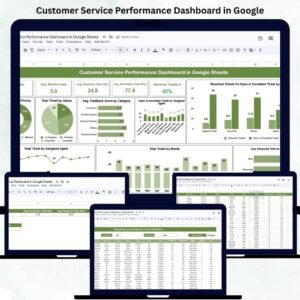
Customer service defines your brand’s reputation and customer loyalty. To truly improve it, you need to track performance through meaningful data. The Customer Service Performance Dashboard in Google Sheets provides exactly that — a powerful, easy-to-use tool to monitor service metrics, agent productivity, and customer satisfaction in real time. 💬📊
This ready-to-use Google Sheets dashboard helps service managers and business owners visualize ticket volumes, response times, resolution rates, and feedback scores — all in one place. With interactive charts, automatic KPIs, and customizable filters, this dashboard simplifies service monitoring and drives data-driven improvements. 🚀
🔑 Key Features of the Customer Service Performance Dashboard in Google Sheets
📋 Dashboard Sheet Tab (Main Dashboard)
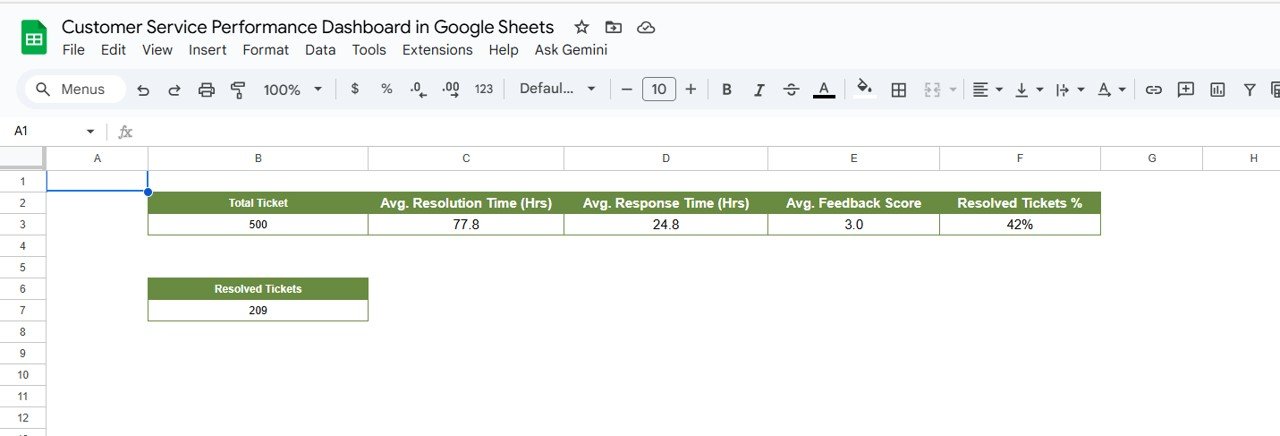
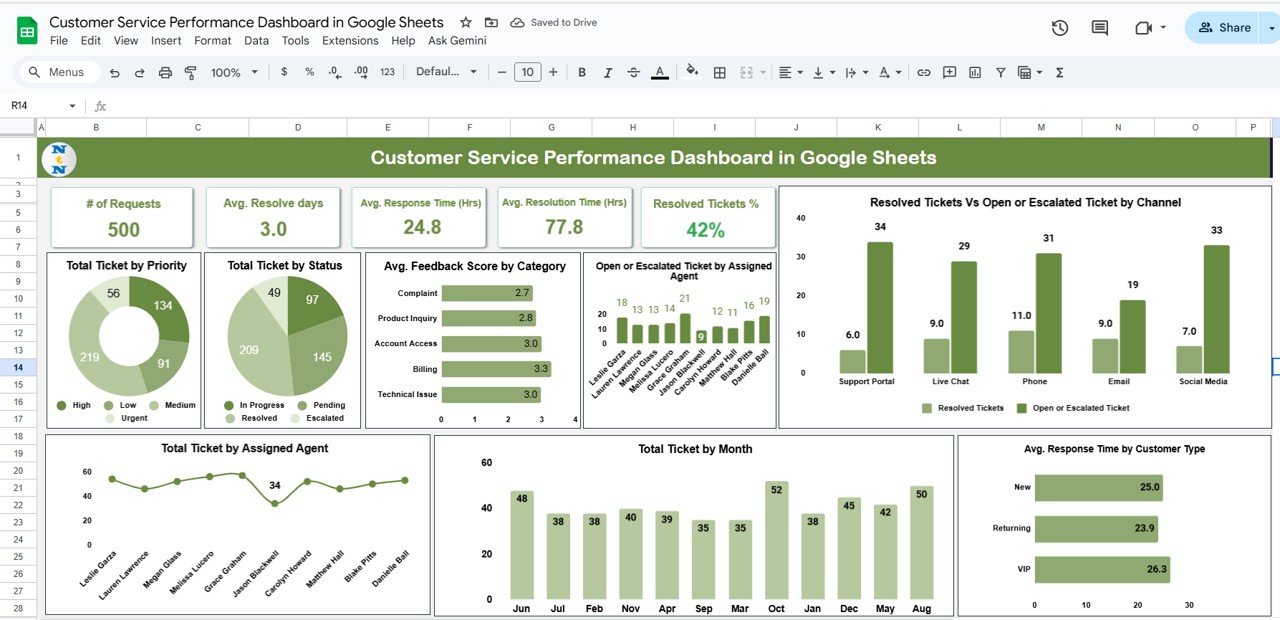
Get a 360° view of your service operations with five essential KPIs:
-
Total Tickets: Tracks all incoming service requests.
-
Avg. Resolution Time (hrs): Measures average time to close tickets.
-
Avg. Response Time (hrs): Tracks time to first reply for better SLA adherence.
-
Avg. Feedback Score: Captures customer satisfaction levels.
-
Resolved Tickets %: Highlights success in closing customer requests.
📈 Analytical Charts for Insights
Gain deeper visibility with dynamic charts:
-
📊 Tickets by Priority – See the ratio of high, medium, and low-priority cases.
-
📊 Tickets by Status – Monitor open, resolved, escalated, or closed issues.
-
📈 Avg. Feedback Score by Category – Evaluate satisfaction by department (billing, technical, general).
-
👥 Open or Escalated Tickets by Agent – Track workload balance and agent accountability.
-
💬 Resolved vs Escalated by Channel – Compare performance across email, chat, and phone support.
-
📅 Tickets by Month – Spot seasonal peaks in service requests.
-
⏱️ Avg. Response Time by Customer Type – Differentiate service quality for premium, standard, or new customers.
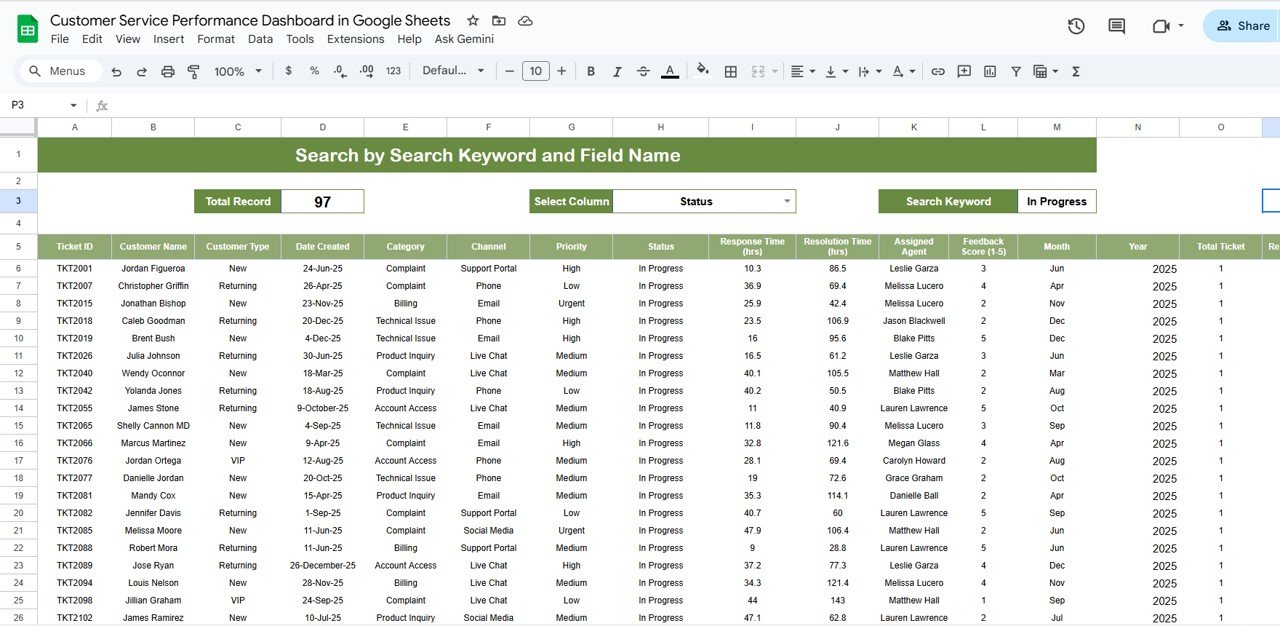
📊 Search Functionality
Quickly find any ticket by filtering through:
-
Ticket ID
-
Assigned Agent
-
Customer Type
-
Category
-
Priority
-
Channel
-
Status
Simply enter a keyword (e.g., “Escalated”) to view all related records instantly. 🔍
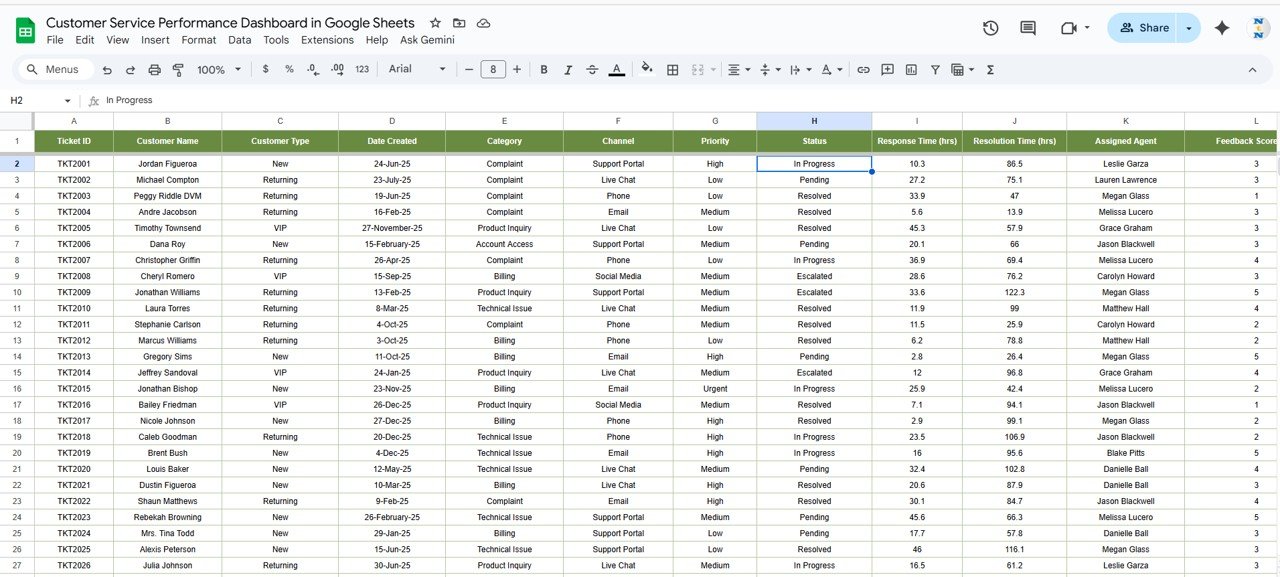
🧾 Data Sheet Tab (Input Data Source)
-
Acts as the foundation for all KPIs and charts.
-
Enter ticket details such as Date, Customer Type, Channel, Priority, Status, Feedback Score, etc.
-
Data updates reflect automatically in dashboards — ensuring accuracy and real-time visibility.
📦 What’s Inside the Customer Service Performance Dashboard?
✅ Pre-built Google Sheets file with live KPIs and visual dashboards
✅ Interactive charts and filters for quick insights
✅ Fully editable Data Sheet with pre-defined columns
✅ Real-time metric updates and calculations
✅ Color-coded performance indicators
✅ Cloud-based collaboration for teams
✅ Plug-and-play functionality — no coding required
Everything you need to manage customer support performance — instantly, visually, and collaboratively. 💼✨
🧑💼 Who Can Benefit from This Dashboard?
🎯 Customer Service Managers – Monitor team efficiency and SLA adherence.
📈 Support Team Leads – Evaluate individual and team performance.
💬 Business Owners – Understand customer satisfaction trends.
🧩 Operations Teams – Identify process bottlenecks.
🏢 Enterprises & Startups – Scale service operations with data-driven insights.
This tool gives everyone from agents to executives a clear picture of customer service excellence.
🧪 How to Use the Customer Service Performance Dashboard
1️⃣ Enter Ticket Data – Add ticket details in the Data Sheet Tab.
2️⃣ View KPIs – The dashboard auto-updates to show total tickets, resolution rates, and satisfaction scores.
3️⃣ Analyze Trends – Review performance by agent, priority, or channel.
4️⃣ Search Records – Use the search tab for quick lookups.
5️⃣ Share Results – Collaborate live via Google Sheets.
💡 Pro Tip: Connect this dashboard with Google Forms or CRM exports for automatic ticket logging!
🌟 Why Choose This Dashboard?
-
All-in-one service monitoring system
-
Real-time data visualization
-
Auto-calculated KPIs and trends
-
Team-friendly cloud access
-
Customizable metrics and filters
-
Saves time and boosts accountability
With the Customer Service Performance Dashboard in Google Sheets, you’ll enhance customer satisfaction, improve team efficiency, and make faster, smarter decisions — all without complex software. 🌟
🔗 Click here to read the Detailed blog post
Watch the step-by-step video Demo:


Reviews
There are no reviews yet.