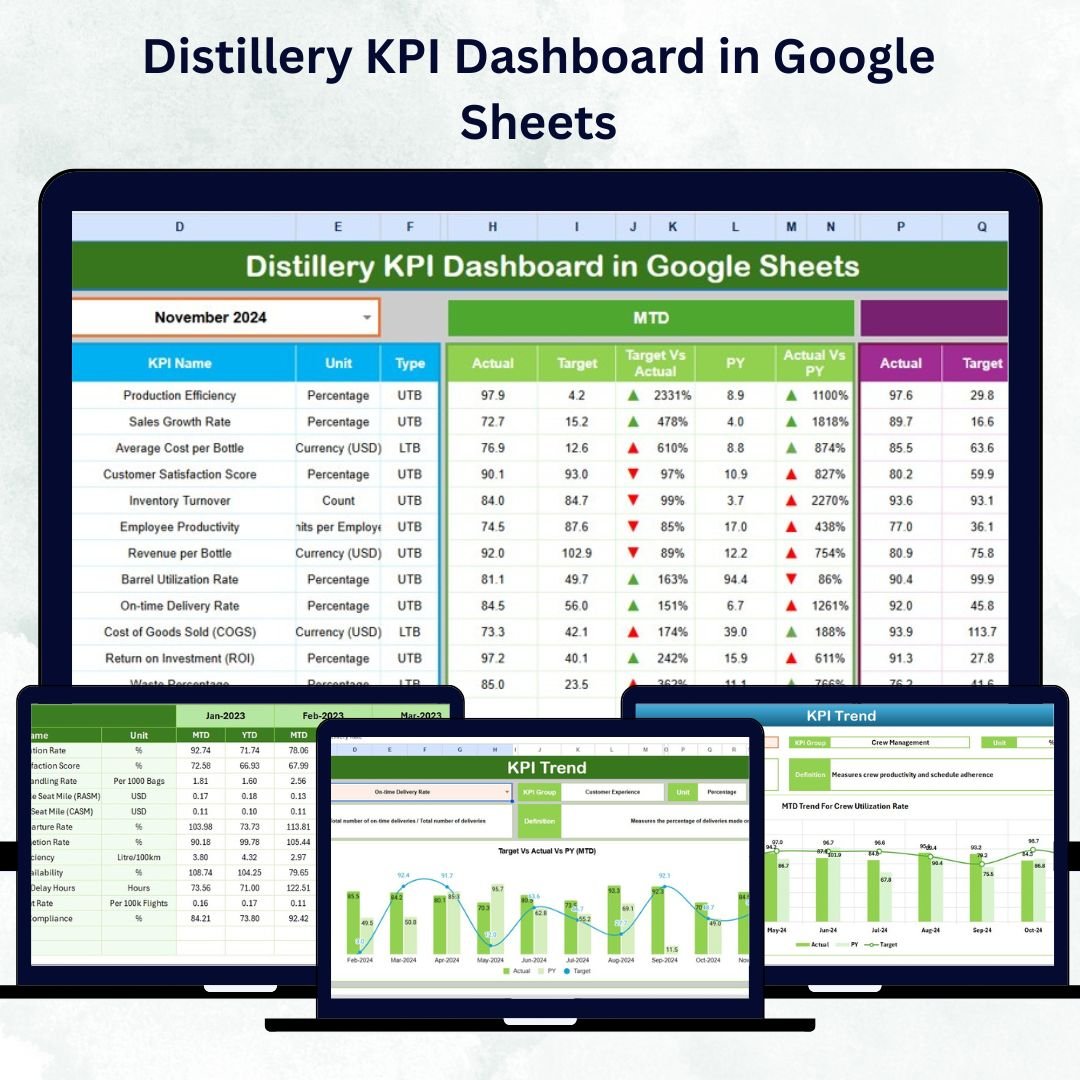
In today’s competitive distillery industry, every liter counts — efficiency, quality, and profitability depend on your ability to measure performance accurately. The Distillery KPI Dashboard in Google Sheets is your ultimate performance-tracking solution, designed to help distillery owners and managers turn data into decisions.
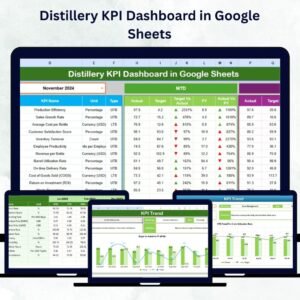
Built entirely in Google Sheets, this dynamic and easy-to-use tool transforms complex data into visually engaging charts and metrics. Whether you’re running a small craft distillery or a large-scale production facility, this dashboard provides everything you need to monitor operations, quality, finance, and sustainability — all in one place.Distillery KPI Dashboard in Google Sheets
✨ Key Features of Distillery KPI Dashboard in Google Sheets
✅ 📊 Real-Time KPI Monitoring – Instantly view Month-to-Date (MTD) and Year-to-Date (YTD) data for all major metrics.
✅ 📈 Visual Performance Indicators – Color-coded arrows make it simple to see whether your performance is improving or slipping.
✅ 🎯 Target vs Actual Comparison – Track how close your actual results are to monthly and yearly goals.
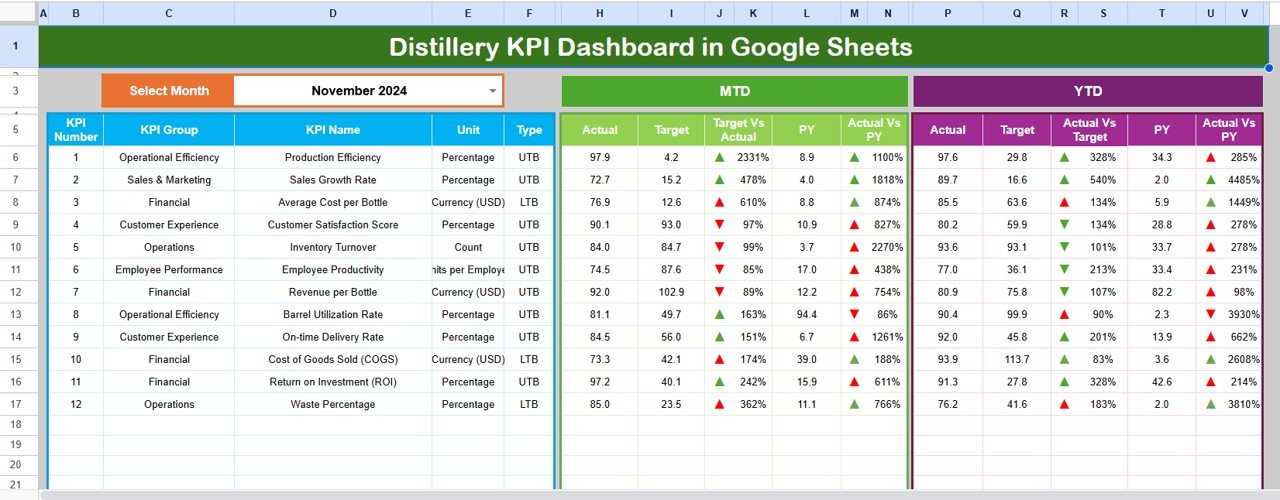
✅ 📅 Month Selector (Cell D3) – Switch months easily and watch your entire dashboard update automatically.
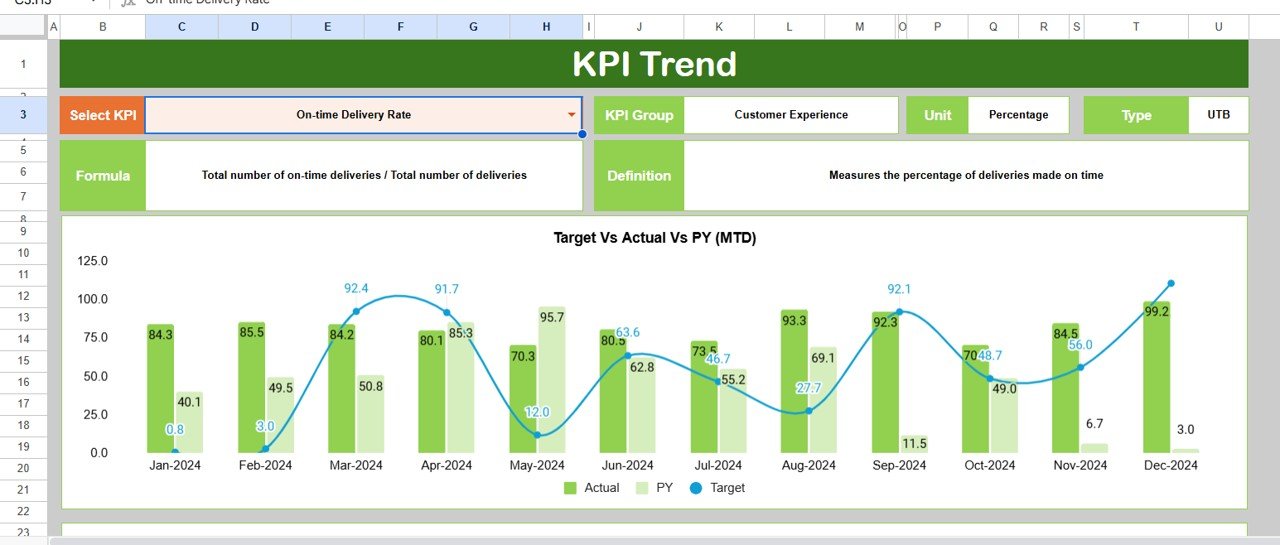
✅ 📉 Trend Analysis Charts – Analyze performance patterns over months to identify recurring issues or improvements.
✅ 🧮 Automated Calculations – No complex setup required; formulas handle updates as soon as data changes.
✅ 🌎 Cloud-Based Access – View, edit, and share your dashboard anywhere using Google Sheets’ real-time collaboration.
✅ 💰 Cost-Effective Solution – Skip expensive BI tools; achieve powerful analytics using free Google tools.
📦 What’s Inside the Distillery KPI Dashboard in Google Sheets
Your downloadable template includes six professionally designed worksheet tabs, each serving a unique purpose:
1️⃣ Dashboard Sheet – The command center with visual cards, arrows, and comparisons between Actual, Target, and Previous Year.
2️⃣ Trend Sheet – Select any KPI and analyze monthly performance through dynamic trend charts and details like Unit, Formula, and Type (UTB / LTB).
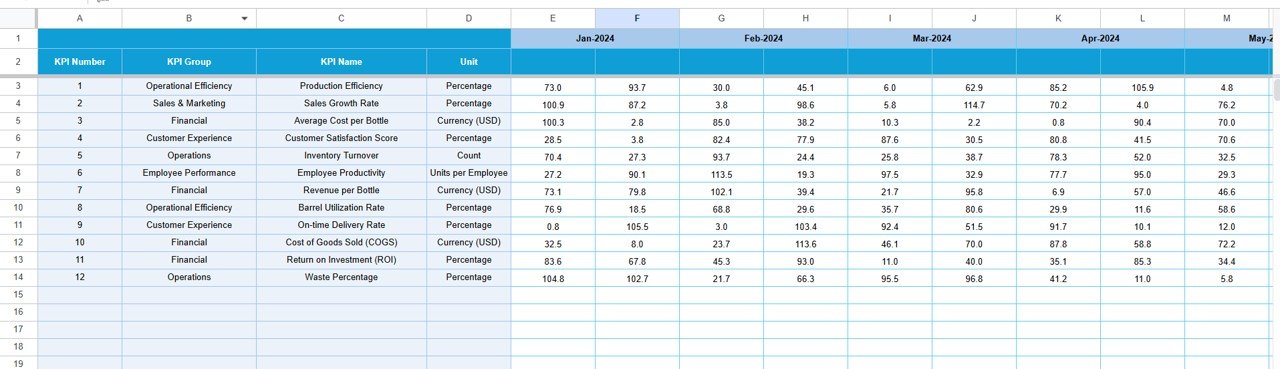
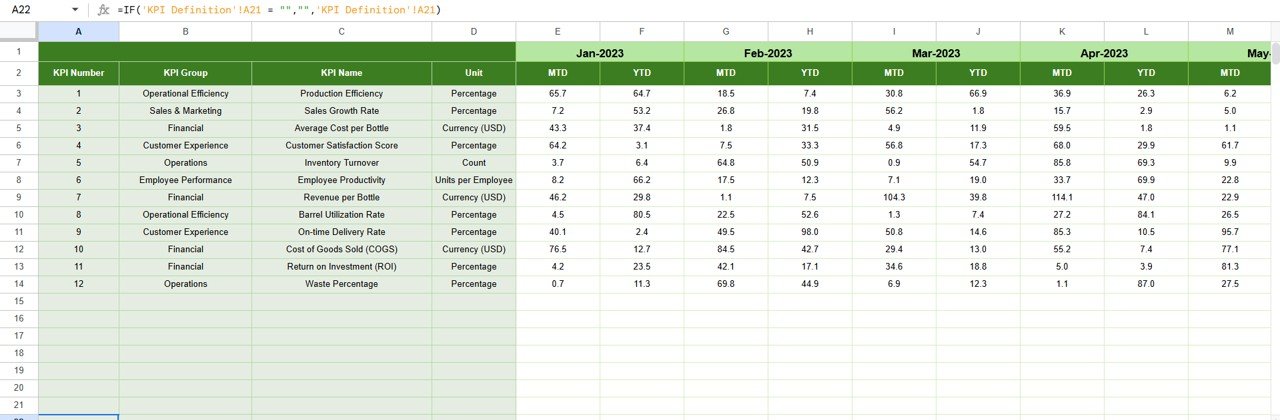
3️⃣ Actual Numbers Input Sheet – Enter your MTD and YTD data; everything else updates automatically.
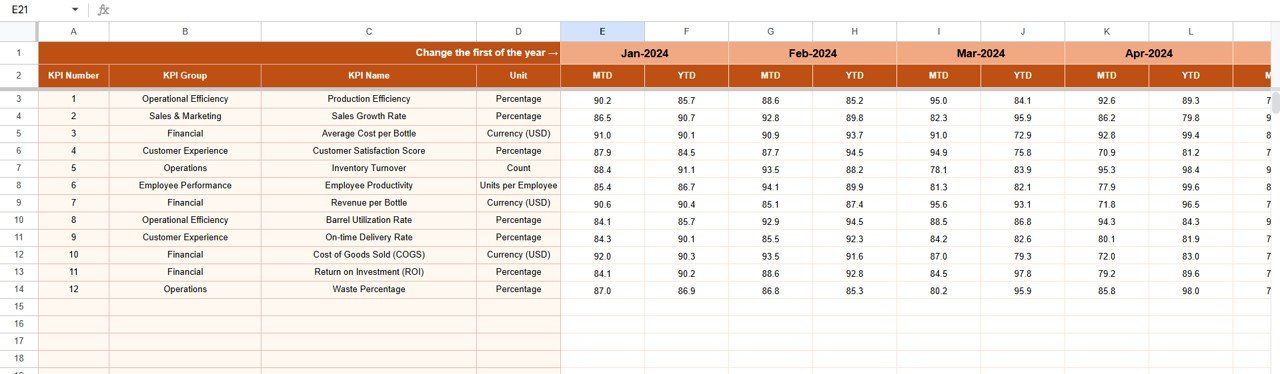
4️⃣ Target Sheet – Define monthly performance goals and benchmark them against real outcomes.
5️⃣ Previous Year Sheet – Store and compare historical data for meaningful year-over-year insights.
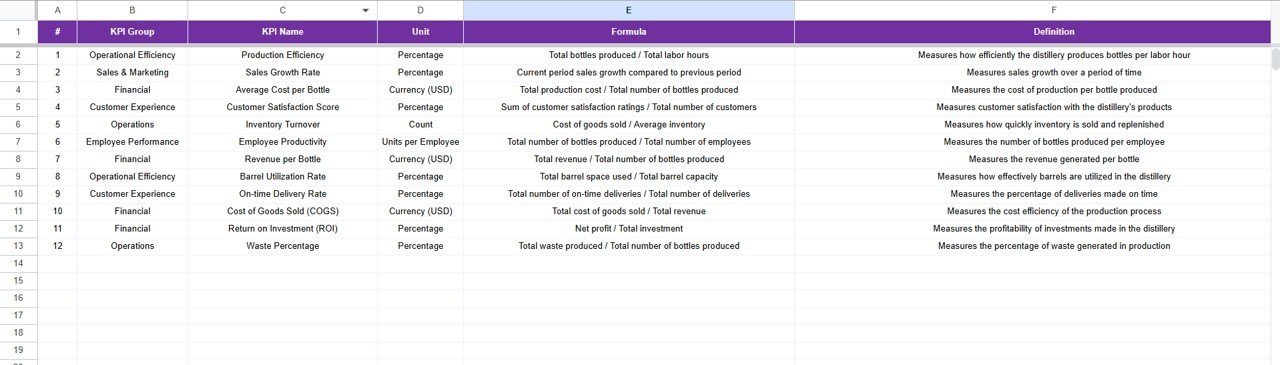
6️⃣ KPI Definition Sheet – Reference sheet containing KPI groups, formulas, units, and definitions to ensure clarity and consistency.
Each sheet is interconnected — change one, and your entire dashboard refreshes instantly.
🧭 How to Use the Distillery KPI Dashboard in Google Sheets
Using this template is effortless, even for non-technical users:
1️⃣ Enter Actual Data in the “Actual Numbers Input” tab.
2️⃣ Update Monthly Targets in the “Target Sheet.”
3️⃣ Add Last Year’s Data in the “Previous Year Sheet.”
4️⃣ Review Dashboard for visual summaries and KPI cards.Distillery KPI Dashboard in Google Sheets
5️⃣ Switch Months using the drop-down in Cell D3.
6️⃣ Analyze Trends through interactive charts in the “Trend Sheet.”
7️⃣ Identify Gaps where performance is below target and take corrective action.
Everything is automated — no macros or coding required.
👥 Who Can Benefit from This Distillery KPI Dashboard
This Google Sheets dashboard is tailor-made for:
🍾 Distillery Owners & Managers – Monitor operations and financial performance at a glance.
🧑🏭 Production Teams – Track efficiency, yield, and downtime with precision.
💸 Finance & Accounting Teams – Analyze cost per liter, profit margins, and waste reduction.
🧪 Quality Control Experts – Monitor alcohol purity, defect rates, and QC pass percentages.
🌱 Sustainability Teams – Track water usage, CO₂ emissions, and recycling efficiency.
📋 Consultants & Auditors – Use ready data visualizations to assess overall performance health.
With its simple design and flexible structure, this dashboard adapts perfectly to any spirit type — whisky, rum, gin, vodka, or liqueur operations.
🚀 Why Choose This Template
✔ 100 % Customizable – Add or modify KPIs based on your business needs.
✔ Team-Friendly – Collaborate with colleagues simultaneously.
✔ Instant Insights – No waiting for reports — view performance instantly.
✔ Plug-and-Play Setup – Just input your data and start analyzing within minutes.
This tool empowers distilleries to make data-driven decisions that enhance productivity, reduce waste, and increase profits — all from one sleek Google Sheets dashboard.


Reviews
There are no reviews yet.