
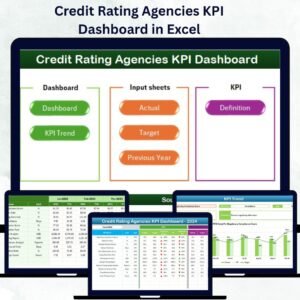
In today’s dynamic financial landscape, credit-rating agencies are the backbone of market transparency and investor confidence. Every rating, review, and report depends on timely analysis, accuracy, and compliance. But when dozens of performance metrics pile up across teams, tracking them manually becomes complex and time-consuming.
That’s why the Credit Rating Agencies KPI Dashboard in Excel is a must-have tool for every modern rating organization 📊💼.
This powerful Excel-based dashboard transforms your performance data into clear visuals, automated summaries, and actionable insights. From measuring turnaround time and rating accuracy to monitoring compliance and client coverage, this ready-to-use template empowers agencies to maintain efficiency, credibility, and accountability — all in one place.
⚙️ Key Features of the Credit Rating Agencies KPI Dashboard in Excel
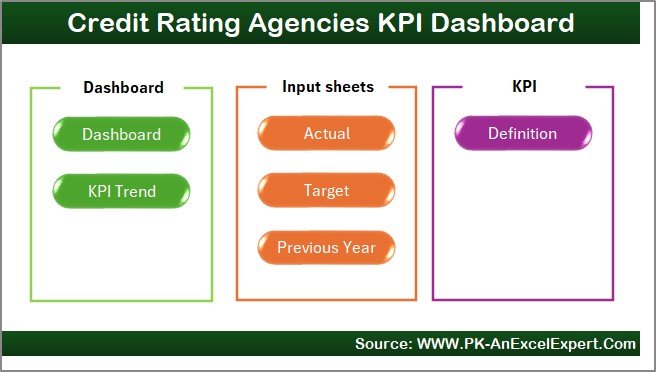
📊 7 Structured Sheets – Home, Dashboard, KPI Trend, Actual Numbers, Target, Previous Year Data, and KPI Definition.
🎯 MTD & YTD Analysis – View Month-to-Date and Year-to-Date performance instantly.
📈 Dynamic Dropdown Controls – Select any month or KPI to update all visuals automatically.
🔁 Real-Time Comparisons – Actual vs Target vs Previous Year (PY) with ↑ ↓ icons.
🟢 Color-Coded Insights – Instantly identify performance gaps or achievements.
📅 Interactive Navigation Buttons – Move between sheets effortlessly.
⚙️ Auto Calculations – Linked formulas ensure accuracy and consistency.
💡 Customizable Structure – Add, edit, or delete KPIs to match your agency’s needs.
💰 No Software Required – Works entirely in Excel for cost-effective deployment.
📦 What’s Inside the Dashboard Template
1️⃣ Home Sheet – Your Control Hub
Navigate the workbook with six one-click buttons that lead to every key module. Clean, intuitive, and perfect for quick access.
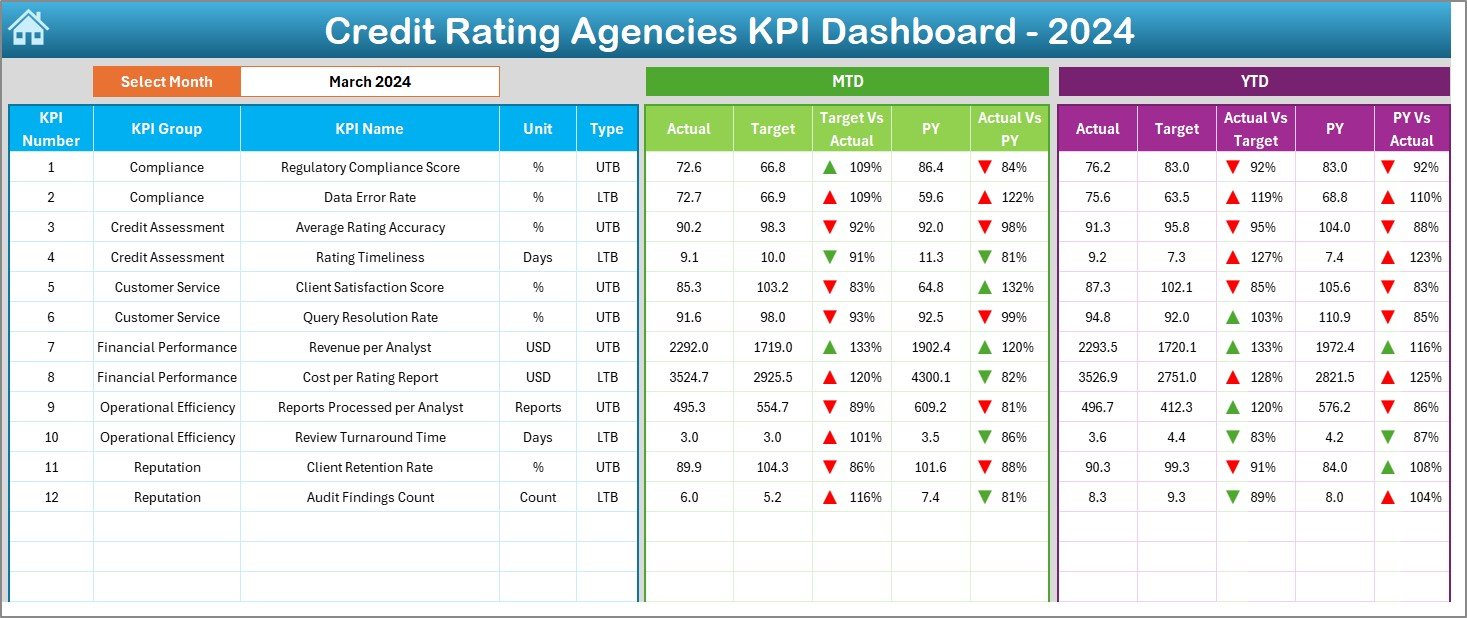
2️⃣ Dashboard Sheet – Performance at a Glance
The heart of the tool ❤️
-
Choose a month (cell D3) to instantly refresh all KPIs.
-
Review MTD and YTD Actual vs Target vs PY values.
-
Up/down arrows and color signals highlight progress or decline.
This page gives executives a clear, real-time snapshot of how well their rating operations perform.
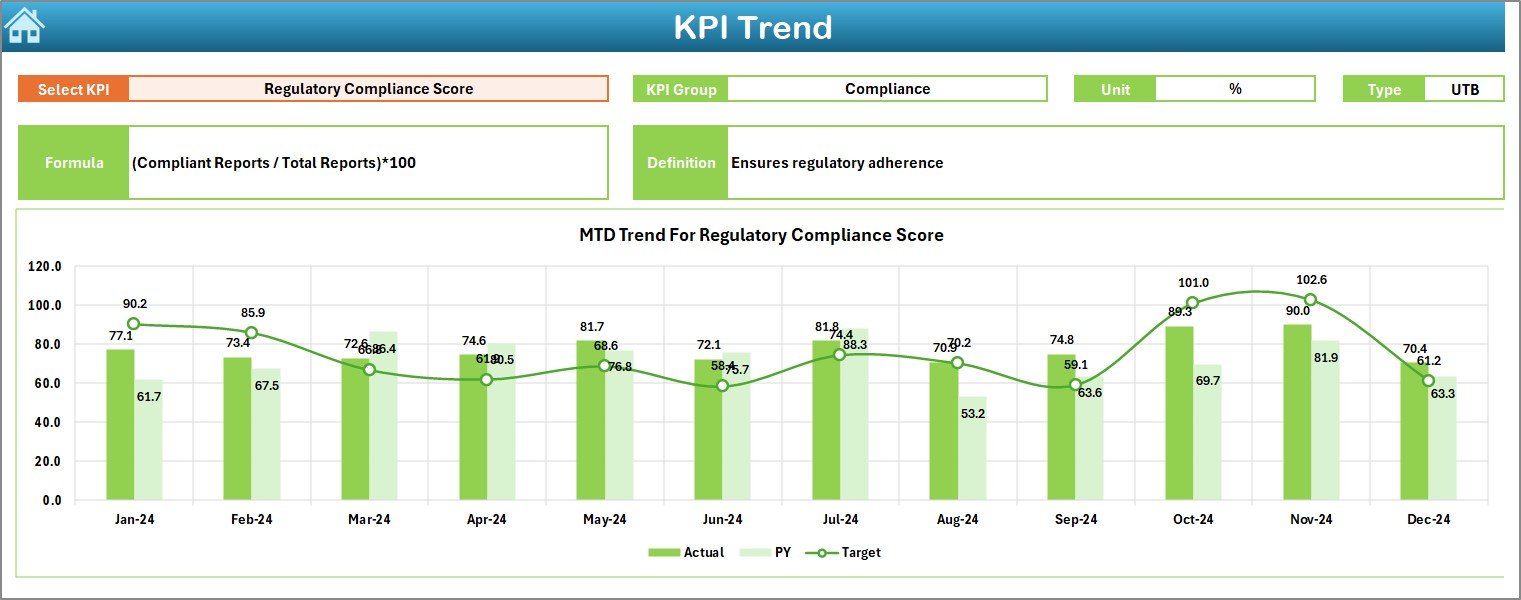
3️⃣ KPI Trend Sheet – Visualize Progress Over Time
-
Pick any KPI from a dropdown (cell C3).
-
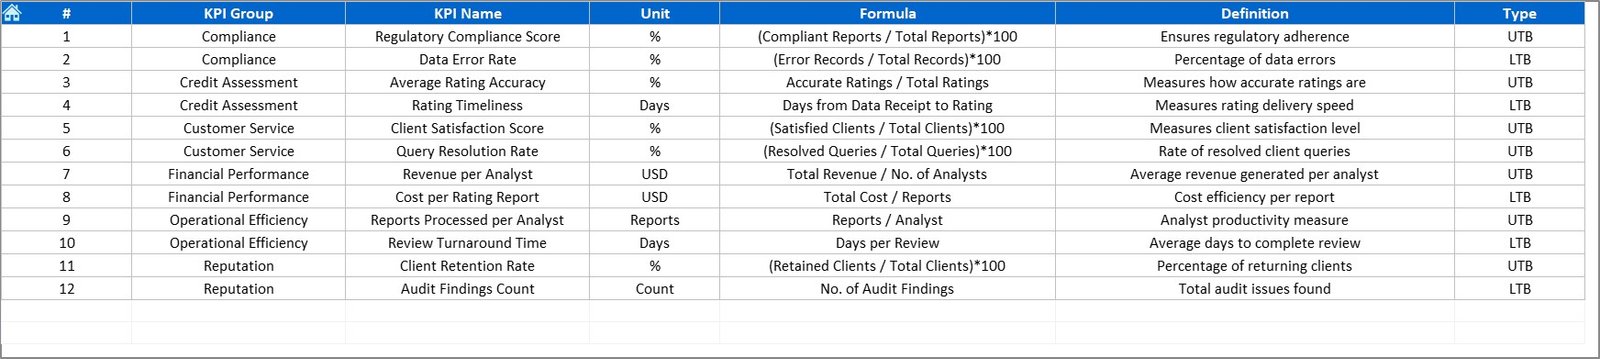
Automatically see its Group, Unit, Formula, Type (UTB/LTB), and Definition.
-
Trend charts show Actual, Target, and PY data for both MTD and YTD.
Perfect for detecting seasonal patterns and long-term improvements.
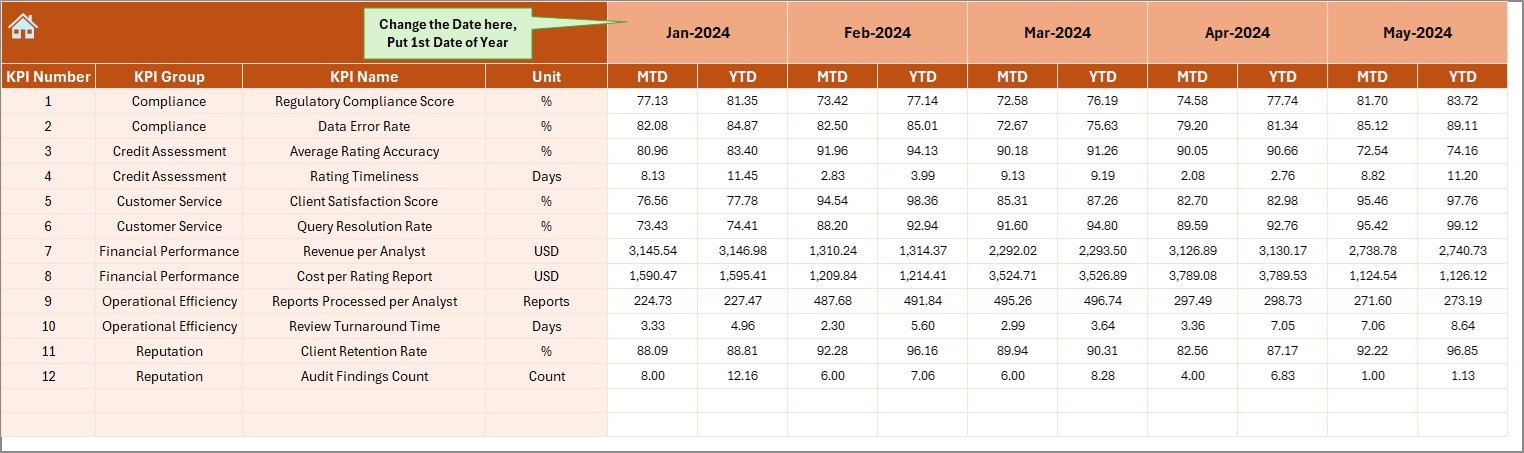
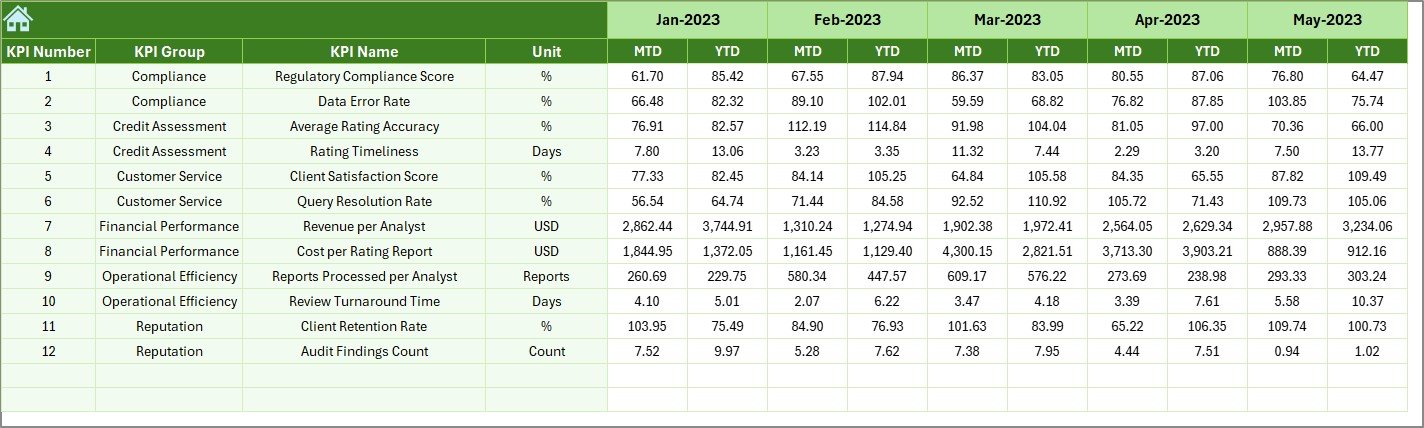
4️⃣ Actual Numbers Sheet – Core Data Entry
Enter monthly actual figures for each KPI.
-
Update once — the entire dashboard refreshes automatically.
-
Start month is selectable from cell E1 for flexible fiscal years.
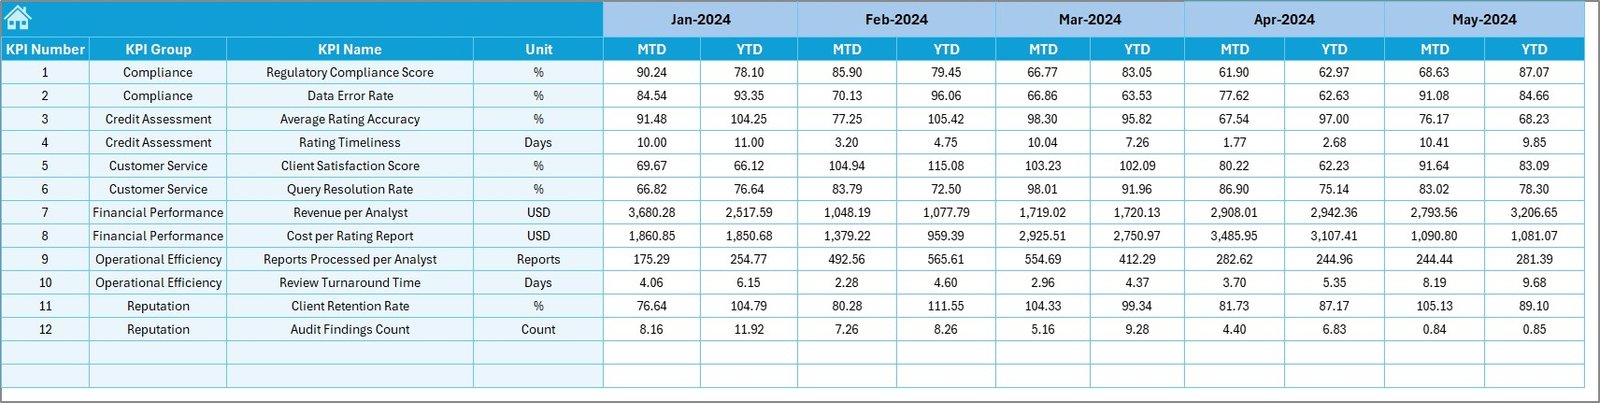
5️⃣ Target Sheet – Set Your Goals
Define monthly MTD and YTD targets to benchmark performance.
-
All comparisons and trend calculations pull directly from these values.
6️⃣ Previous Year Sheet – Track Historical Data
Input last year’s numbers to automatically calculate PY vs Actual gaps and growth percentages.
7️⃣ KPI Definition Sheet – Standardize Metrics
Document each indicator’s Formula, Unit, and Definition so everyone interprets KPIs the same way.
💡 Why Credit Rating Agencies Need This Dashboard
🏦 Ensure Data Accuracy – Automated formulas reduce manual error.
📈 Enhance Decision-Making – Clear visuals highlight trends and priorities.
🔍 Strengthen Compliance – Track regulatory KPIs and audit metrics.
🧾 Improve Accountability – Assign ownership to teams and departments.
💬 Save Time & Resources – Generate reports instantly without complex software.
🌟 Advantages of Using the Dashboard
✅ Real-Time Insights – Instant MTD/YTD updates.
✅ Interactive Analytics – Conditional formatting and charts for clarity.
✅ Full Customization – Modify KPIs and visuals as needed.
✅ Centralized Data Management – All information in one Excel file.
✅ Transparency & Audit Readiness – Maintain organized records for reviews.
✅ Budget-Friendly Solution – Professional features without subscriptions.
🧭 How to Use the Dashboard
1️⃣ Define KPIs – List them in the KPI Definition sheet.
2️⃣ Enter Data – Add Actual, Target, and PY figures each month.
3️⃣ Select Month – Use Dashboard dropdown to update views.
4️⃣ Analyze Trends – Study charts in the KPI Trend tab.
5️⃣ Act Fast – Use visual cues to correct underperformance.
👥 Who Can Benefit from This Dashboard
-
Credit Rating Agencies & Research Firms 🏦
-
Risk Assessment Teams 📉
-
Compliance and Audit Departments 🧾
-
Financial Analysts & Consultants 💼
-
Management Executives Seeking Operational Visibility 🎯
🧠 Conclusion
The Credit Rating Agencies KPI Dashboard in Excel revolutionizes how rating organizations monitor performance. It combines automation, visual analytics, and structured data to deliver clarity and control.
From turnaround time to rating accuracy, every metric is transparent and traceable — empowering leadership teams to make decisions based on facts, not guesswork.
Bring your data to life, streamline reporting, and achieve operational excellence with this all-in-one Excel dashboard today! ✨


Reviews
There are no reviews yet.