


In today’s competitive business environment, financial performance tracking is more important than ever. The Finance KPI Scorecard in Excel is a ready-to-use performance management tool that helps finance teams and executives monitor key financial indicators, analyze trends, and make informed decisions.
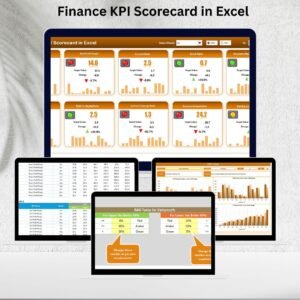
Instead of juggling multiple reports, this scorecard consolidates revenue, expenses, profitability, liquidity, and efficiency metrics into one clear, interactive dashboard. With MTD (Month-to-Date) and YTD (Year-to-Date) analysis, traffic lights, arrows, and trend visuals, you’ll instantly know which areas are on track and which require urgent attention.
Accessible, customizable, and professional—this template is designed to save time, reduce manual effort, and improve financial reporting for organizations of all sizes.
🔑 Key Features of the Finance KPI Scorecard
📊 Dashboard Overview
Month Selection Dropdown to update all KPIs dynamically
Toggle between MTD & YTD metrics
Traffic lights and up/down arrows for performance indicators
Percentage changes for clear trend visibility
📈 Trend Sheet
Select a KPI via dropdown for in-depth trend analysis
Displays KPI Group, Unit, Type (UTB/LTB), Formula, and Definition
Charts to identify growth patterns and problem areas
📖 KPI Definition Sheet
Reference sheet documenting all KPIs
Includes KPI Name, Group, Unit, Formula, Definition, and Type
Ensures alignment and clarity across finance teams
🧾 Input Data Sheet
Enter monthly actuals, targets, and other financial metrics
Flexible and simple design for easy updates
Keeps the dashboard live and accurate without technical skills
📦 What’s Inside the Finance KPI Scorecard?
✅ Dashboard Tab – Financial KPIs at a glance with visual indicators
✅ Trend Tab – Analyze individual KPIs and historical patterns
✅ KPI Definition Tab – Clear documentation of all KPIs
✅ Input Data Tab – User-friendly data entry structure
✅ Sample Data Included – Start analyzing right away
💡 Examples of KPIs to Track
Revenue Growth (%) – UTB
Operating Expenses – LTB
Net Profit Margin (%) – UTB
Liquidity Ratio – UTB
Accounts Receivable Turnover – UTB
Accounts Payable Turnover – UTB
Cost-to-Income Ratio (%) – LTB
Cash Flow from Operations – UTB
👩💼 Who Can Benefit from This Scorecard?
💼 Finance Teams – Track company-wide performance metrics
📊 Executives & CFOs – Gain insights for decision-making and board reporting
🏢 Small Business Owners – Monitor revenue, expenses, and profitability
📈 Consultants & Analysts – Use structured visuals for client reporting
🎯 Project Managers – Align financial goals with operational outcomes
🧪 How to Use the Finance KPI Scorecard
Enter Data – Record monthly financial figures in the Input Data Sheet
Set Targets – Add benchmarks for revenue, expenses, and profits
Review Dashboard – Instantly see performance vs targets with traffic lights
Analyze Trends – Use the Trend Sheet to evaluate long-term patterns
Align Strategy – Adjust operations and budgets based on insights
🌟 Advantages of Using This Scorecard
📊 Centralized Tracking – All KPIs in one Excel file
✅ Visual Insights – Quickly spot underperforming areas
🔍 MTD & YTD Analysis – Compare monthly and yearly progress
⏱ Time-Saving – Automates calculations and reduces manual reporting
🛠 Customizable – Add or modify KPIs to fit your organization
📈 Data-Driven Decisions – Use accurate insights to drive growth
🚀 Why Choose This Finance KPI Scorecard?
Instead of relying on scattered reports or time-consuming manual calculations, this all-in-one Excel scorecard helps you monitor financial performance effortlessly. With its built-in traffic lights, arrows, and trend visuals, you can focus on decision-making instead of data crunching.
Perfect for startups, SMEs, and large enterprises, this template ensures your financial health stays transparent, measurable, and actionable.
🔗 Click here to read the Detailed blog post
Watch the step-by-step video Demo:









Reviews
There are no reviews yet.