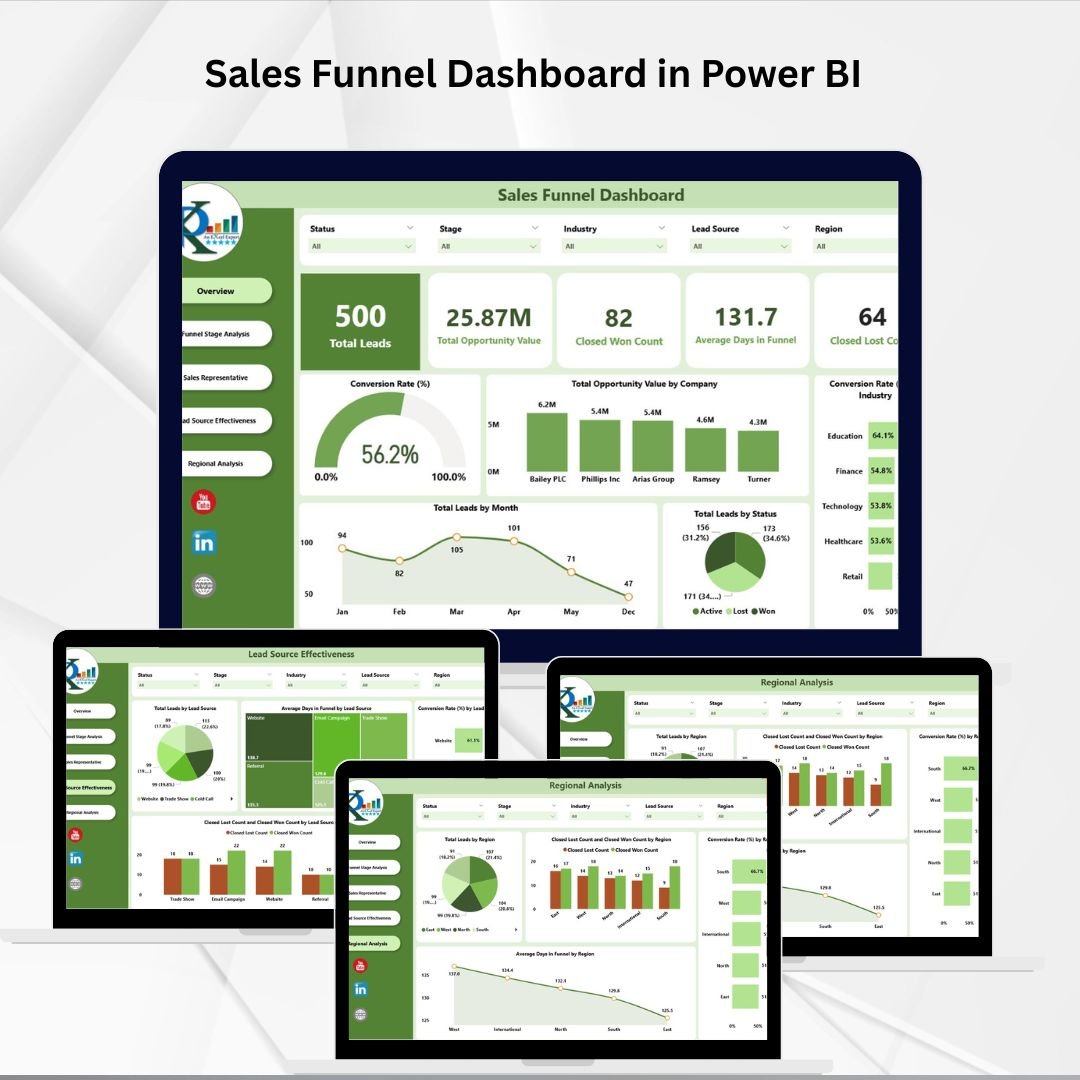
Converting leads into paying customers is the heartbeat of every business. But without a structured way to visualize your pipeline, it’s easy to lose track of opportunities, miss bottlenecks, or overlook top-performing channels. That’s where the Sales Funnel Dashboard in Power BI comes in — a powerful, ready-to-use tool that gives you complete visibility into your sales process. 📊🚀
This interactive dashboard is designed for sales leaders, managers, and executives who want real-time insights into leads, opportunities, conversions, and rep performance. With multiple pages, drill-down charts, and dynamic visuals, you can monitor every stage of the funnel, identify underperforming areas, and make data-driven decisions that drive revenue.
🔑 Key Features of Sales Funnel Dashboard in Power BI
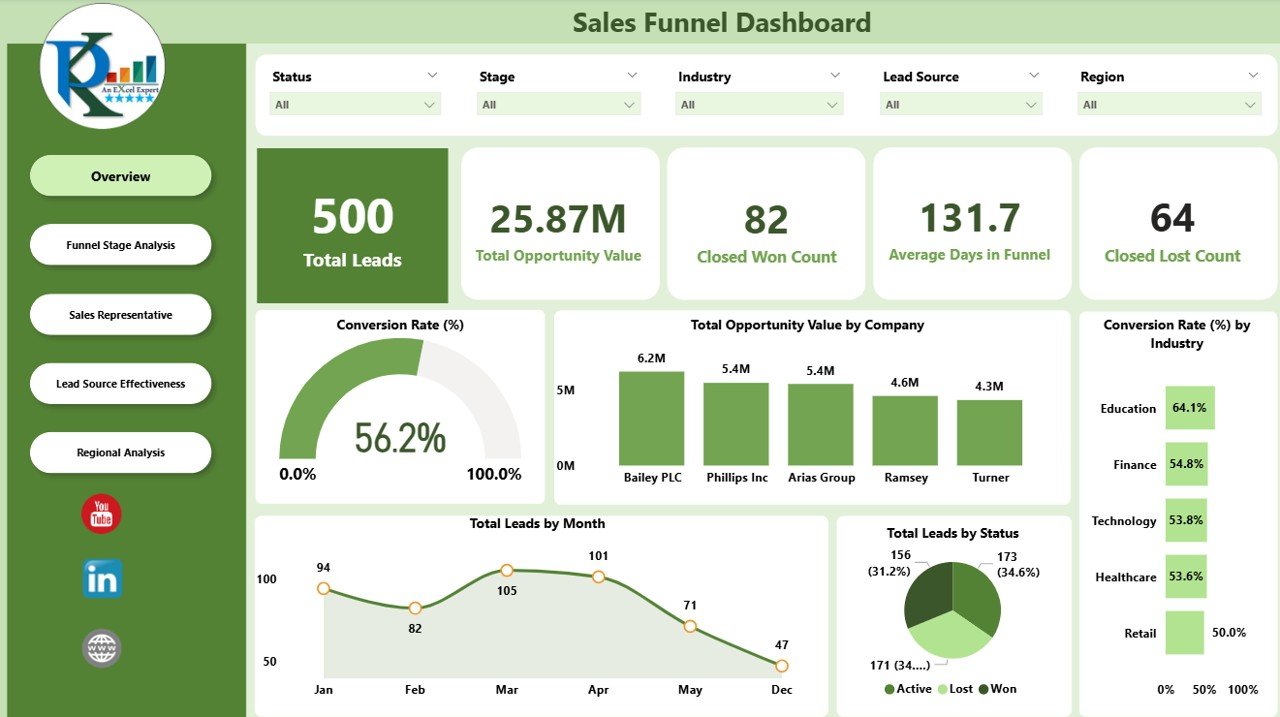
📋 Overview Page
-
Cards for Total Leads, Opportunity Value, Closed Won, Closed Lost, Avg. Days in Funnel.
-
Charts for Conversion Rate, Opportunity Value by Company, Conversion by Industry, Leads by Month & Status.
-
Get a snapshot of your funnel health in seconds.
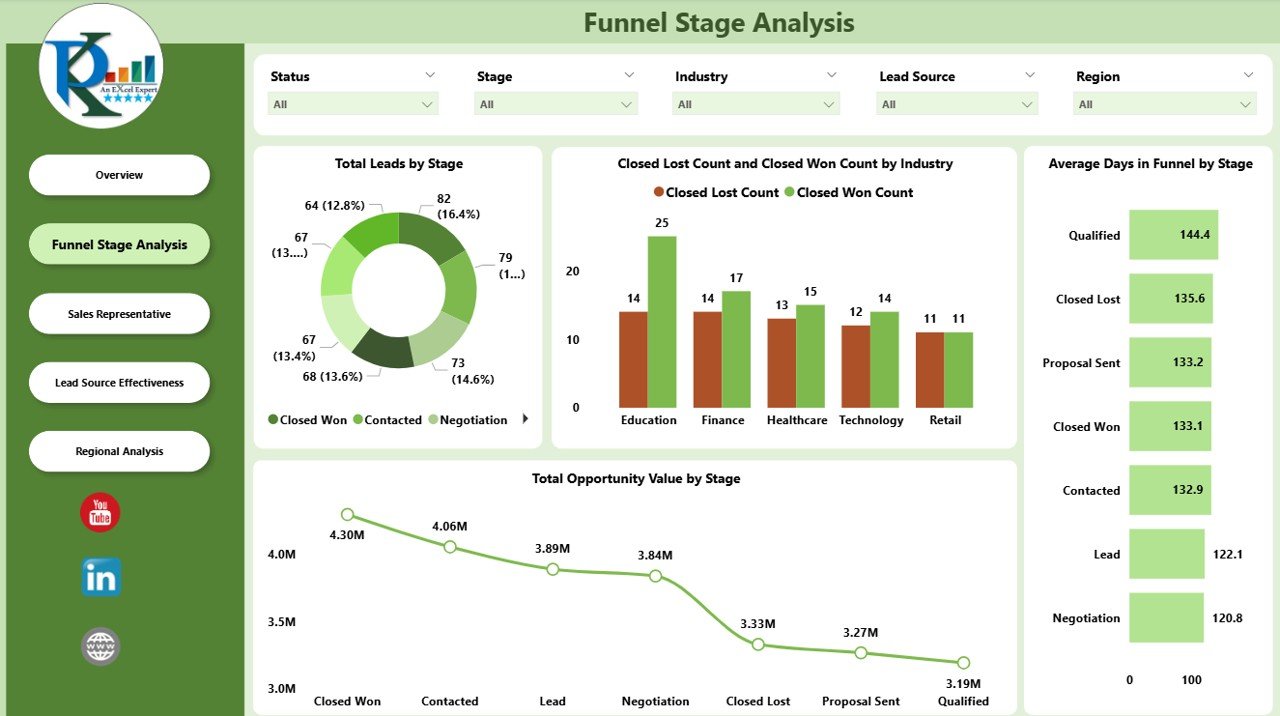
📈 Funnel Stage Analysis
-
Visualize Total Leads by Stage to spot bottlenecks.
-
Compare Closed Won vs. Closed Lost by Industry.
-
Track Opportunity Value & Avg. Days per Stage.
-
Optimize pipeline flow and reduce lead stagnation.
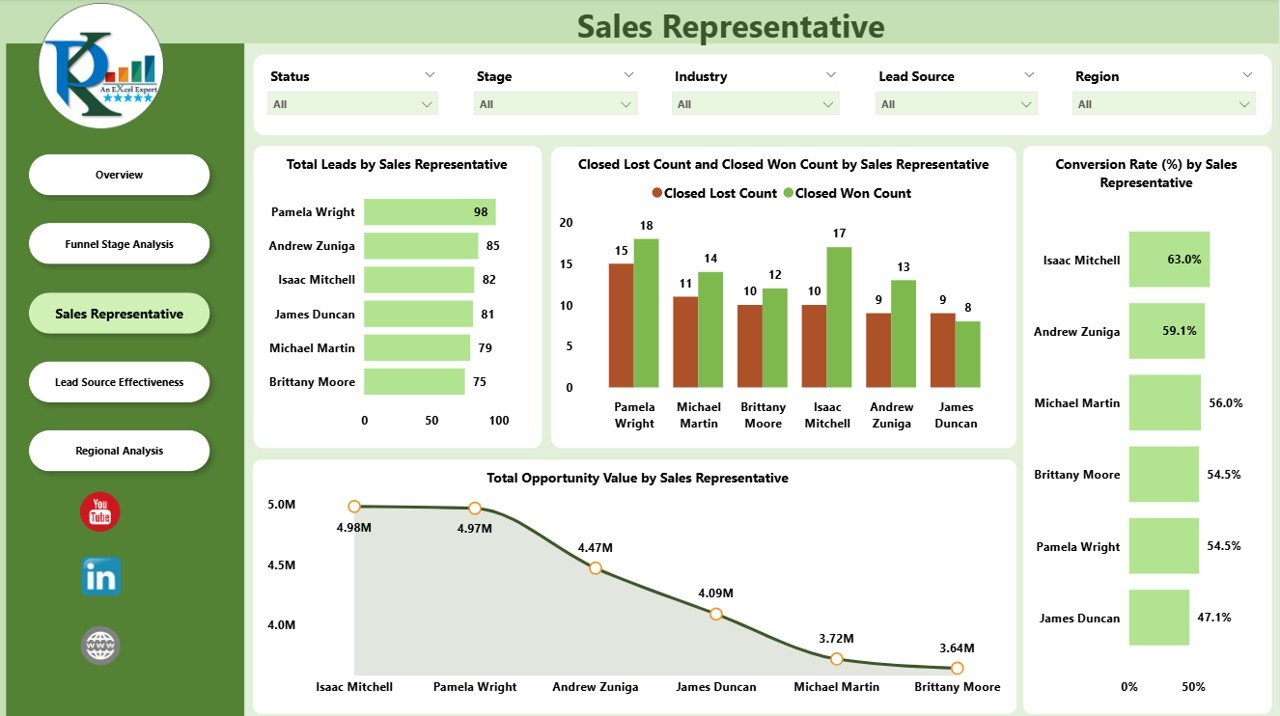
🧑💼 Sales Representative Page
-
Assess Leads managed per rep.
-
Measure Closed Won vs. Closed Lost by Rep.
-
Analyze Opportunity Value & Conversion Rates per Rep.
-
Reward top performers and support underperformers.
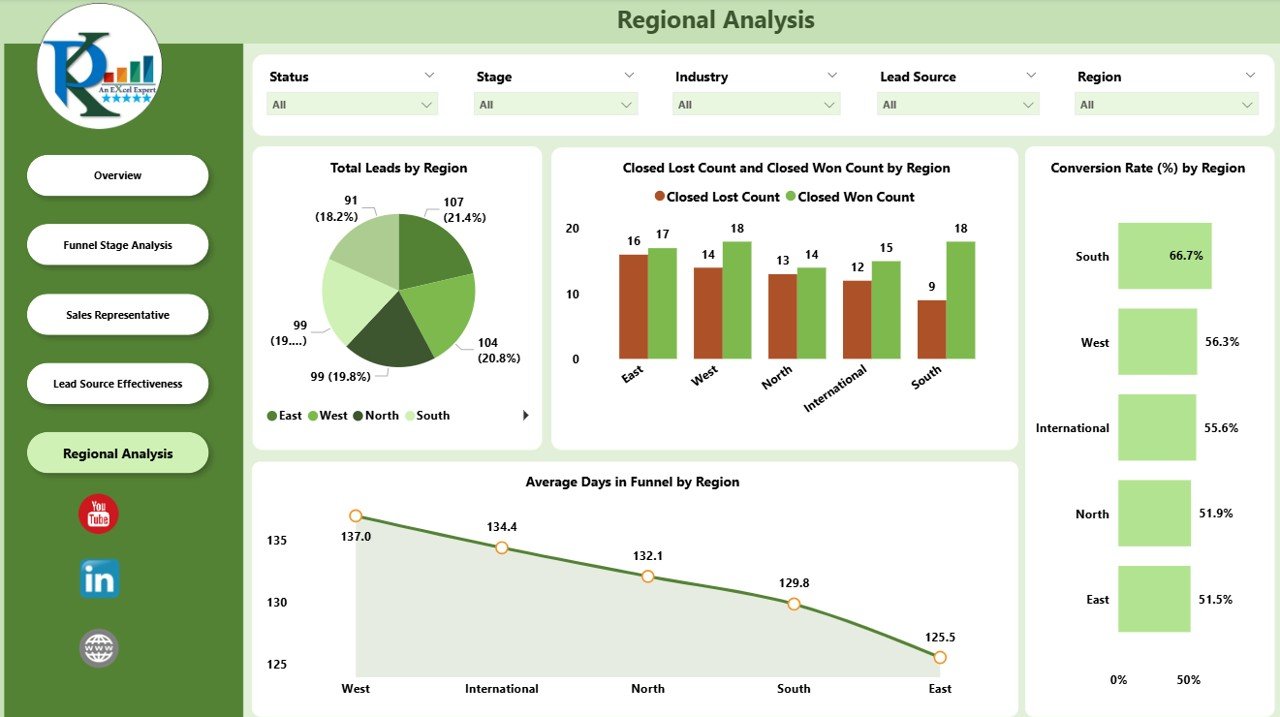
🌍 Regional Analysis
-
Breakdown of Leads, Wins, Losses, Conversion Rates, Avg. Days in Funnel by region.
-
Allocate resources to high-performing geographies.
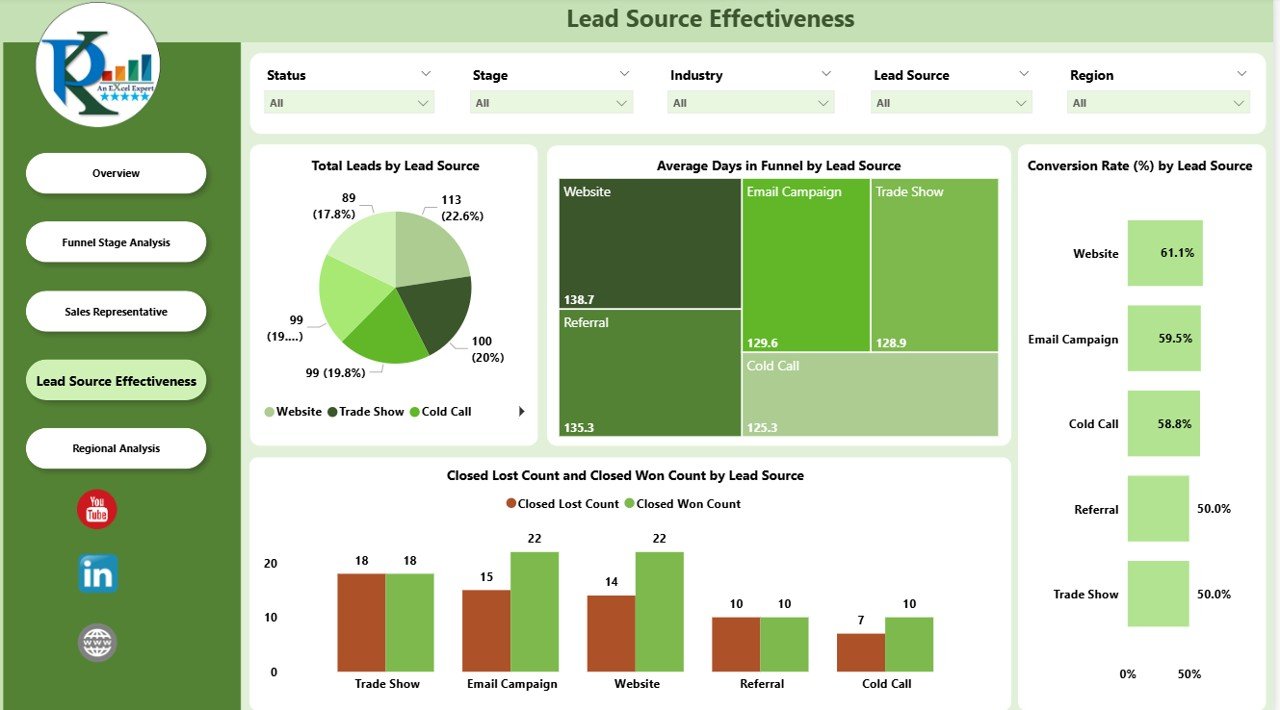
📣 Lead Source Effectiveness
-
Evaluate which channels bring the best results.
-
Charts for Leads by Source, Avg. Days per Source, Conversion Rate, Opportunity Value.
-
Double down on profitable lead channels.
📦 What’s Inside the Dashboard?
✅ 5 Interactive Pages – Overview, Funnel Stages, Sales Reps, Regions, Lead Sources
✅ Dynamic Visuals – Conversion funnels, bar/line charts, KPIs with arrows
✅ Drill-Down Features – Analyze by industry, rep, or region
✅ Ready-to-Use KPIs – MTD/YTD metrics, conversion rates, opportunity values
✅ Customizable Design – Add/remove KPIs or adapt visuals to your process
✅ Power BI Compatibility – Runs smoothly with your CRM data sources
🎯 Who Can Benefit from This Dashboard?
💼 Sales Managers – Track team performance and funnel health.
📊 Executives – Gain high-level insights into revenue opportunities.
🧑💻 Sales Reps – Monitor personal leads and conversion efficiency.
📣 Marketing Teams – See which lead sources generate ROI.
🏢 Startups & Enterprises – Adaptable to businesses of any size.
🧠 How to Use the Sales Funnel Dashboard
-
Connect your CRM or sales data source to Power BI.
-
Load leads, opportunities, and sales rep data into the model.
-
Use slicers to filter by timeframe, rep, industry, or region.
-
Navigate between the Overview, Funnel, Reps, Regions, and Sources pages.
-
Review charts to identify bottlenecks, high-value leads, and rep efficiency.
-
Share interactive dashboards with your team for collaboration.
No coding required — just clean, interactive visuals that drive results. 🎯
🚀 Advantages of Using This Dashboard
-
Real-Time Visibility – Instantly track pipeline health.
-
Identify Bottlenecks – Spot where leads get stuck.
-
Rep Performance Tracking – Coach and reward based on data.
-
Lead Source ROI – Focus on profitable channels.
-
Regional Insights – Allocate resources strategically.
-
Revenue Forecasting – Predict outcomes from opportunity values.
-
Customizable – Adapt to your sales process with ease.
🔗 Click here to read the Detailed blog post
Watch the step-by-step video Demo:


Reviews
There are no reviews yet.