

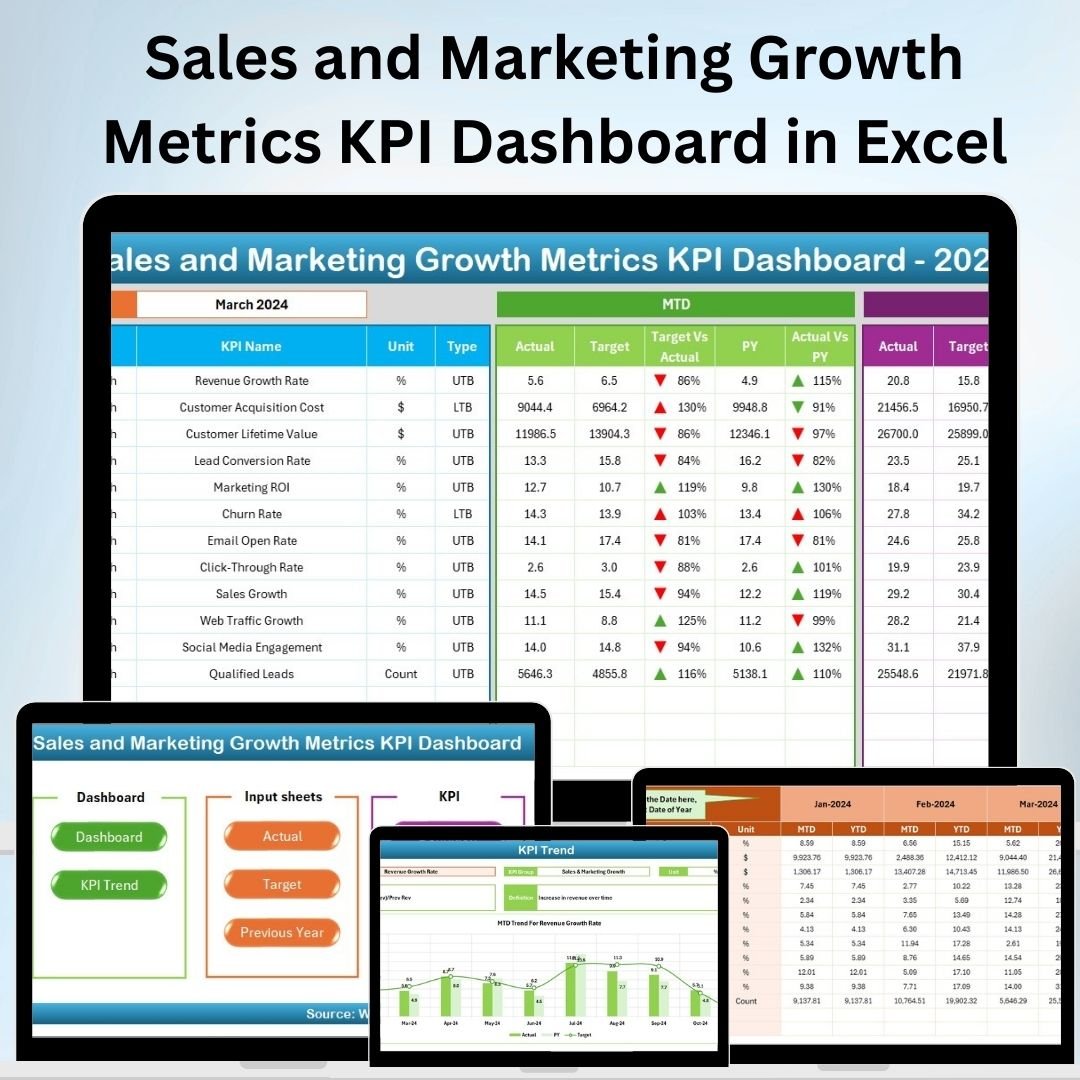


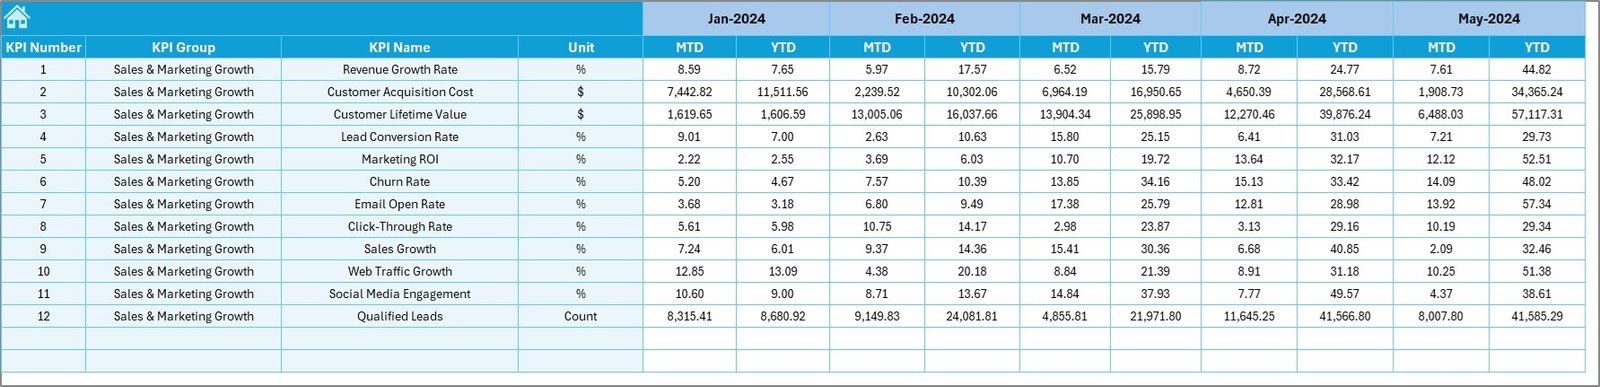
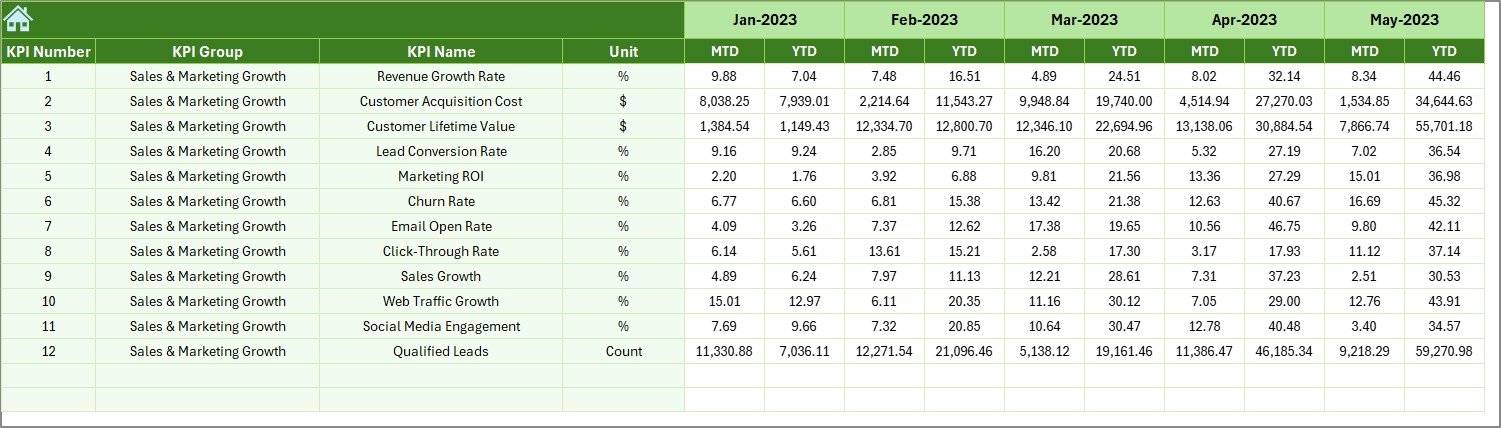
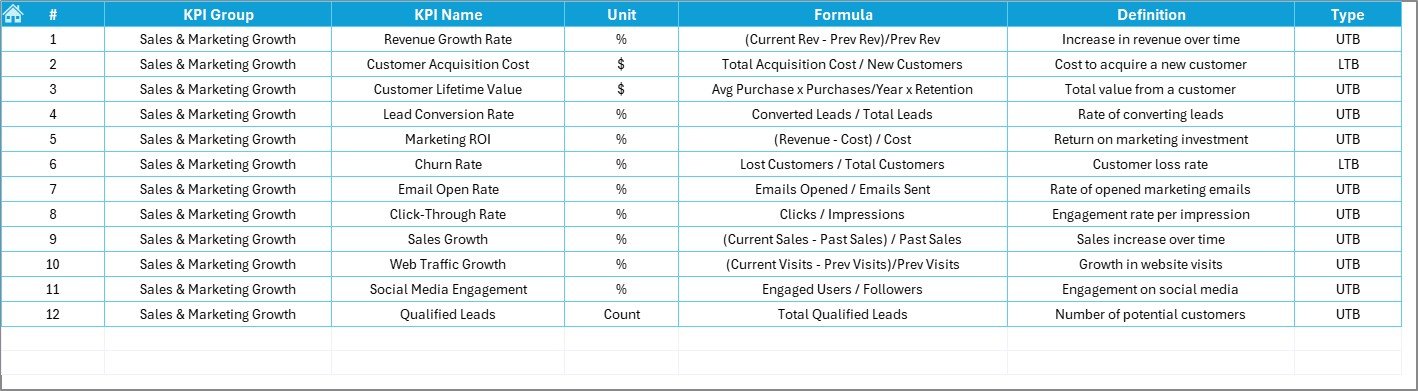
The Sales and Marketing Growth Metrics KPI Dashboard in Excel is a powerful tool designed to help sales and marketing teams track and analyze key performance indicators (KPIs) that drive business growth. Whether you’re a small business owner or part of a large organization, this dashboard provides the essential metrics to evaluate the effectiveness of your sales and marketing campaigns and drive better decision-making.
This Excel-based dashboard allows you to monitor sales performance, marketing efforts, and customer acquisition costs in real-time. By tracking KPIs such as lead conversion rates, return on investment (ROI), sales revenue, and customer engagement, you can identify trends, optimize strategies, and improve your overall sales and marketing performance.
Key Features of the Sales and Marketing Growth Metrics KPI Dashboard in Excel
📊 Sales Performance Monitoring
Track key sales metrics such as revenue, growth rate, and customer acquisition. Gain insights into your sales team’s performance and the effectiveness of your sales strategies.
📈 Marketing Campaign Effectiveness
Monitor the performance of marketing campaigns by analyzing key metrics such as click-through rates (CTR), cost per lead (CPL), and return on investment (ROI). Identify high-performing campaigns and optimize marketing spend.
🔑 Lead Conversion Tracking
Track the conversion of leads into customers and measure the effectiveness of your lead nurturing strategies. This feature helps identify areas for improvement in your sales funnel.
📅 Time-Based Performance Analysis
Track sales and marketing performance over different time periods—daily, weekly, monthly, or quarterly. This allows you to assess long-term trends and make data-driven decisions based on seasonal or periodical variations.
📉 Customer Acquisition Cost (CAC) Analysis
Monitor the cost of acquiring new customers, which is crucial for optimizing marketing spend and improving profitability. Analyze the efficiency of your marketing efforts and ensure that customer acquisition costs are sustainable.
⚙️ Customizable KPIs & Metrics
Customize the dashboard to include KPIs that are most relevant to your business goals. Whether it’s focusing on specific marketing channels or tracking different stages of the sales process, the dashboard is flexible to suit your needs.
Why You’ll Love the Sales and Marketing Growth Metrics KPI Dashboard in Excel
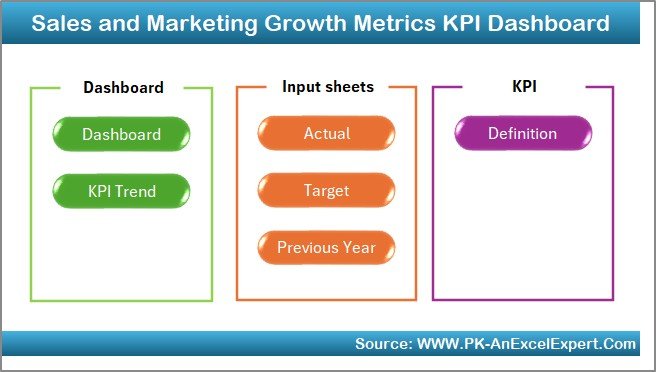
✅ Track Sales & Marketing Performance in One Place
Monitor your sales and marketing activities with ease. Track revenue, conversion rates, marketing ROI, and customer acquisition costs all in one dashboard.
✅ Optimize Marketing Campaigns
Identify which marketing campaigns are driving the most value, and allocate your budget to the most successful channels. Maximize the impact of your marketing efforts by analyzing performance data.
✅ Increase Lead Conversion
Track your lead conversion rate and optimize your sales funnel. Identify and eliminate bottlenecks, improving your overall conversion rate and sales performance.
✅ Make Data-Driven Decisions
Use real-time data to make informed decisions about sales and marketing strategies. With accurate performance data at your fingertips, you can drive your business towards its growth targets.
✅ Customizable for Your Business
Whether you’re a small business or part of a larger organization, this dashboard is fully customizable to suit your unique sales and marketing needs. Add or remove KPIs and adjust metrics to align with your goals.
What’s Inside the Sales and Marketing Growth Metrics KPI Dashboard in Excel?
Sales Performance Tracking: Track revenue, growth rates, and sales team performance.
Marketing Campaign Effectiveness: Monitor click-through rates, ROI, and CPL for marketing campaigns.
Lead Conversion Tracking: Measure the conversion of leads into customers.
Customer Acquisition Cost (CAC) Analysis: Track the cost of acquiring new customers.
Time-Based Performance Monitoring: Analyze sales and marketing performance over different time periods.
Customizable KPIs: Adapt the dashboard to your specific business needs and goals.
How to Use the Sales and Marketing Growth Metrics KPI Dashboard in Excel
1️⃣ Download the Template: Get access to the Sales and Marketing Growth Metrics KPI Dashboard in Excel instantly.
2️⃣ Input Sales & Marketing Data: Enter key sales and marketing data such as revenue, costs, and lead conversion rates.
3️⃣ Monitor KPIs & Performance: Track key metrics such as ROI, conversion rates, and CAC in real time.
4️⃣ Analyze Trends & Insights: Use time-based analysis to track long-term trends and performance.
5️⃣ Optimize Strategies: Make data-driven decisions to optimize sales and marketing strategies for business growth.
Who Can Benefit from the Sales and Marketing Growth Metrics KPI Dashboard in Excel?
🔹 Sales & Marketing Teams
🔹 Business Owners & Founders
🔹 Digital Marketers & Marketing Agencies
🔹 Data Analysts & Performance Managers
🔹 E-commerce Businesses & Online Retailers
🔹 Small & Medium Enterprises (SMBs)
🔹 Large Corporations with Sales & Marketing Departments
Optimize your sales and marketing efforts with the Sales and Marketing Growth Metrics KPI Dashboard in Excel. Track performance, improve conversion rates, and drive business growth with data-driven insights.
Click here to read the Detailed blog post
Visit our YouTube channel to learn step-by-step video tutorials
Youtube.com/@PKAnExcelExpert
Compatibility and Requirements
- Works in Microsoft Excel desktop (Excel 2016 or later, or Microsoft 365).
- You enter your own sales and marketing figures in the workbook; no add-ins are needed.
- New to Excel charts? Microsoft explains the basics in Create a chart from start to finish.
Frequently Asked Questions
Which KPIs does the Sales and Marketing Growth Metrics KPI Dashboard track?
Revenue, growth rate, click-through rate (CTR), cost per lead (CPL), ROI, lead conversion rate and customer acquisition cost (CAC).
Can I look at different time periods?
Yes. Performance can be reviewed by day, week, month or quarter to show long-term trends.
Can I add or remove KPIs?
Yes. You can add or remove KPIs and adjust metrics to match your goals.
What data do I need to enter?
Sales and marketing data such as revenue, costs and lead conversion figures.
Related Sales and Marketing KPI Templates
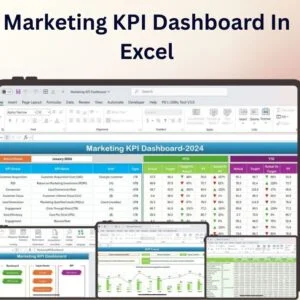
- Marketing KPI Dashboard in Excel: a marketing-only KPI view
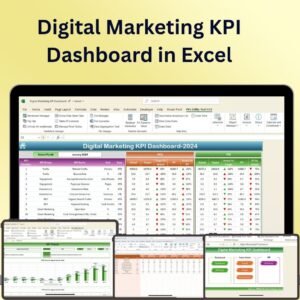
- Digital Marketing KPI Dashboard in Excel: online channel KPIs
- Retail and E-commerce Growth Metrics KPI Dashboard in Excel: growth metrics for online and retail sellers
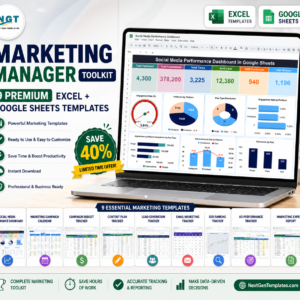
- Marketing KPI Dashboard in Google Sheets: a shared online version
- Marketing and Social Media Analytics Kit: 7 marketing templates in one bundle
Browse all Excel KPI dashboards or the Excel sales and marketing templates.





Reviews
There are no reviews yet.