

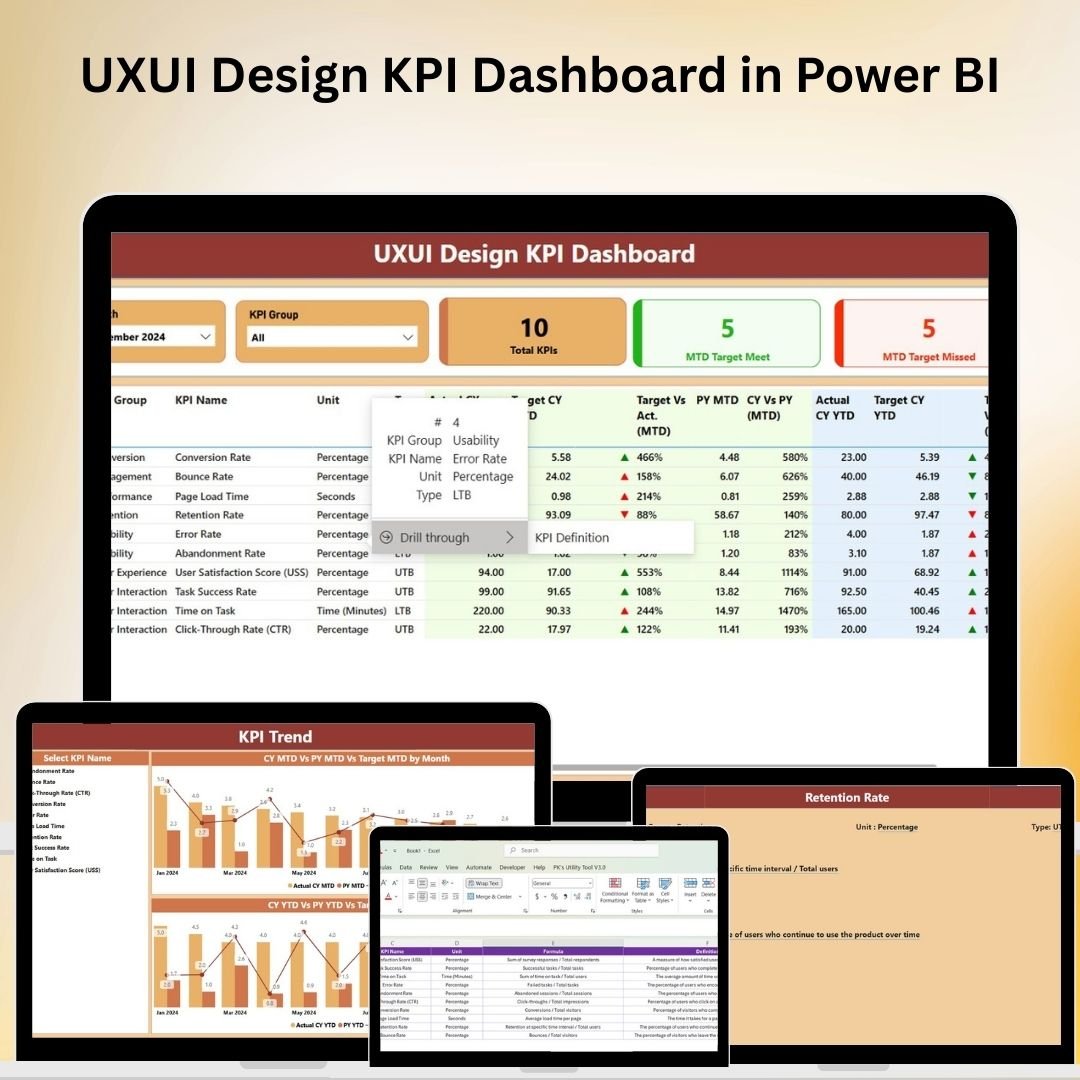





The UXUI Design KPI Dashboard in Power BI is an essential tool for organizations looking to monitor and enhance the performance of their user experience and interface design processes. This interactive dashboard consolidates key performance indicators (KPIs) into a single, dynamic interface, enabling data-driven decisions that drive continuous improvement in design workflows and user satisfaction.
With Power BI’s advanced visualizations, teams can easily track progress, identify areas for improvement, and adjust strategies accordingly to optimize UX/UI outcomes.

Key Features of the UX/UI Design KPI Dashboard in Power BI
📊 Interactive Summary Page
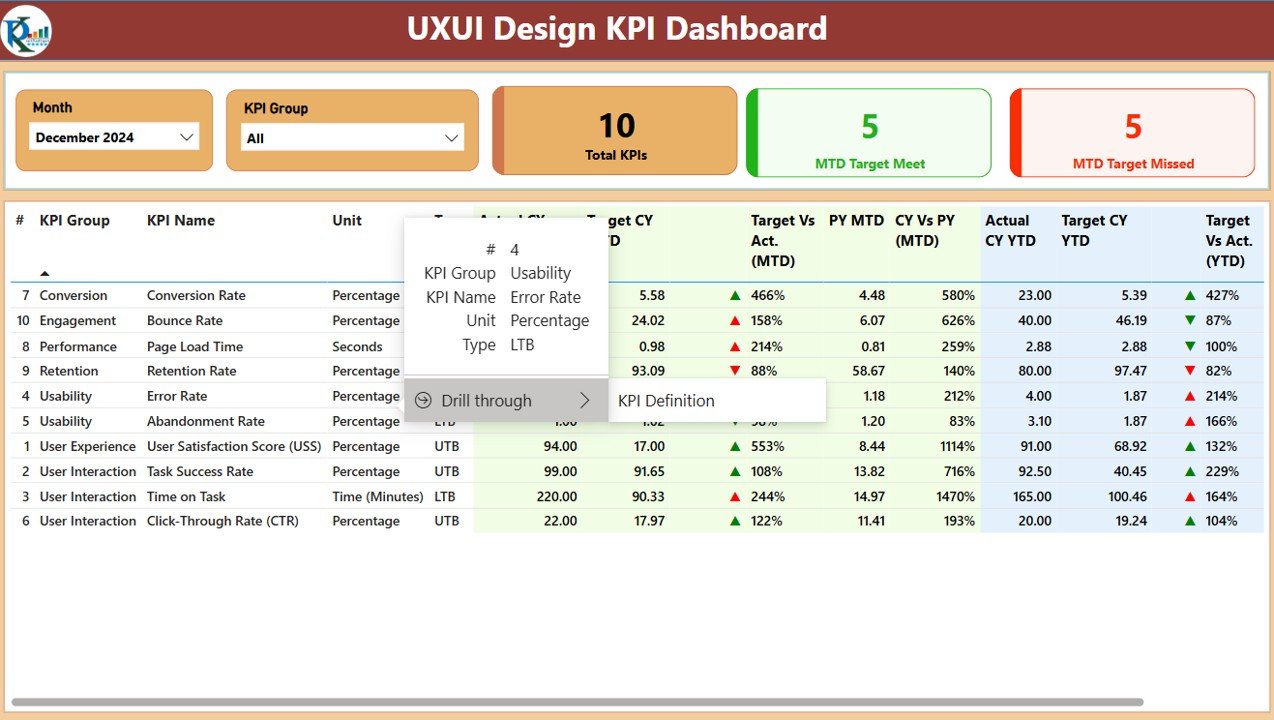
Month and KPI Group Slicers: Filter the data by specific months or KPI categories to focus on the most relevant design performance metrics.
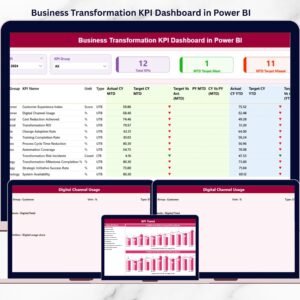
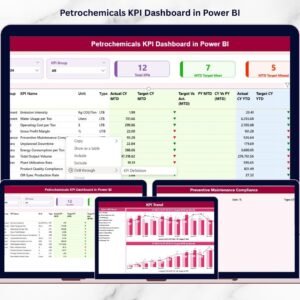
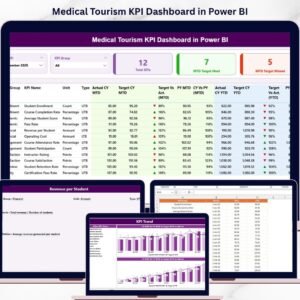
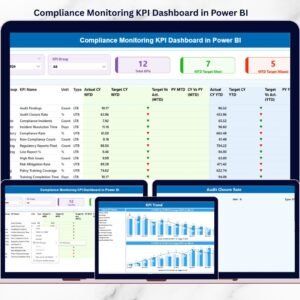
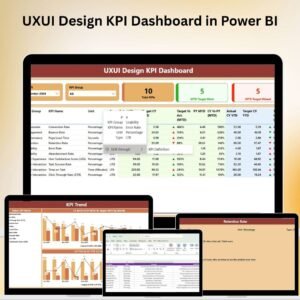
Key Metrics Cards: View essential metrics at a glance, including the total number of KPIs tracked, KPIs meeting targets (Month-to-Date), and those falling short, giving a quick snapshot of performance.
Detailed KPI Table: View in-depth data such as KPI identifiers, categories, names, measurement units, performance types (whether lower or upper values are better), actual vs. target values, and comparisons to the previous period. The table also includes conditional formatting for immediate visual identification of issues.
📈 Comprehensive KPI Analysis
KPI Trend Tracking: Monitor how each design-related KPI performs over time, comparing actual data with targets and past periods, ensuring that improvements are being made consistently.
KPI Definitions and Formulas: Each KPI includes detailed definitions and calculation formulas, helping design teams understand what each metric represents and how it contributes to overall UX/UI goals.
🔧 Customizable Dashboard
Dynamic Data Filters: Easily modify the dashboard’s filters to adjust the data view based on your specific needs or preferences, whether you’re focusing on particular UX/UI design stages, periods, or design outcomes.
Tailored KPI Tracking: Customize the dashboard to include KPIs specific to your UX/UI design team, such as user feedback scores, interface usability scores, page load times, and conversion rates.
💻 Real-Time Collaboration and Accessibility
Cloud-Based Sharing: With Power BI’s cloud features, share the dashboard in real-time with stakeholders across departments, ensuring everyone stays informed about UX/UI design performance.
Collaboration Tools: Power BI allows team members to comment and discuss insights directly within the platform, promoting collaborative decision-making and problem-solving.
Benefits of Using the UX/UI Design KPI Dashboard in Power BI
✅ Enhanced Design Performance Tracking
Centralize all UX/UI performance data in one place, making it easy to track trends, identify bottlenecks, and align design efforts with business objectives.
✅ Data-Driven Decision-Making
With real-time access to critical KPIs and trends, your design team can make informed decisions that improve user experience, optimize interface design, and drive user engagement.
✅ Improved User Satisfaction
By constantly monitoring UX/UI KPIs, you can identify areas that impact user satisfaction and work towards refining and optimizing design elements for better user interaction.
Getting Started with Your UX/UI Design KPI Dashboard in Power BI
Set Up Your KPIs: Define the most relevant KPIs for your UX/UI design process, such as user experience scores, page load time, conversion rates, and usability feedback.
Customize the Dashboard: Use the template to customize the dashboard layout, including which KPIs to track and how to display them visually for easy understanding.
Input Data: Regularly input data related to design metrics, such as survey results, usage data, and conversion tracking to keep the dashboard updated.
Monitor Progress: Use the dashboard to monitor UX/UI performance trends, assess the effectiveness of design improvements, and identify areas for further optimization.
Share and Collaborate: Share the dashboard with team members and stakeholders, and collaborate on how to address any issues or opportunities highlighted by the data.
By implementing the UX/UI Design KPI Dashboard in Power BI, your team can streamline performance monitoring, ensure a consistent user experience, and make data-driven decisions that enhance design effectiveness and user satisfaction.
Click here to read the Detailed blog post
UX/UI Design KPI Dashboard in Power BI
Visit our YouTube channel to learn step-by-step video tutorials
YouTube.com/@PKAnExcelExpert
Compatibility and Requirements
- Opens in Power BI Desktop, which is free to download from Microsoft.
- Microsoft explains the download in Get Power BI Desktop.
Who Uses This Dashboard
UX and UI design teams, product managers and stakeholders who track user feedback scores, usability scores, page load times and conversion rates.
Frequently Asked Questions
How do I filter the data?
Use the Month and KPI Group slicers on the summary page.
What do the cards show?
The total number of KPIs, the KPIs meeting their month-to-date targets and those falling short.
What is in the KPI table?
Each KPI’s group, name, unit, type (lower or upper is better), actual and target values, and the comparison with the previous period.
Can I see each KPI’s formula?
Yes. Each KPI has a definition and calculation formula.
Is there an Excel or Google Sheets version?
Yes. See the UX/UI Design KPI Dashboard in Excel and the UX/UI Design KPI Dashboard in Google Sheets.
Related Design Templates
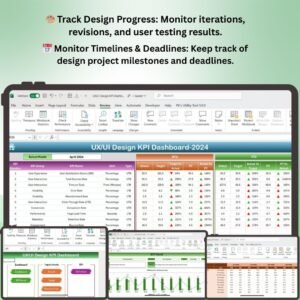
- UX/UI Design KPI Dashboard in Excel: the same KPIs in Excel
- UX/UI Design KPI Dashboard in Google Sheets: the Google Sheets edition
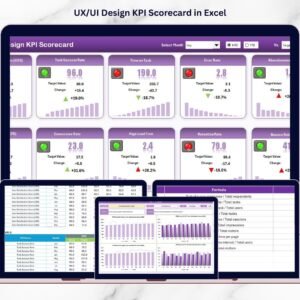
- UX/UI Design KPI Scorecard in Excel: a scorecard view of UX/UI KPIs
- Graphic Design KPI Dashboard in Power BI: KPIs for graphic design teams
- Power BI Dashboard Mega Collection: 15 Power BI dashboards in one download
Browse all Power BI KPI dashboards.



Reviews
There are no reviews yet.