

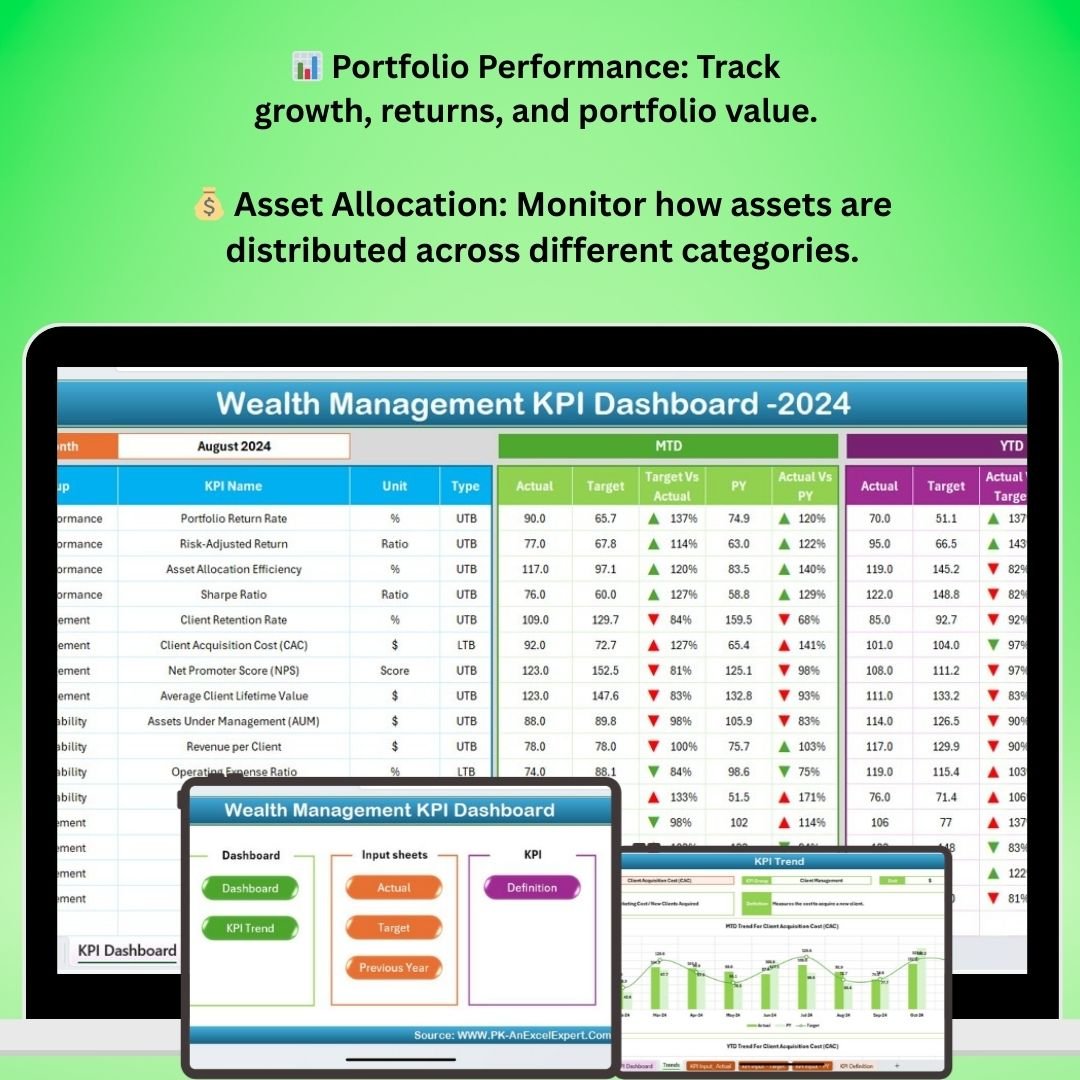
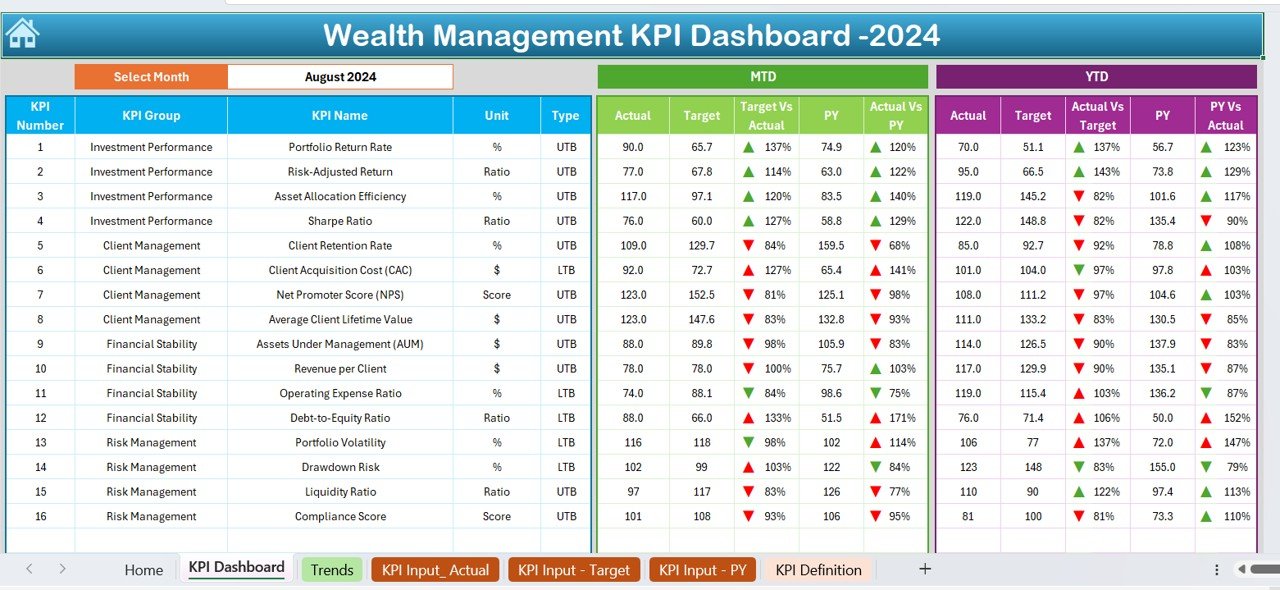
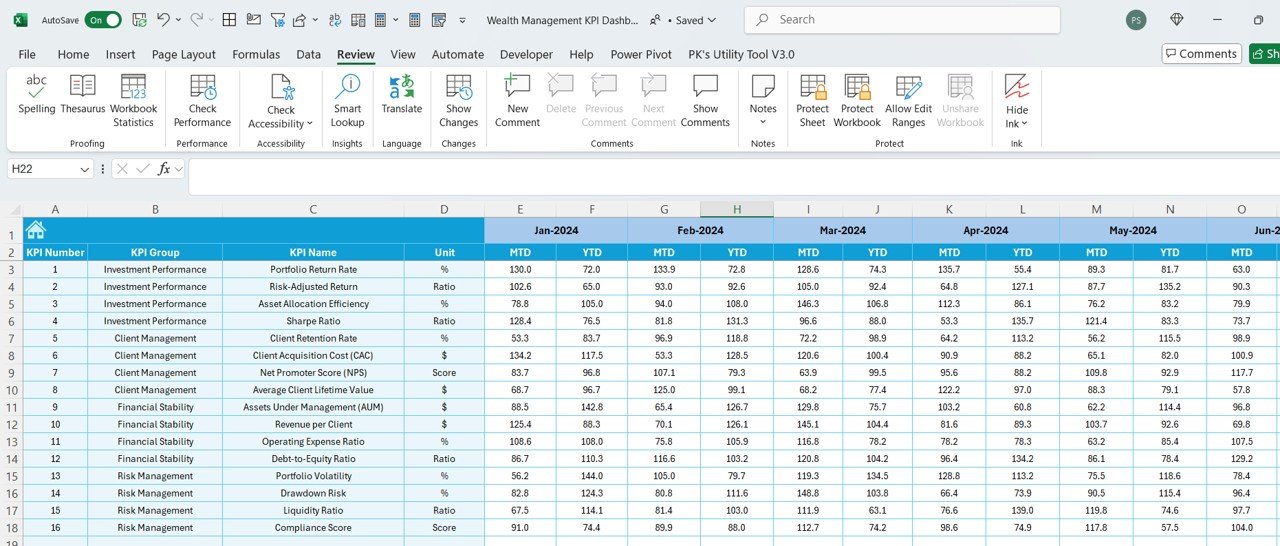
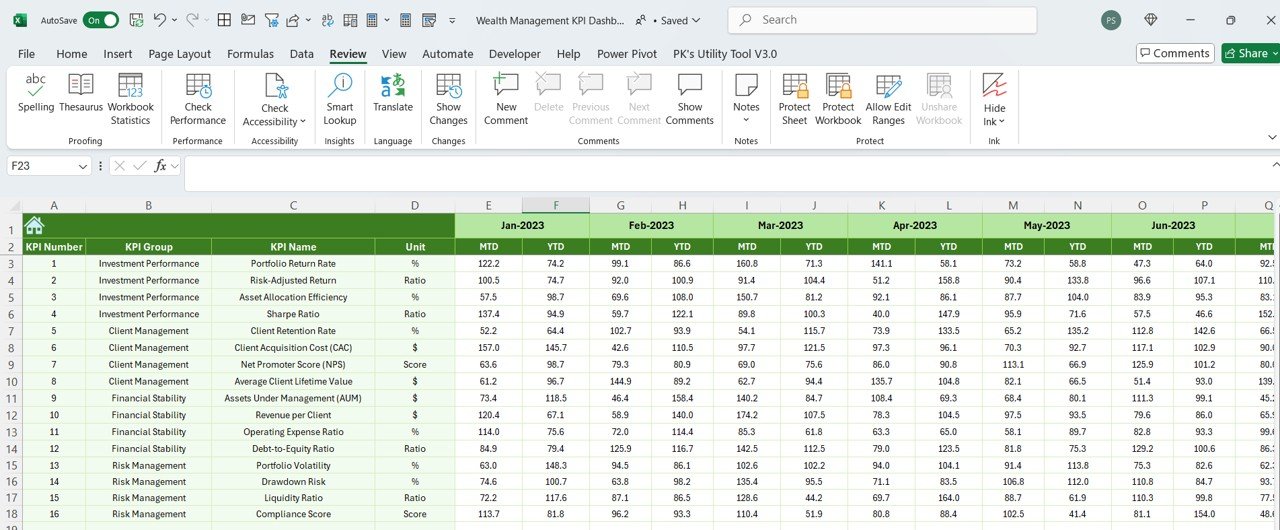
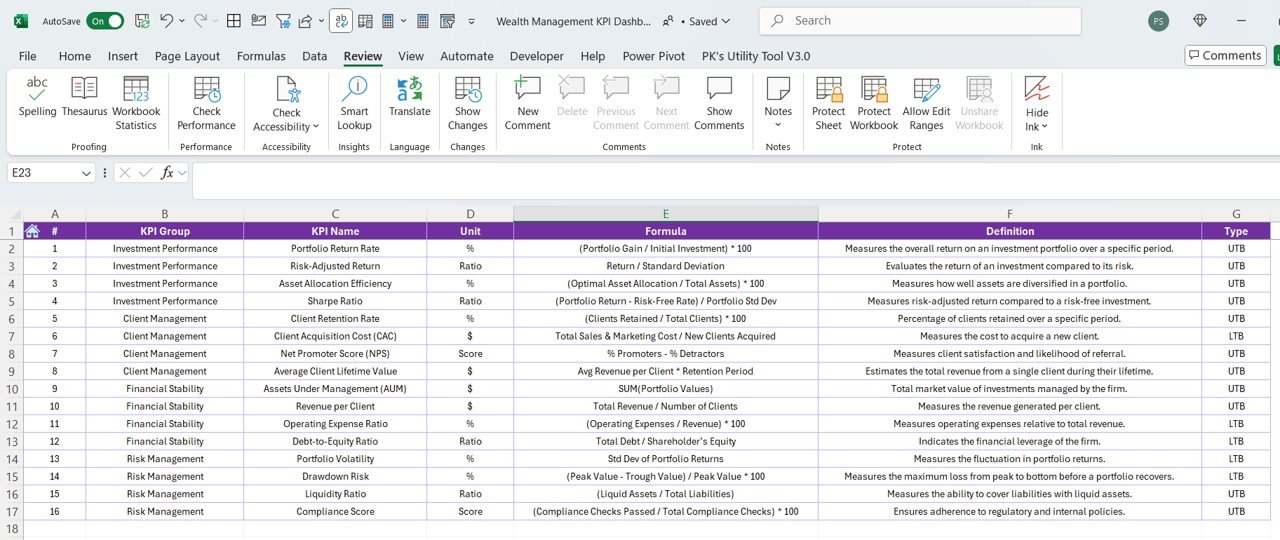

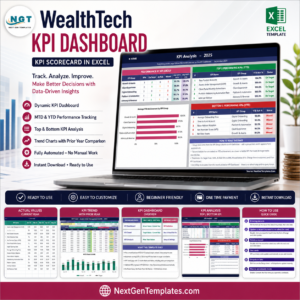
The Wealth Management KPI Dashboard in Excel is a comprehensive and powerful tool designed to help wealth managers, financial advisors, and investment professionals track key performance indicators (KPIs) for managing client wealth. This Excel-based dashboard allows you to monitor investment performance, asset allocation, portfolio growth, and other vital metrics to ensure that wealth management strategies are aligned with client goals and expectations.
The dashboard is perfect for financial advisors who want to keep their clients’ portfolios on track, analyze returns, and make data-driven decisions to optimize wealth growth. With easy-to-use charts, customizable KPIs, and time-based performance tracking, this tool helps you deliver personalized wealth management solutions that are both effective and transparent.
Key Features of the Wealth Management KPI Dashboard in Excel
📊 Portfolio Performance Tracking
Monitor the performance of your clients’ portfolios over time. Track key metrics such as portfolio value, growth, and returns. Compare the performance of individual assets within the portfolio and evaluate how well they are performing against market benchmarks.
💰 Asset Allocation Monitoring
Track how assets are distributed across various investment categories (e.g., stocks, bonds, real estate, etc.). Ensure proper diversification by analyzing asset allocation and making adjustments based on market conditions.
📈 Investment Return Analysis
Track the returns on each asset and evaluate the overall return on investment (ROI). This helps assess whether the investment strategies are achieving the desired outcomes and meeting client goals.
⚖️ Risk & Return Ratio Assessment
Monitor the risk-to-reward ratio of investments to ensure that clients’ portfolios are balanced and aligned with their risk tolerance. Use key metrics like volatility, beta, and Sharpe ratio to assess investment risk levels.
📅 Time-Based Performance Analysis
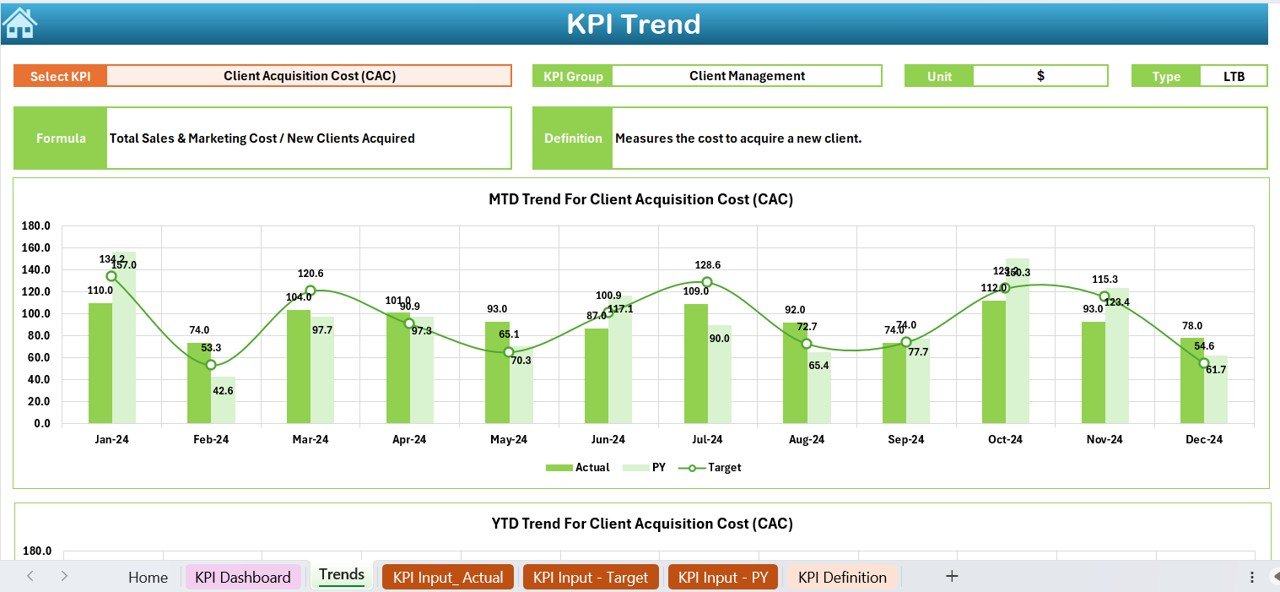
Evaluate how the portfolio has performed over various time periods (e.g., monthly, quarterly, yearly). This feature helps you identify trends, assess long-term growth, and make informed decisions about future investments.
⚙️ Customizable KPIs & Metrics
Tailor the dashboard to track the KPIs most relevant to your clients’ financial goals. Add or remove metrics based on asset types, investment objectives, and the client’s unique wealth management strategy.
Why You’ll Love the Wealth Management KPI Dashboard in Excel
✅ Comprehensive Portfolio Tracking
Keep track of your clients’ investments and portfolio performance in one easy-to-use dashboard. Monitor growth, returns, and asset allocation for a complete view of portfolio health.
✅ Optimize Investment Strategies
Use the data to optimize portfolio allocation and make adjustments to maximize returns. Analyze investment performance to make informed decisions that benefit your clients’ wealth.
✅ Monitor Risk & Return
Ensure that your clients’ portfolios are balanced and meet their risk tolerance. Track risk and return ratios to maintain a healthy balance between growth and safety.
✅ Time-Based Analysis for Better Insights
Analyze how investments are performing over different time periods. Spot trends, identify areas of improvement, and refine investment strategies to ensure long-term success.
✅ Tailored to Your Clients’ Needs
The dashboard is highly customizable to track the most relevant KPIs based on your clients’ financial goals and risk profiles. Whether you’re managing retirement portfolios or wealth growth, this tool can adapt to your specific needs.
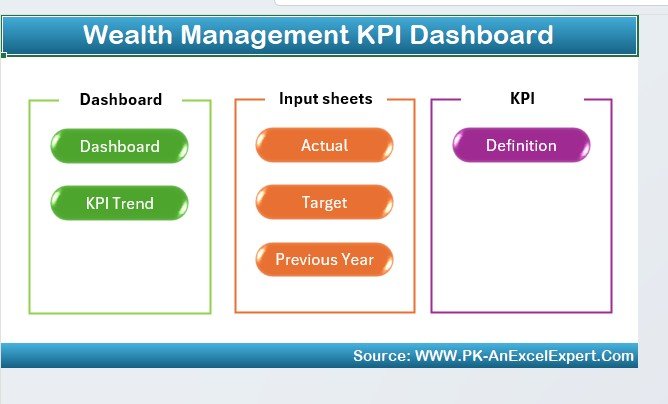
What’s Inside the Wealth Management KPI Dashboard in Excel?
- Portfolio Performance Monitoring: Track the overall growth and performance of investment portfolios.
- Asset Allocation Tracking: Monitor how assets are allocated across different categories and ensure diversification.
- Investment Return Tracking: Analyze returns on various assets and calculate overall ROI.
- Risk & Return Ratio Monitoring: Track risk-to-reward ratios and adjust strategies based on client risk tolerance.
- Time-Based Performance Analysis: Evaluate performance over different time periods for better decision-making.
- Customizable KPIs & Metrics: Tailor the dashboard to fit your clients’ wealth management needs.
How to Use the Wealth Management KPI Dashboard in Excel
1️⃣ Download the Template: Instantly access the Wealth Management KPI Dashboard in Excel.
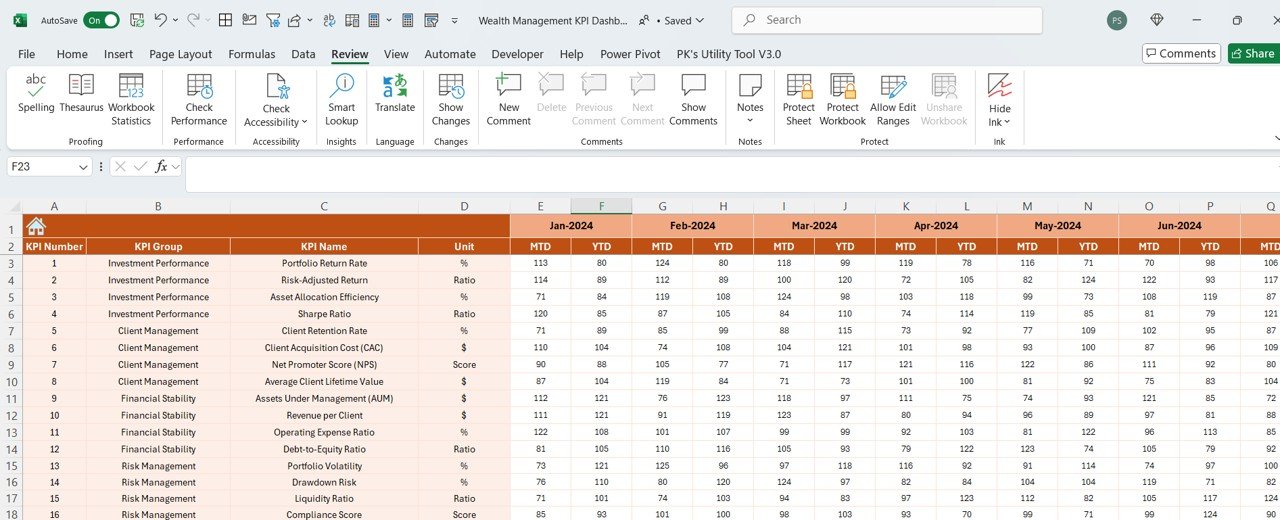
2️⃣ Input Portfolio Data: Enter data for each client’s investment portfolio, including assets, values, and returns.
3️⃣ Track KPIs & Performance: Monitor key performance metrics such as portfolio growth, ROI, and asset allocation.
4️⃣ Assess Risk & Return: Evaluate the risk and return of each investment and the overall portfolio.
5️⃣ Optimize Wealth Management Strategies: Use insights from the dashboard to make data-driven decisions that optimize portfolio growth and achieve client goals.
Who Can Benefit from the Wealth Management KPI Dashboard in Excel?
🔹 Wealth Managers & Financial Advisors
🔹 Investment Managers & Consultants
🔹 Financial Institutions & Banks
🔹 E-commerce & Retail Businesses with Investment Needs
🔹 Small & Medium Businesses (SMBs) with Retirement Plans
🔹 Large Corporations & High-Net-Worth Individuals
🔹 Data Analysts & Business Consultants in Financial Services
Ensure that your clients’ investments are performing at their best with the Wealth Management KPI Dashboard in Excel. Track portfolio growth, monitor returns, and optimize asset allocation strategies to help your clients meet their financial goals.
Click here to read the Detailed blog post
Visit our YouTube channel to learn step-by-step video tutorials
Youtube.com/@PKAnExcelExpert












Reviews
There are no reviews yet.