

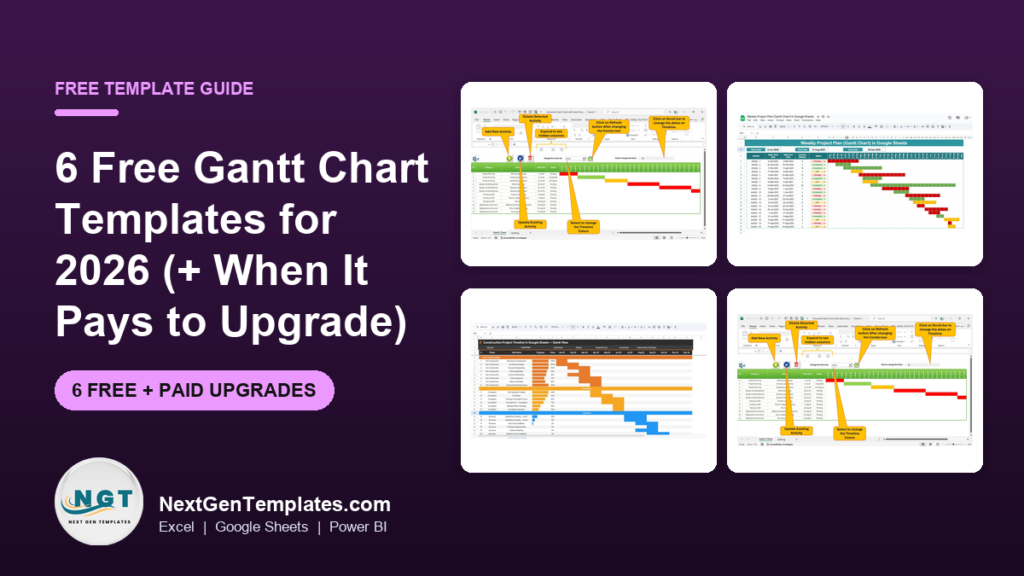
The best free Gantt chart Excel template depends on how much setup you accept. Microsoft Create and Vertex42 give ready-made files at no cost, and a stacked bar chart builds one in about 15 minutes. When you need a data entry form or task dependencies, the Pro Gantt Chart in Excel costs $9.99.
Last updated: November 2026
Key takeaways
- Six free routes exist for a Gantt chart: Microsoft Create, Vertex42, Smartsheet, the Google Sheets template gallery, a DIY stacked bar chart and a DIY conditional-formatting grid.
- A hand-built stacked bar Gantt in Excel takes roughly 15 minutes for 5 tasks and needs no macros.
- Free templates break down at around 30 to 50 tasks, when you edit dates by hand and dependencies live only in your head.
- The Pro Gantt Chart in Excel with data entry form costs $9.99 and adds a form, status tracking and dependencies.
- For Google Sheets users, the Weekly Project Plan (Gantt Chart) costs $6.99 and the Project Gantt Chart in Google Sheets costs $12.99.
 Launch offer
From your first Pivot Table to the Data Model, DAX, Power Query and a one-page KPI dashboard. 11h 51m of video by PK, with practice files, quizzes and a capstone.
Which free Gantt chart Excel templates are worth using? (compared)
| Template | Format | Best For | Price |
|---|---|---|---|
| Microsoft Create Gantt templates (Best overall, free) | Excel | Fast start from a ready file | Free |
| Vertex42 Gantt templates | Excel | Editable files with tweakable timelines | Free |
| Smartsheet Gantt templates | Excel, Google Sheets | Teams that may move to Smartsheet later | Free |
| Google Sheets template gallery | Google Sheets | Shared plans with no installs | Free |
| DIY stacked bar Gantt | Excel | Learning how Gantt charts work | Free |
| DIY conditional-formatting Gantt | Excel, Google Sheets | Weekly or daily grids | Free |
| Pro Gantt Chart in Excel with data entry form (Best value) | Excel (macro-enabled) | Project managers who want forms and dependencies | $9.99 |
| Weekly Project Plan (Gantt Chart) in Google Sheets | Google Sheets | Simple weekly timelines | $6.99 |
| Construction Project Timeline in Google Sheets | Google Sheets | Construction schedules, budget and inspections | $6.99 |
| Project Gantt Chart in Google Sheets | Google Sheets | Teams needing a KPI dashboard and workload view | $12.99 |
| Project Timeline Dashboard in Excel | Excel (macro-enabled) | Milestone reporting by status and priority | $17.99 |
| Manufacturing Project Timeline KPI Dashboard in Excel | Excel | Production projects and resource tracking | $12.99 |
How we picked these
We started with the free Gantt sources people already search for and split them by what each one asks of you: download and edit, build it yourself, or share online. The six free routes are the ones that are well known and stable. We left out random blog downloads we cannot vouch for, and we do not link to any file we have not seen.
For the paid upgrades we looked through the Next Gen Templates catalog for Gantt and project timeline products and kept six with a clear Gantt or timeline view. Prices are the current USD prices on each product page. Check each free source’s own terms before using its files for client work.
What are the 6 best free Gantt chart templates for 2026?
1. Microsoft Create Gantt templates: best overall free option
Microsoft publishes ready-made Gantt chart and project planner files on Microsoft Create, and Excel’s own New screen lists similar planners. They open in Excel, so there is nothing to install.
Who it is for: anyone who wants a working chart today and does not mind editing cells by hand.
- A task table with start dates and durations
- A timeline grid that shades bars from those dates
- Usually a scrolling start-week control, depending on the file you choose
Use cases: a 6-week website refresh, a 12-week product launch, a wedding plan with 20 tasks, a school term project with 8 milestones.
Price: free. Best for: a quick, no-cost first Gantt in Excel.
2. Vertex42 Gantt templates: best free option for tweaking
Vertex42 has long offered free spreadsheet templates, and its Gantt files are among the most downloaded. They are plain Excel workbooks, so you can see and change the formulas.
Who it is for: people who like to adjust formulas, colors and date scales.
- Task, start, duration and percent-complete columns
- Formula-driven bars you can inspect
- Variants for different time scales, depending on the download
Use cases: a 10-task event plan, a renovation across 8 weeks, a thesis timeline over 2 semesters.
Price: free. Best for: learners who want to understand how a spreadsheet Gantt works.
3. Smartsheet Gantt templates: best free option if you may scale up
Smartsheet publishes free Gantt chart templates for Excel and Google Sheets as an entry point to its paid work management software. The files work on their own without an account in the software.
Who it is for: small teams that may later move to a paid SaaS tool.
- Spreadsheet versions for Excel and Google Sheets
- Simple project and construction layouts
- A familiar task-list-plus-timeline structure
Use cases: a client onboarding plan, a 4-phase marketing campaign, a 15-task office move.
Price: free for the template files. The Smartsheet software itself is a paid subscription, so review its pricing page before you commit. Best for: teams comparing spreadsheets with project software.
4. Google Sheets template gallery: best free option for shared plans
Google Sheets has a template gallery inside the app, reachable from Google Sheets, and it includes a Gantt chart template for project plans. Everything lives in the browser, and several people can edit at once.
Who it is for: remote teams and freelancers who share a plan with a client.
- A task list tied to a timeline chart
- Real-time editing and comments
- No installs and no macros
Use cases: a 3-person content calendar, a 6-week sprint plan, a volunteer rota for an event.
Price: free. Best for: light projects that several people update.
5. DIY stacked bar Gantt chart in Excel: best for control
You can build a Gantt chart from a normal Excel bar chart in about 15 minutes. It costs nothing and you own every part of it. The full walkthrough is below.
Who it is for: anyone who wants a chart that matches their own task list.
- One table with Task, Start and Duration
- A stacked bar chart with the Start series made invisible
- A reversed task axis so task 1 sits at the top
Use cases: a 5-task launch plan, a 20-task audit schedule, a one-page timeline for a board slide.
Price: free. Best for: small plans where you want to understand every step.
6. DIY conditional-formatting Gantt grid: best for weekly or daily plans
Put dates across the top row, then use a conditional formatting rule that fills a cell when the date falls between a task’s start and end. It works in Excel and Google Sheets and looks like a classic project calendar.
Who it is for: people planning at the day or week level who want colored cells instead of chart bars.
- A date header row, for example 14 or 52 columns
- A rule such as =AND(F$4>=$B5,F$4<=$C5)
- One extra rule per status color if you want Pending, WIP and Completed shading
Use cases: a 12-week training plan, a 30-day content sprint, a shift-based production schedule.
Price: free. Best for: compact grids you can print on one page.
How do you make a free Gantt chart in Excel with a stacked bar chart?
Here is the stacked bar method with a worked example. The plan has 5 tasks that run from 1 March 2026 to 12 April 2026.
| Task | Start | Duration (days) | End |
|---|---|---|---|
| Kickoff | 1 Mar 2026 | 3 | 3 Mar |
| Design | 4 Mar 2026 | 10 | 13 Mar |
| Build | 14 Mar 2026 | 21 | 3 Apr |
| Test | 4 Apr 2026 | 7 | 10 Apr |
| Launch | 11 Apr 2026 | 2 | 12 Apr |
- Type the table above into cells A1:C6, with real dates in column B (not text).
- Select A1:C6 and insert a Stacked Bar chart from the Insert tab. Excel plots Start first and Duration second.
- Click the Start bars, open Format Data Series and set Fill to No fill. Only the Duration bars stay visible.
- Click the vertical task axis and tick Categories in reverse order, so Kickoff is at the top.
- Click the date axis. Dates are stored as serial numbers, and 1 March 2026 is 46082. Set the axis minimum to 46082 and the maximum to 46125, which covers the 43-day span.
- Set the major unit to 7 for weekly gridlines, reduce the gap width to about 50%, and delete the legend.
- Add a column for percent complete if you want to shade finished work, using a third series.
Total span is 43 days, from 1 March to 12 April. If you change the Build duration from 21 to 28, you must also move Test and Launch by hand. That manual rework is the first sign a free chart is reaching its limit.
What are the most common mistakes in a stacked bar Gantt?
| Error | Cause | Fix |
|---|---|---|
| Bars start at 1900 or at a tiny date | Axis minimum left on Auto | Set the minimum to the first start date’s serial number |
| Tasks appear upside down | Default bar chart order | Tick Categories in reverse order |
| Start bars still visible | Fill not removed | Set the Start series to No fill |
| Dates display as numbers like 46082 | Axis uses General format | Format the axis as a date, or keep serials for clarity |
| Chart ignores new rows | Range not extended | Convert the data to an Excel Table with Ctrl+T |
| Duration wrong by one day | End minus Start excludes the last day | Use End minus Start plus 1 |
When does a free Gantt chart stop being enough?
Free templates work well for plans under about 30 tasks with one editor. Three things usually push people to upgrade.
- Data entry: editing 40 rows of dates by hand invites mistakes, and a form removes most of them.
- Dependencies: a free grid shows overlap, but it does not tell you which task blocks which.
- Reporting: a manager wants completion percentage, overdue counts and workload in one view, not a bare timeline.
These are the gaps the paid templates below address. Each is a one-time purchase, with no per-user subscription. For comparison, tools such as Microsoft Project, Asana, monday.com, ClickUp and TeamGantt charge recurring fees, so check their pricing pages against the one-time cost of a template.
Which paid Gantt templates are worth the upgrade?
Upgrade 1: Pro Gantt Chart in Excel with data entry form ($9.99)
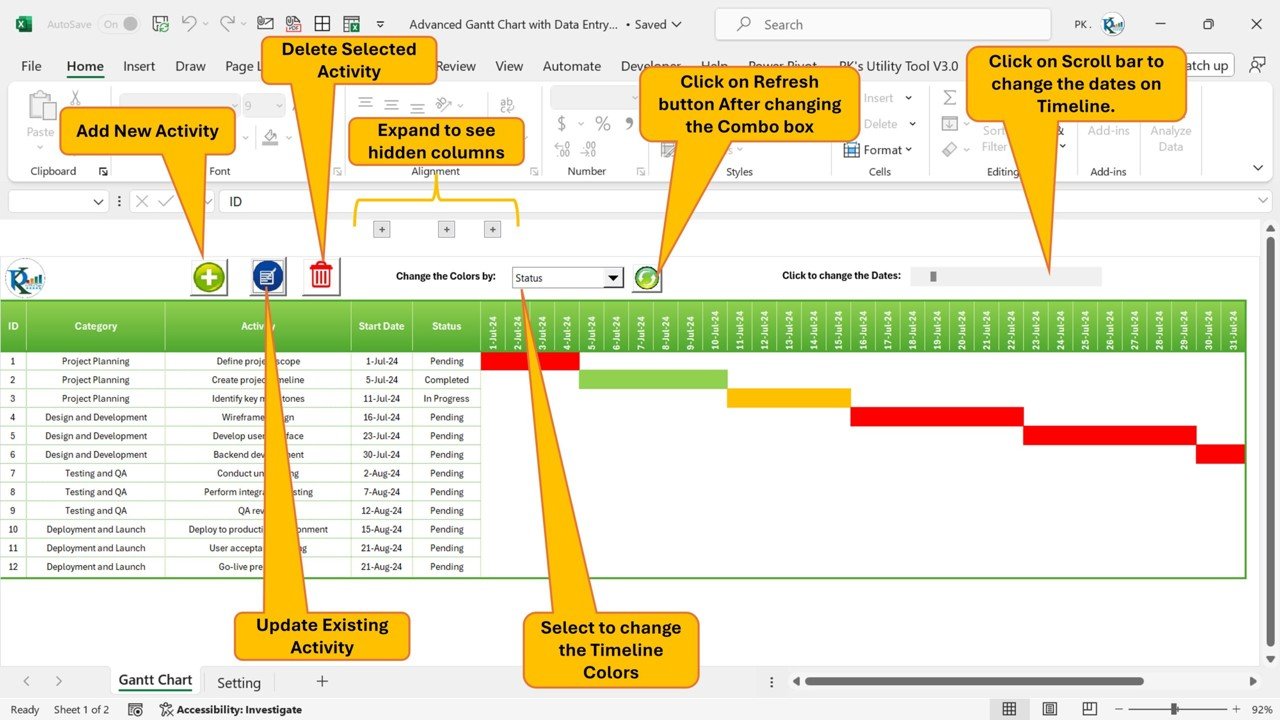
This is a macro-enabled (VBA) planner where you add, update and delete activities through a form instead of editing cells. The interactive Gantt chart updates after every change.
Who it is for: project managers, team leaders, freelancers, startup founders, students and researchers.
- Pre-filled update forms for quick edits
- Color-coding by category, status or assignee
- Automatic status tracking (Pending, In Progress, Completed) and task dependencies
- Search, filter and export to Excel
Outcome: a 40-task plan you can maintain without breaking formulas. See it on the Pro Gantt Chart in Excel page for $9.99.
Best for: the step up from a free Excel Gantt. This is the best value pick.
Upgrade 2: Weekly Project Plan (Gantt Chart) in Google Sheets ($6.99)
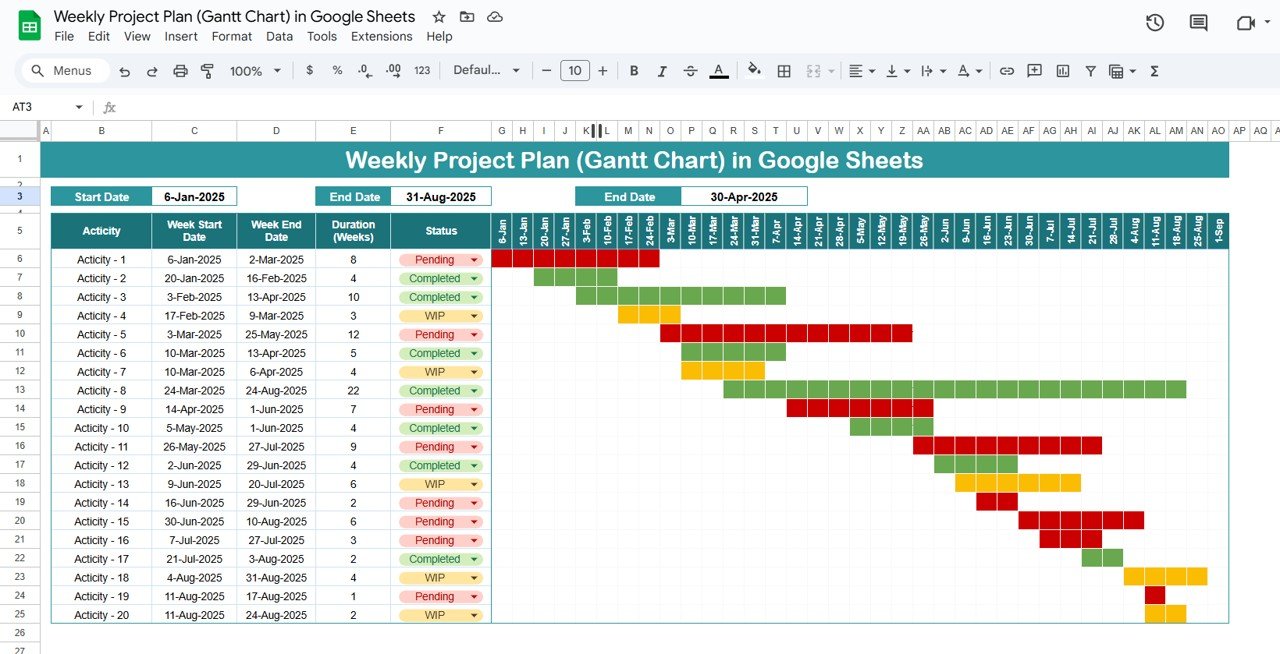
A tracker table feeds a week-by-week Gantt view. Status dropdowns (Pending, WIP, Completed) color the bars grey, yellow and green, and the timeline runs from January to September.
Who it is for: teams who want a shared, color-coded weekly plan without add-ons.
- Task name, start and end dates, and auto-calculated duration in weeks
- Dropdown status with conditional color formatting
- Duplicate rows to extend the plan
Outcome: a clear weekly view that you can share with clients in real time. The weekly Gantt chart in Google Sheets costs $6.99.
Best for: the cheapest upgrade for Google Sheets users.
Upgrade 3: Project Gantt Chart in Google Sheets ($12.99)
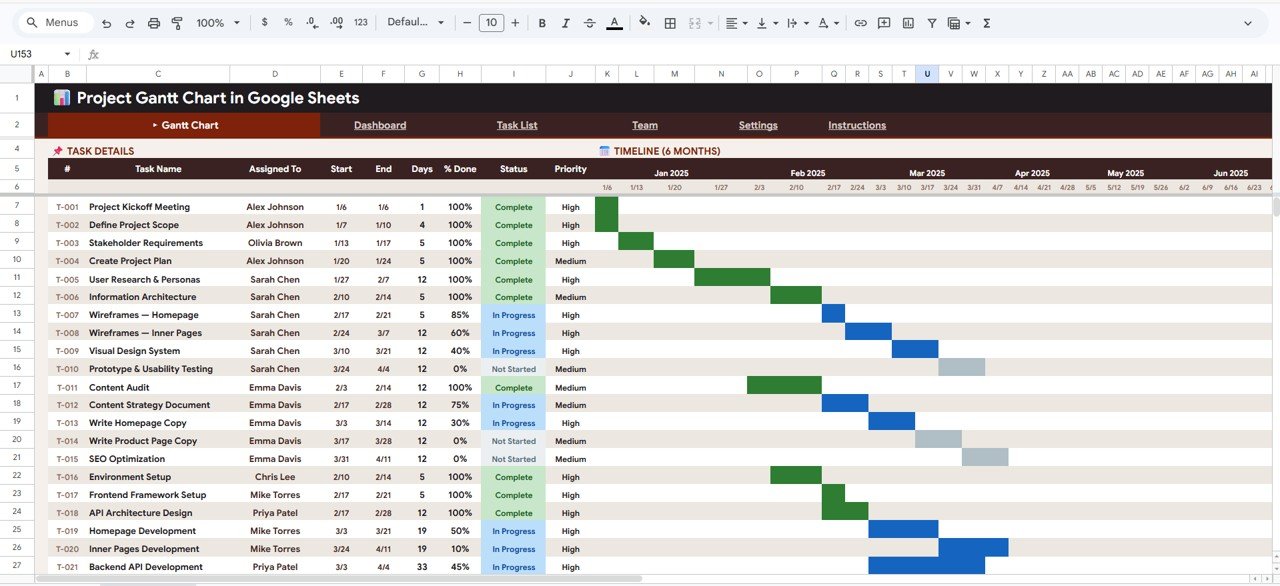
A 5-page template with a Gantt timeline, a dashboard of 10+ KPIs, dependency tracking and team workload. It uses no add-ons.
Who it is for: managers of marketing, software, construction or operations projects who report progress upward.
- Color-coded task bars on a visual timeline
- Total tasks, completion % and overdue tasks as KPIs
- Filters and slicers by phase, priority or team member
Outcome: one file that replaces a timeline, a status report and a workload sheet. The Project Gantt Chart in Google Sheets costs $12.99.
Best for: team projects that need reporting as well as a chart.
Upgrade 4: Construction Project Timeline in Google Sheets ($6.99)
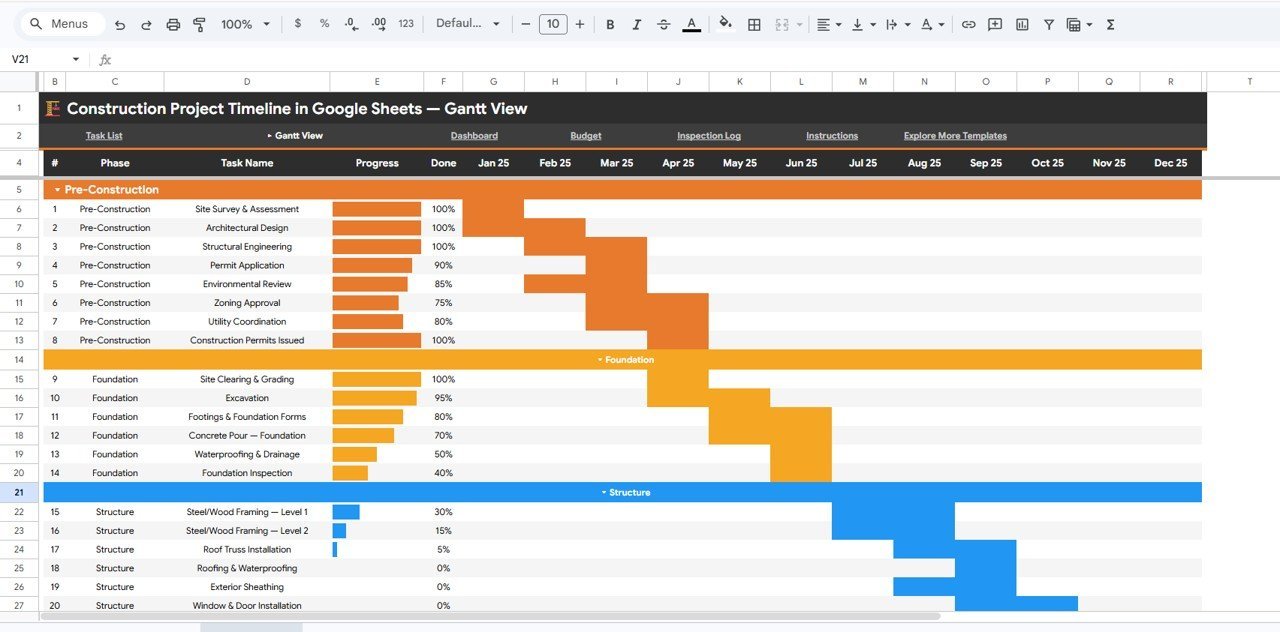
It has 5 interactive pages: Overview, Gantt View, Dashboard, Budget and Inspection Log, with 20+ charts and slicer filters on every page.
Who it is for: construction project managers and contractors.
- 5 KPI cards, including Overall Completion, Days Remaining and Budget Variance Savings
- Planned versus actual cost tracking with change orders
- Inspection records by phase, result and inspector
Outcome: schedule, cost and quality checks in one workbook. The construction project timeline in Google Sheets costs $6.99.
Best for: building projects where budget and inspections matter as much as dates.
Upgrade 5: Project Timeline Dashboard in Excel ($17.99)

A macro-enabled dashboard for milestones by date, priority and status. Buttons add, update or delete records, and the timeline and charts refresh automatically.
Who it is for: project managers who report milestones rather than manage every task.
- Dynamic timeline chart
- Status pie chart (Completed, In Progress, Pending)
- Priority doughnut chart (High, Medium, Low)
Outcome: a one-screen milestone view for single or multiple projects. The Project Timeline Dashboard in Excel costs $17.99.
Best for: milestone reporting to stakeholders.
Upgrade 6: Manufacturing Project Timeline KPI Dashboard in Excel ($12.99)

It tracks milestones and deadlines alongside production rate, progress percentage and resource utilization.
Who it is for: manufacturing managers, project coordinators and business owners.
- Milestone and due-date management by project phase
- KPI tracking for resource allocation and production rate
- Customizable KPIs, categories and input fields
Outcome: early sight of bottlenecks and idle resources. The Manufacturing Project Timeline KPI Dashboard in Excel costs $12.99.
Best for: production projects where resources are the constraint.
How do you choose between free and paid Gantt templates?
| Your situation | Pick |
|---|---|
| Under 15 tasks, one editor, Excel | Microsoft Create or Vertex42 (free) |
| You want to learn how it works | DIY stacked bar (free) |
| Shared plan in the browser | Google Sheets gallery (free) or Weekly Project Plan ($6.99) |
| 30+ tasks in Excel, dependencies needed | Pro Gantt Chart in Excel ($9.99) |
| Reporting with KPIs on Sheets | Project Gantt Chart in Google Sheets ($12.99) |
| Construction or manufacturing | Construction ($6.99) or Manufacturing ($12.99) |
Bundle versus single maths: the Pro Gantt Chart ($9.99) and the Weekly Project Plan ($6.99) together cost $16.98, which is less than the Project Timeline Dashboard ($17.99) alone. Buy the one that matches your format first.
When is a template not the right answer?
Buy or subscribe to project software instead if any of these apply.
- More than about 10 people update the plan daily and need notifications and permissions.
- You need resource leveling, critical path calculation or baselines across several linked projects. Microsoft Project or a tool like TeamGantt does this better.
- Tasks must sync automatically with email, chat or time tracking.
- Your plan changes hourly and you need a full audit trail.
A spreadsheet Gantt is a planning and reporting sheet. For a small team on a single project it is usually enough, and it costs far less than a monthly seat fee.
Planning spreadsheets can also pair with other free resources. See our list of free Excel dashboard templates for reporting, and the free invoice template for Excel roundup for billing a finished project. Teams tracking time off can use the free leave tracker in Excel, and buyers handling suppliers can look at the free purchase order templates. For vendor work, see the supplier management Excel templates, and for stock planning, the inventory management Excel templates.
Frequently asked questions
Is there a free Gantt chart template in Excel?
Yes. Microsoft Create, Vertex42 and Smartsheet all publish free Gantt chart files that open in Excel. You can also build one yourself from a stacked bar chart in roughly 15 minutes. Free files suit small plans, and paid templates start at $6.99 when you need forms or dependencies.
How do I make a Gantt chart in Excel without a template?
List tasks with start dates and durations, insert a stacked bar chart, and set the Start series to No fill. Reverse the task axis, set the date axis minimum to your first start date, and reduce the gap width. The visible Duration bars then form the Gantt timeline.
Does Excel have a built-in Gantt chart?
Excel has no dedicated Gantt chart type in its chart menu. People build one from a stacked bar chart or conditional formatting. Excel’s template search does list Gantt project planner files that are already set up, so you can start from one of those instead.
Is there a Gantt chart template in Google Sheets?
Yes. The Google Sheets template gallery includes a Gantt chart template for project plans, and Smartsheet also offers a Google Sheets version. If you want status dropdowns and weekly color coding, the Weekly Project Plan (Gantt Chart) in Google Sheets costs $6.99.
What is the difference between a free and a paid Gantt template?
Free templates usually show bars from start dates and durations, and you edit every cell by hand. Paid templates add a data entry form, status tracking, dependencies, filters or a KPI dashboard. The Pro Gantt Chart in Excel with data entry form costs $9.99 and includes these.
Can a Gantt chart show task dependencies in Excel?
A basic free Gantt shows overlap but does not link tasks. You can type a predecessor column and adjust dates yourself. The Pro Gantt Chart in Excel with data entry form identifies dependent and independent tasks, which helps you plan the sequence without manual tracking.
How many tasks can an Excel Gantt chart handle?
Excel itself handles thousands of rows, but a hand-built chart becomes hard to maintain around 30 to 50 tasks because every date change needs manual edits. Templates with a form, filters and grouped fields stay manageable at that size and above.
Do macro-enabled Gantt templates work on Mac or Excel Online?
Macro-enabled (VBA) templates, such as the Pro Gantt Chart in Excel with data entry form, are designed for desktop Excel. Excel Online does not run VBA macros. If you work mostly in the browser, a Google Sheets Gantt template is the safer choice.
Is a Gantt chart template better than project management software?
For one team and one project, a template is cheaper and quicker to set up, and you pay once. Software wins when many people collaborate, when you need critical path analysis, or when tasks must sync with other tools. Compare both against your real task count.
Get more project management templates
Start with the Pro Gantt Chart in Excel with data entry form for $9.99, our best-value upgrade from a free Excel Gantt. On Google Sheets, the Project Gantt Chart in Google Sheets is $12.99.
Watch walkthroughs on the Next Gen Templates YouTube channel.