

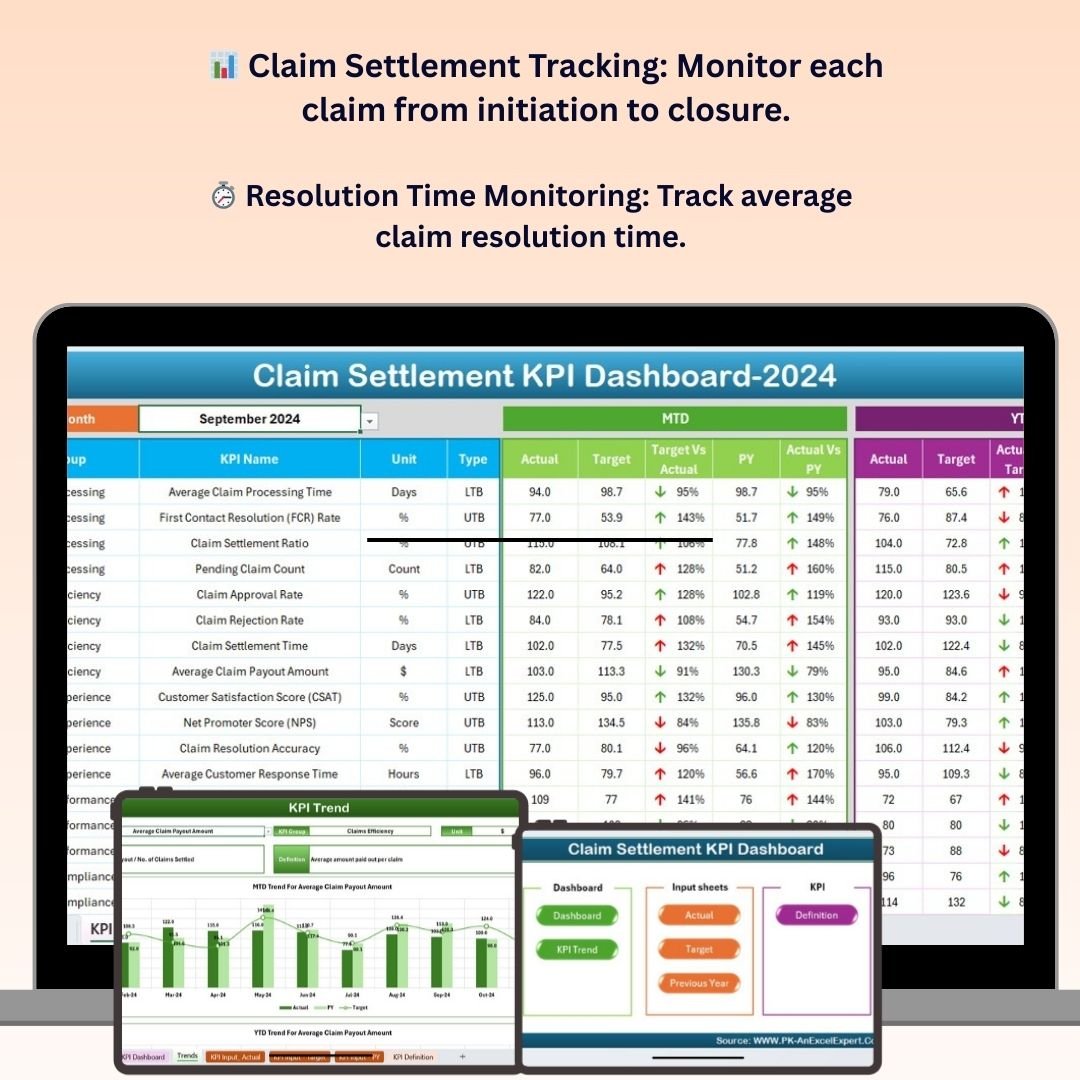
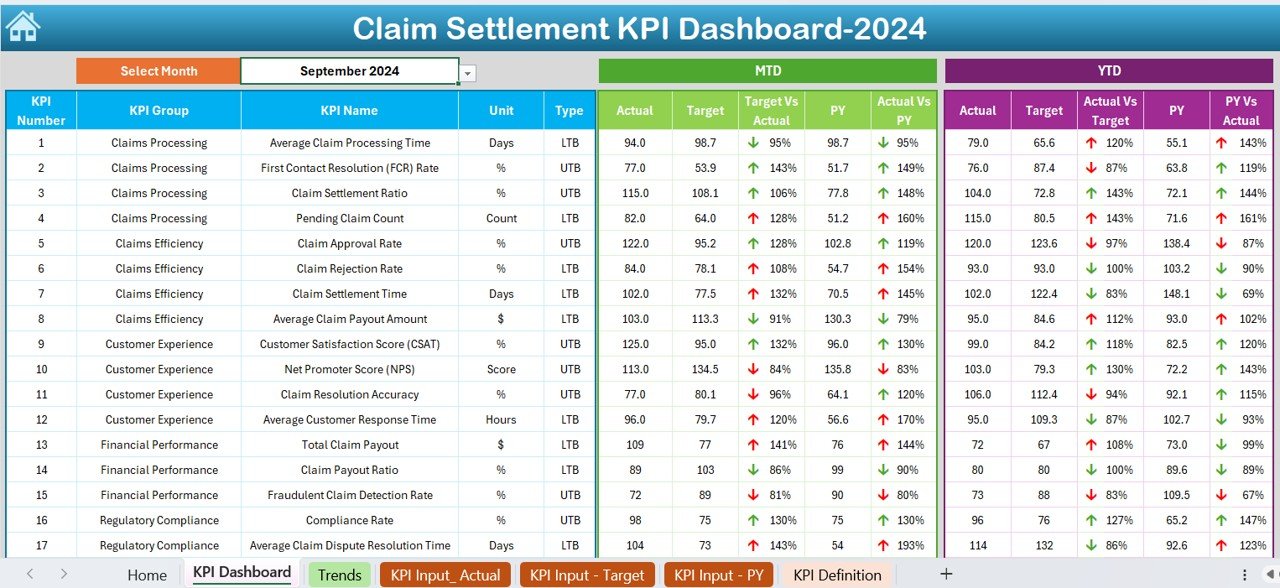




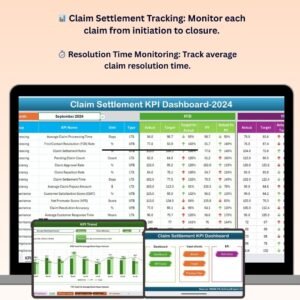
The Claim Settlement KPI Dashboard in Excel is a comprehensive tool designed to help insurance companies, claims adjusters, and customer service teams track and monitor the performance of claims settlements. This Excel-based dashboard provides real-time insights into key performance indicators (KPIs) such as claim resolution time, claim approval rates, customer satisfaction, and the overall effectiveness of your claims process.
With this dashboard, you can monitor the performance of your claims team, identify bottlenecks in the process, and make data-driven decisions to improve claim processing efficiency. Whether you’re handling insurance claims, warranty claims, or service-related claims, this tool helps streamline operations, improve response times, and optimize the overall claims settlement experience.
Key Features of the Claim Settlement KPI Dashboard in Excel
📊 Claim Settlement Tracking
Track the status of each claim from initiation to final settlement. Monitor key stages in the claims process, such as approval, assessment, payout, and closure.
⏱ Claim Resolution Time Monitoring
Track the average time it takes to resolve claims. Analyze time taken for different stages of the claims process and identify opportunities to speed up claim settlement times.
📉 Claim Approval & Denial Rates
Monitor claim approval and denial rates to evaluate the effectiveness of your claims team. Identify trends in claim approvals and denials and assess the need for adjustments in your claims process.
📅 Time-Based Performance Analysis
Monitor claim settlement performance over time, whether daily, weekly, monthly, or quarterly. Analyze trends in settlement times, claim volumes, and overall process efficiency.
🔑 Customer Satisfaction & Feedback
Track customer feedback and satisfaction scores related to the claims process. Use this data to identify areas for improvement and ensure that your customers are satisfied with the claims handling experience.
📈 Customizable KPIs & Metrics
Customize the dashboard to track the specific KPIs that are most relevant to your claims process. Add fields for additional metrics like claim types, claim value, or specific departmental performance.
Why You’ll Love the Claim Settlement KPI Dashboard in Excel
✅ Efficient Claim Tracking
Track and manage every aspect of the claims settlement process in one place. Ensure all claims are processed efficiently and nothing is overlooked.
✅ Identify Bottlenecks in the Process
Use real-time data to identify delays and bottlenecks in the claims process. Quickly make adjustments to improve efficiency and reduce claim resolution times.
✅ Improve Claim Approval & Denial Accuracy
Monitor claim approval and denial trends. Evaluate the effectiveness of your claims team and identify areas where adjustments may be necessary to improve claim processing.
✅ Enhance Customer Satisfaction
Track customer feedback and satisfaction scores. Use these insights to enhance the claims process and improve the overall customer experience.
✅ Customizable & Scalable
Tailor the dashboard to meet your specific claims process requirements. Whether you’re handling a few claims or managing a large-scale operation, this dashboard is scalable to suit your needs.
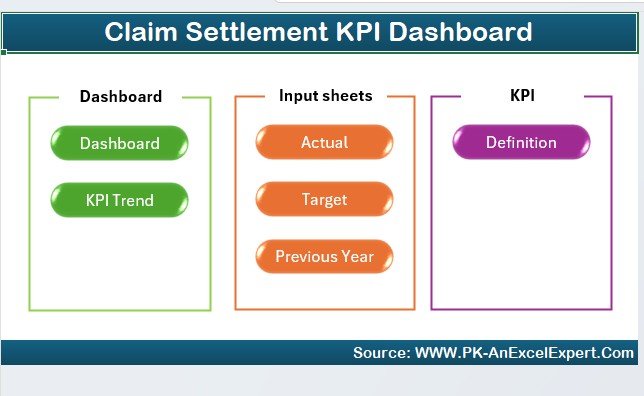
What’s Inside the Claim Settlement KPI Dashboard in Excel?
- Claim Settlement Tracking: Monitor the status of each claim through various stages.
- Resolution Time Tracking: Track how long each claim takes to resolve and identify areas for improvement.
- Claim Approval & Denial Rates: Monitor approval and denial trends to evaluate claims process effectiveness.
- Time-Based Analysis: Track performance over different time periods and identify trends.
- Customer Satisfaction & Feedback: Track customer satisfaction scores related to claims handling.
- Customizable KPIs & Metrics: Adjust the dashboard to reflect your unique claims metrics and needs.
How to Use the Claim Settlement KPI Dashboard in Excel
1️⃣ Download the Template: Access the Claim Settlement KPI Dashboard in Excel instantly.
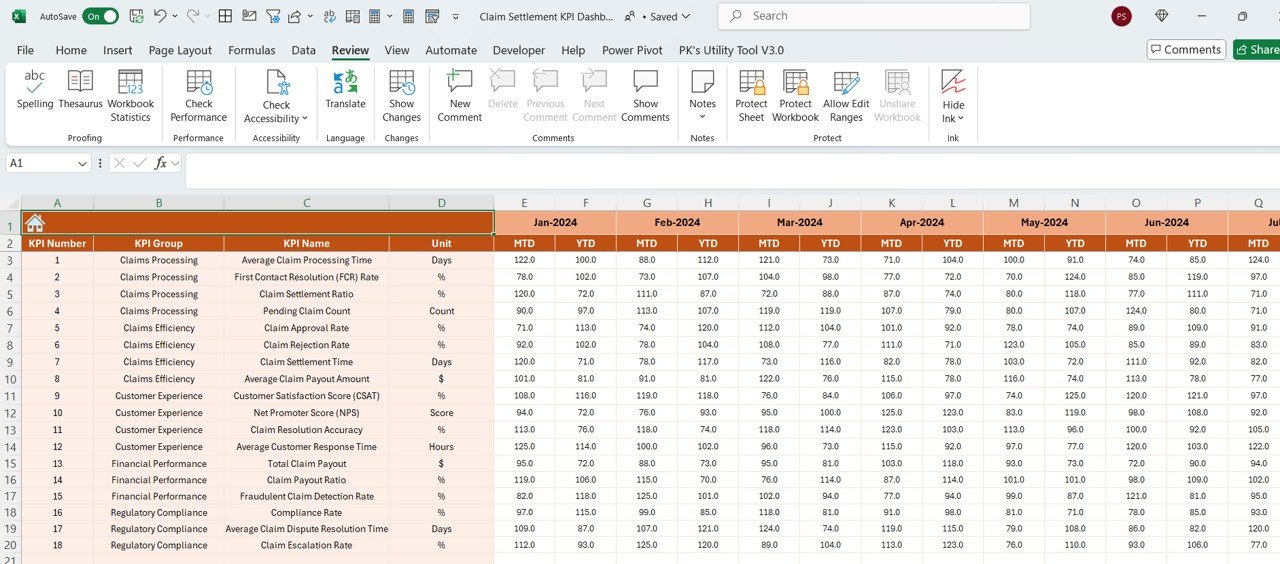
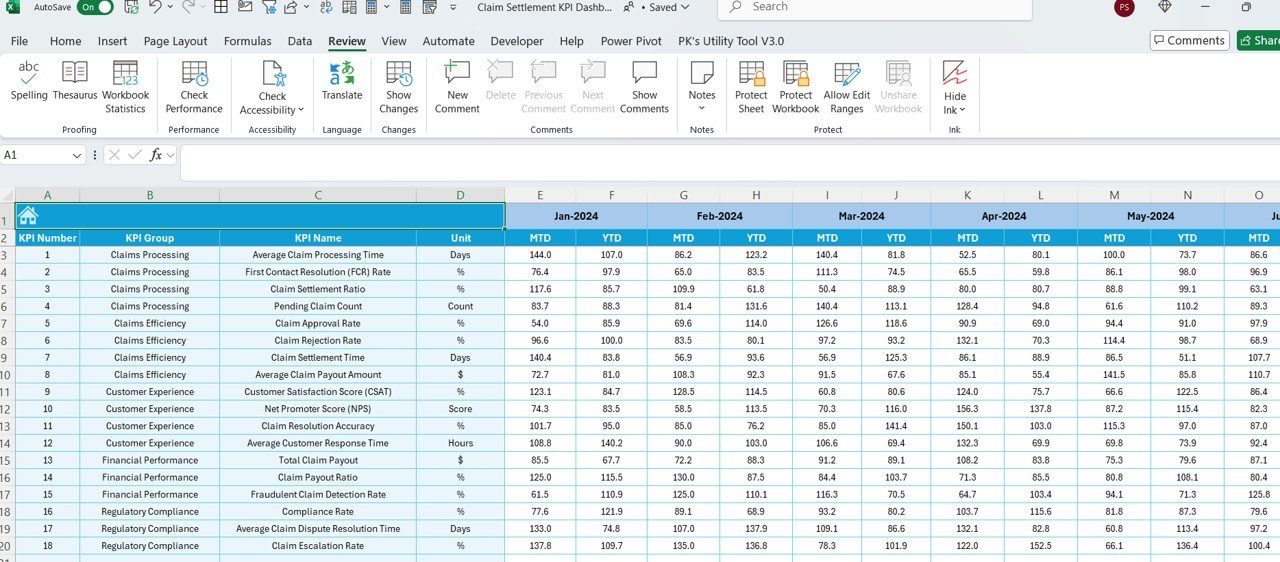
2️⃣ Set Up Claims Metrics: Input your claims data, including status, approval/denial rates, and customer feedback.
3️⃣ Track Claim Performance: Monitor claim resolution time, approval rates, and customer satisfaction.
4️⃣ Analyze Data & Insights: Use data visualization tools to understand performance trends and identify improvement areas.
5️⃣ Optimize the Claims Process: Use insights to optimize your claims handling process and improve efficiency.
Who Can Benefit from the Claim Settlement KPI Dashboard in Excel?
🔹 Insurance Companies & Claims Teams
🔹 Customer Service & Support Teams
🔹 Claims Adjusters & Process Managers
🔹 E-commerce & Warranty Providers
🔹 Small & Medium Enterprises (SMEs) with Claims Management
🔹 Data Analysts & Business Analysts in Claims Management
Ensure your claims process is efficient and optimized with the Claim Settlement KPI Dashboard in Excel. Track claims, monitor key performance metrics, and make data-driven decisions to improve your claims handling process and overall customer experience.
Click here to read the Detailed blog post
Visit our YouTube channel to learn step-by-step video tutorials
Youtube.com/@PKAnExcelExpert














Reviews
There are no reviews yet.