Water is life — but Water Resource Management Dashboard it has never been more complex. Cities expand rapidly. Industries consume more resources. Climate patterns shift unpredictably. Meanwhile, authorities must control leakage, reduce treatment costs, and meet sustainability targets.
If you still rely on scattered reports, you are reacting instead of planning.
Now imagine tracking Leakage %, Treatment Cost (USD), Reservoir Level %, Actual vs Target Performance, Department Efficiency, Region Comparison, and Monthly Trends — all inside one interactive Power BI dashboard.
That is exactly what the Water Resource Management Dashboard in Power BI delivers.
This ready-to-use business intelligence solution transforms raw operational water data into dynamic visuals, KPI cards, and drill-down insights. As a result, decision-makers gain complete visibility and act faster.
Stop monitoring water manually. Start managing it strategically.
🚀 Key Features of Water Resource Management Dashboard in Power BI
📊 5 Fully Interactive Analytical Pages
🎯 KPI Summary Cards for Instant Insights
🔎 Dynamic Slicers for Real-Time Filtering
📈 Actual vs Target Performance Tracking
💧 Leakage Percentage Monitoring
💰 Treatment Cost Analysis (USD)
📅 Monthly Trend & Seasonal Analysis
🌍 Region & Department-Level Comparison
⚡ Real-Time Data Refresh
📤 Easy Report Sharing
Built in Power BI, this dashboard provides drill-through functionality, interactive filters, and automated calculations for smarter water governance.
📦 What’s Inside the Water Resource Management Dashboard in Power BI
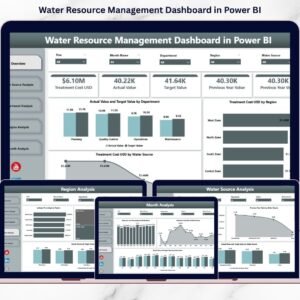
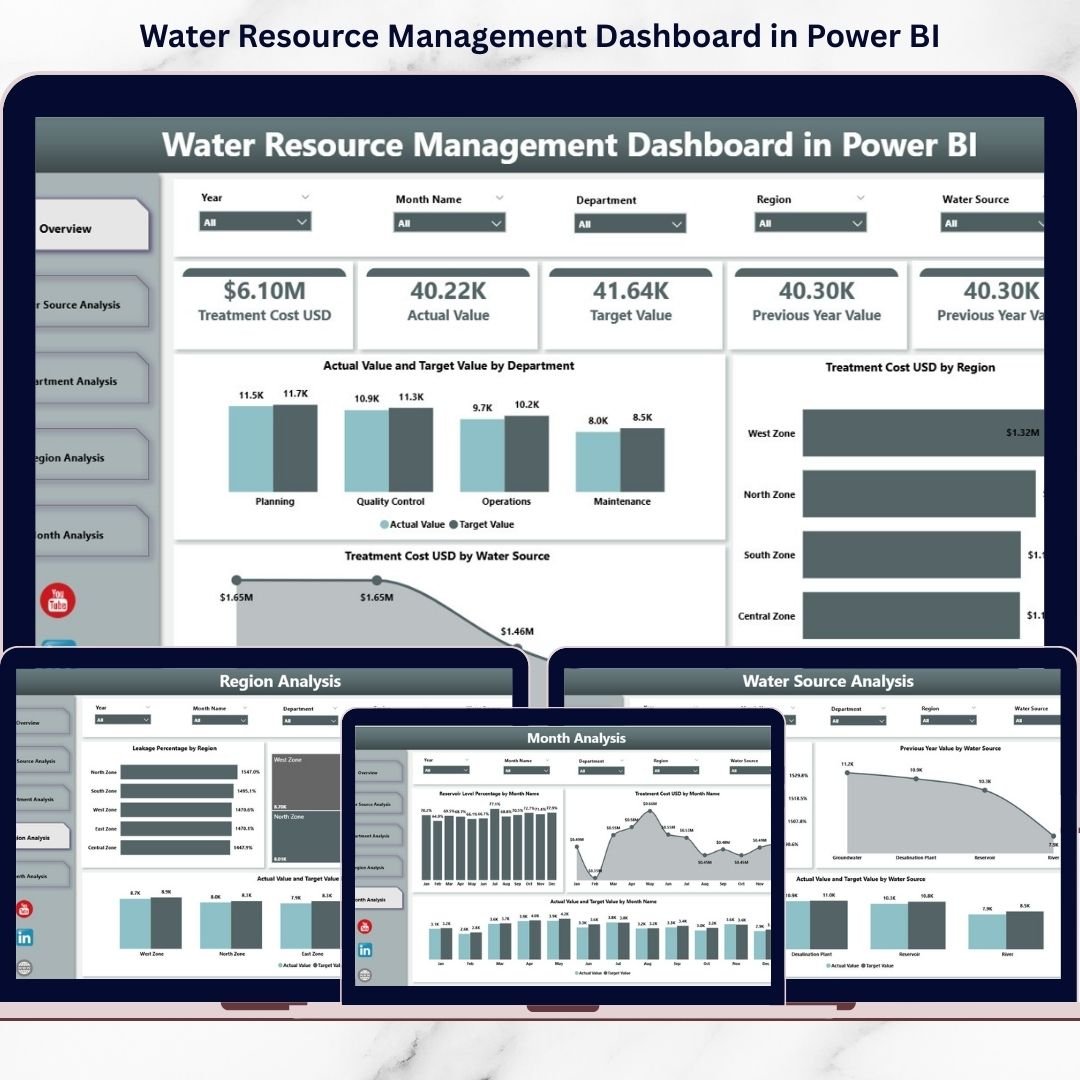
This dashboard includes five structured analytical pages designed for complete water performance tracking.
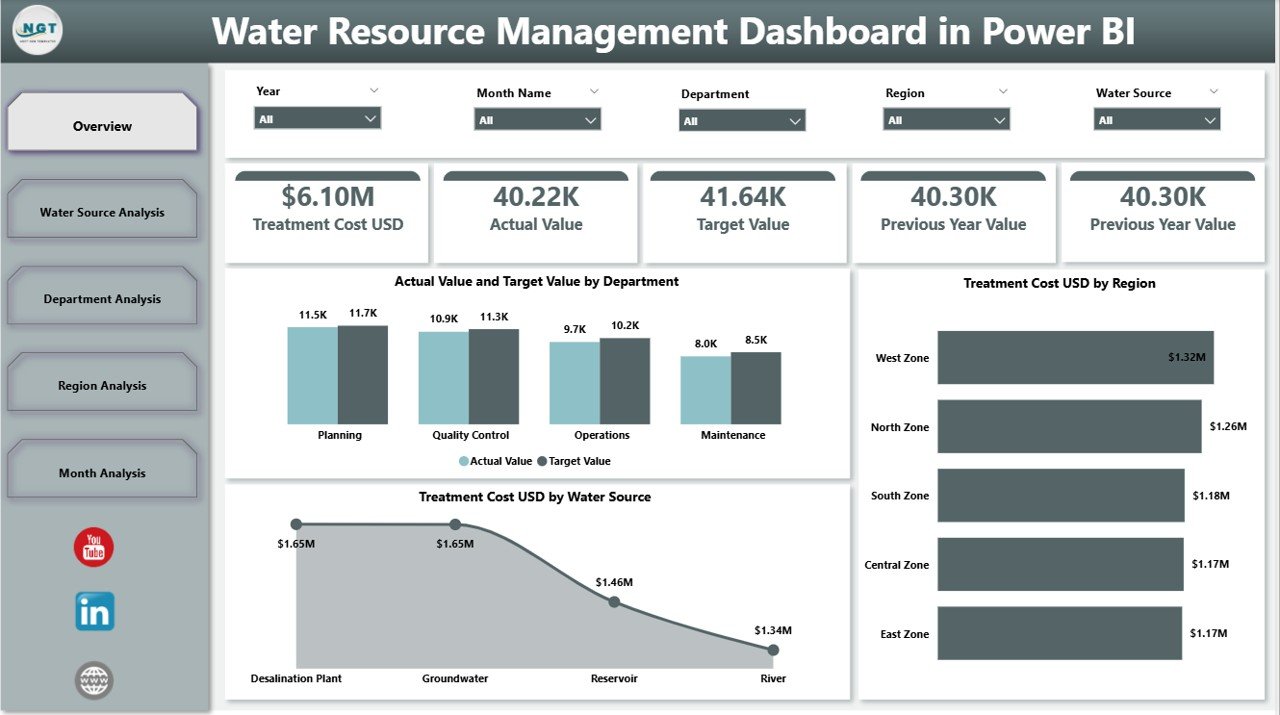
1️⃣ Overview Page – The Strategic Control Center
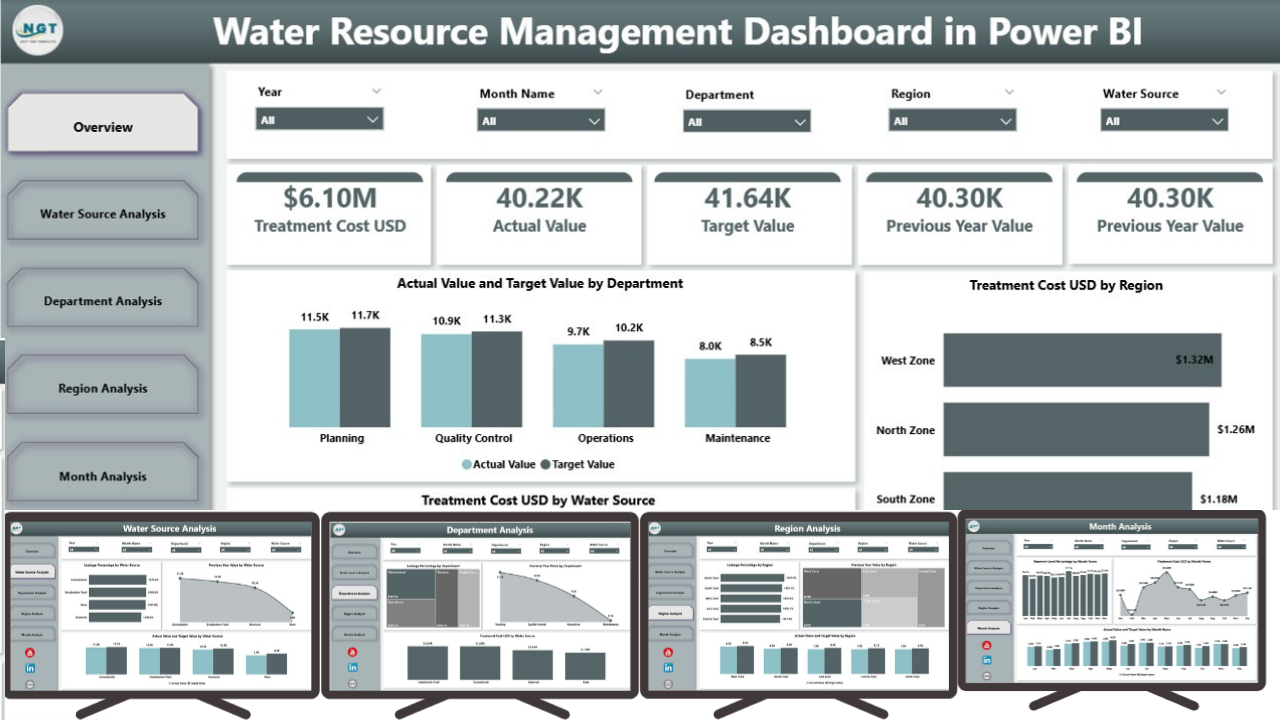
The Overview Page gives a complete snapshot of water performance.
It includes:
-
Actual Value by Department
-
Target Value by Department
-
Treatment Cost (USD) by Region
-
Treatment Cost (USD) by Water Source
-
Overall Performance Summary
With slicers for Month, Region, Department, and Water Source, users can filter insights instantly.
Decision-makers can detect performance gaps within seconds.
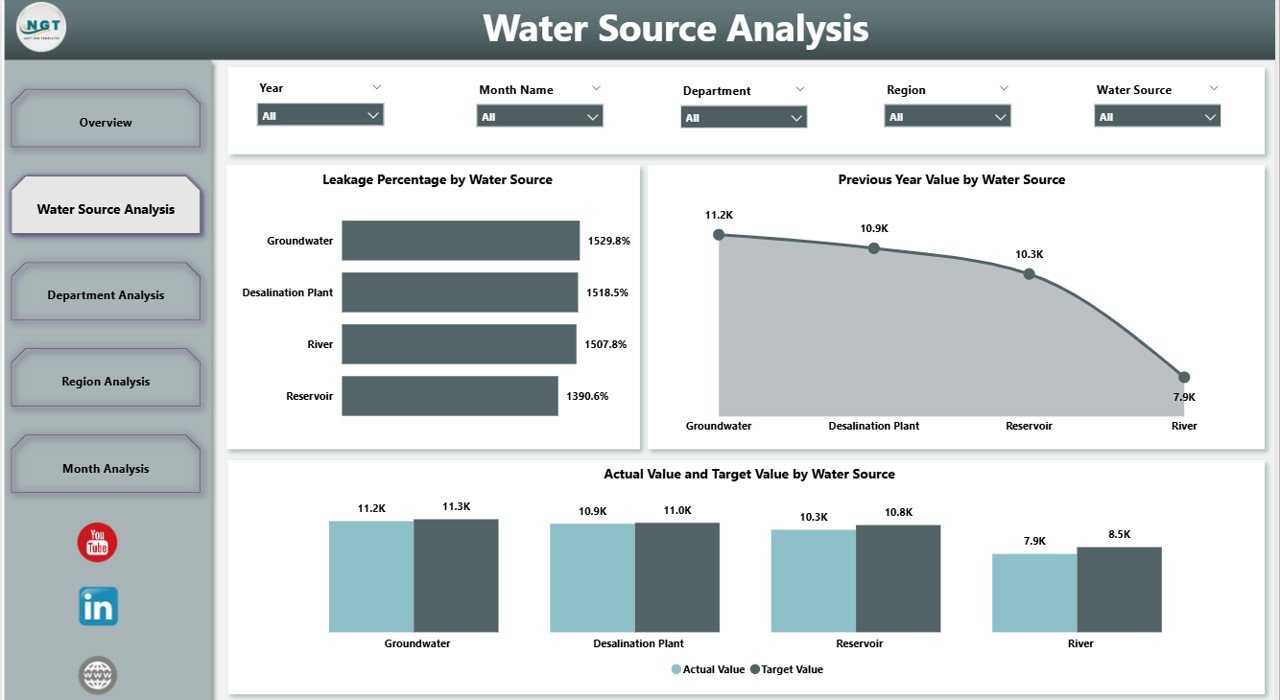
2️⃣ Water Source Analysis – Source-Level Performance
Compare water sources such as:
-
Rivers
-
Lakes
-
Reservoirs
-
Groundwater
-
Desalination
This page displays:
-
Actual vs Target by Water Source
-
Leakage % by Water Source
-
Previous Year Comparison
Optimize sourcing strategy and control leakage effectively.
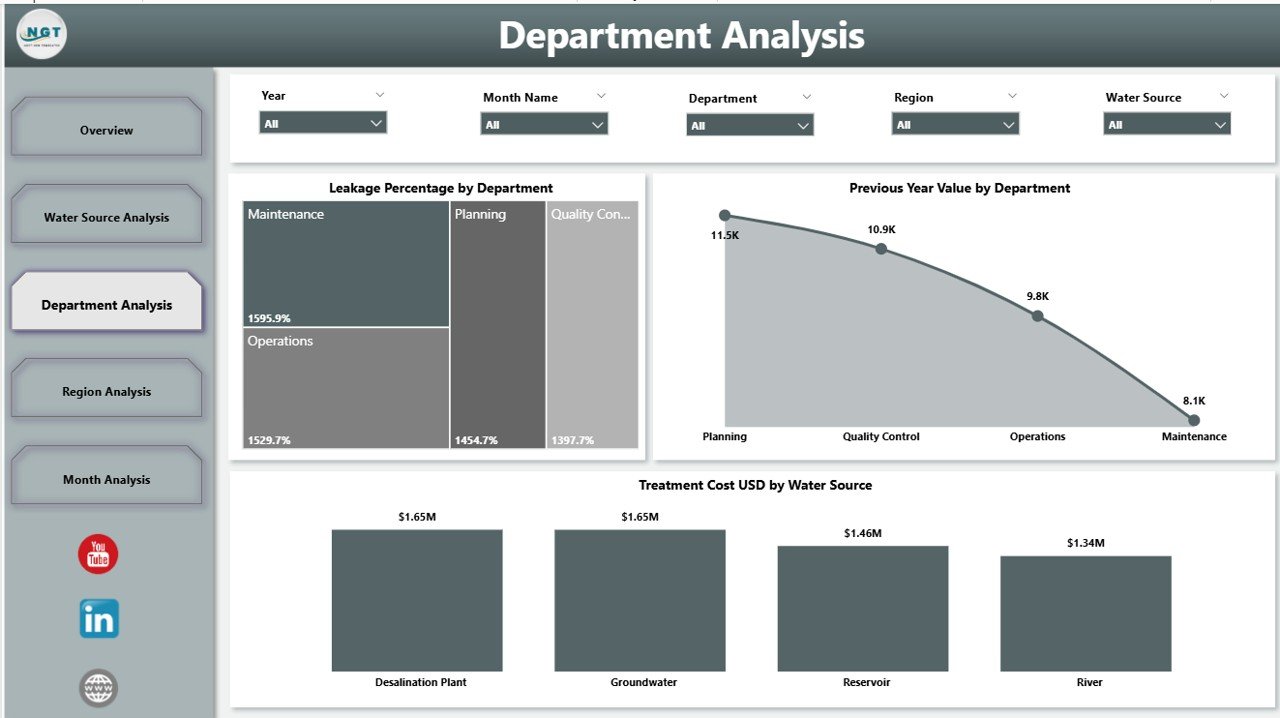
3️⃣ Department Analysis – Operational Efficiency
Water utilities include departments like:
-
Operations
-
Maintenance
-
Treatment
-
Distribution
-
Quality Control
This page tracks:
-
Leakage % by Department
-
Treatment Cost (USD) by Department
-
Previous Year Performance
Identify inefficiencies and improve accountability across teams.
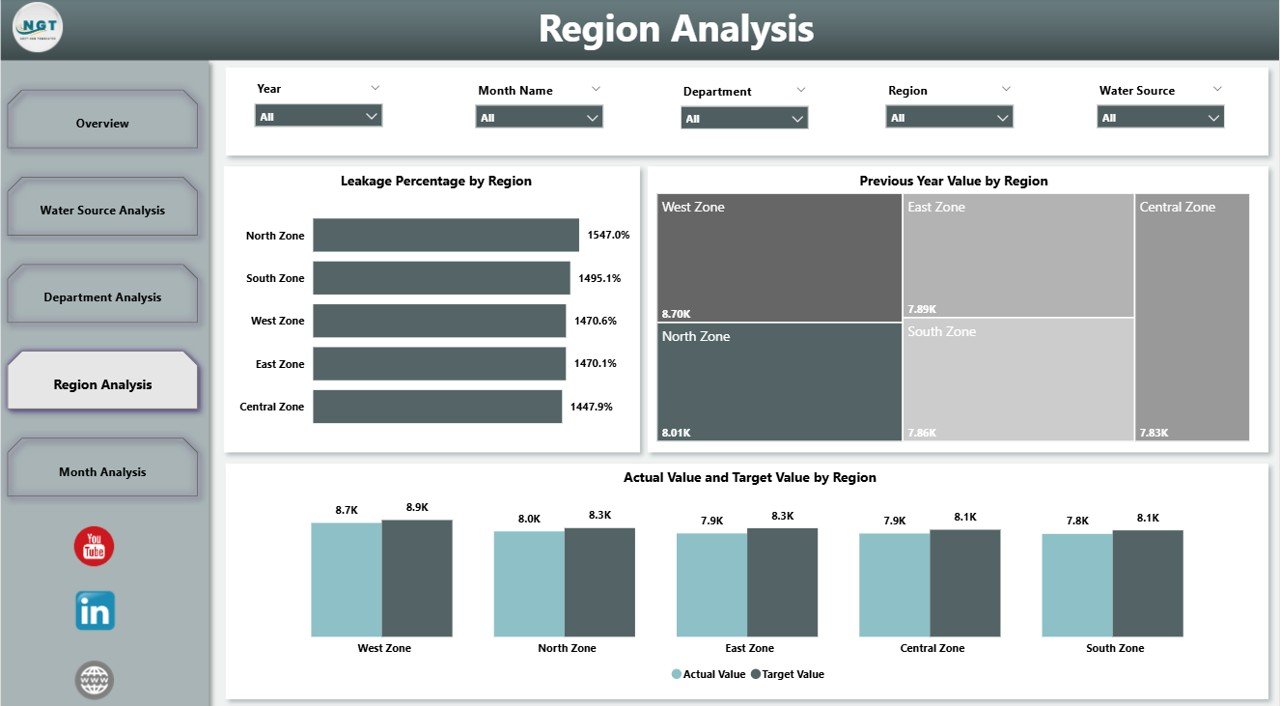
4️⃣ Region Analysis – Geographic Monitoring
Water challenges differ by region.
This page shows:
-
Leakage % by Region
-
Actual vs Target by Region
-
Previous Year Value by Region
Allocate maintenance budgets and infrastructure investments strategically.
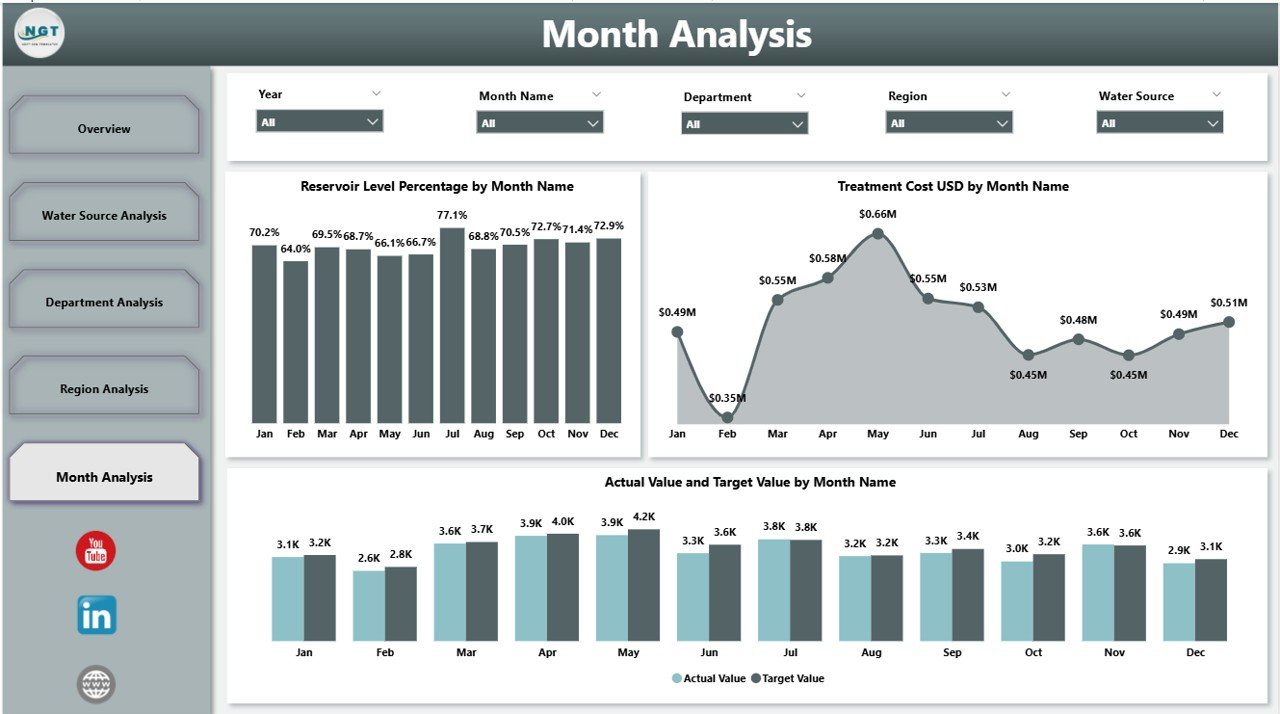
5️⃣ Month Analysis – Seasonal Trends & Forecasting
Seasonality affects reservoir levels and usage.
Track:
-
Actual vs Target by Month
-
Reservoir Level % by Month
-
Treatment Cost by Month
Prepare for summer demand spikes and manage supply shortages early.
🛠 How to Use the Water Resource Management Dashboard in Power BI
Using this dashboard is simple:
1️⃣ Connect structured water data
2️⃣ Refresh Power BI model
3️⃣ Use slicers to filter by region, department, or month
4️⃣ Drill down into specific performance metrics
No advanced Power BI expertise required — the structure is already built.
👥 Who Can Benefit from This Water Resource Management Dashboard in Power BI
🏛 Municipal Corporations
🚰 Water Utilities
🌿 Environmental Agencies
🏭 Industrial Water Management Teams
🌍 Regional Planning Authorities
📊 Sustainability Managers
If your organization manages water supply, cost, leakage, or compliance — this dashboard becomes your operational command center.
By using this dashboard, you:
✔ Detect leakage increases instantly
✔ Monitor treatment cost spikes
✔ Compare regional performance clearly
✔ Track target achievement accurately
✔ Forecast seasonal water shortages
✔ Improve budget allocation
✔ Strengthen sustainability governance
Instead of relying on outdated reports, you gain interactive, real-time performance insights.
This is not just a Power BI file. It is a complete water governance intelligence system.
If you want stronger transparency, better cost control, and smarter water planning — this dashboard delivers the clarity you need.