Running a travel tech startup means making fast decisions in a volatile, competitive, and seasonal market. Customer demand shifts quickly, acquisition costs rise, and operational efficiency becomes mission-critical. Yet many startups still depend on disconnected Excel sheets and manual reports that delay insights.
That is exactly where the Travel Tech Startups KPI Dashboard in Power BI becomes a game-changer.
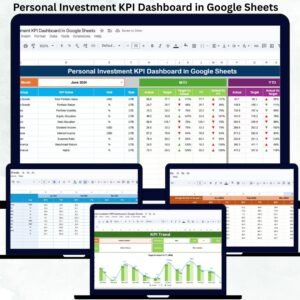
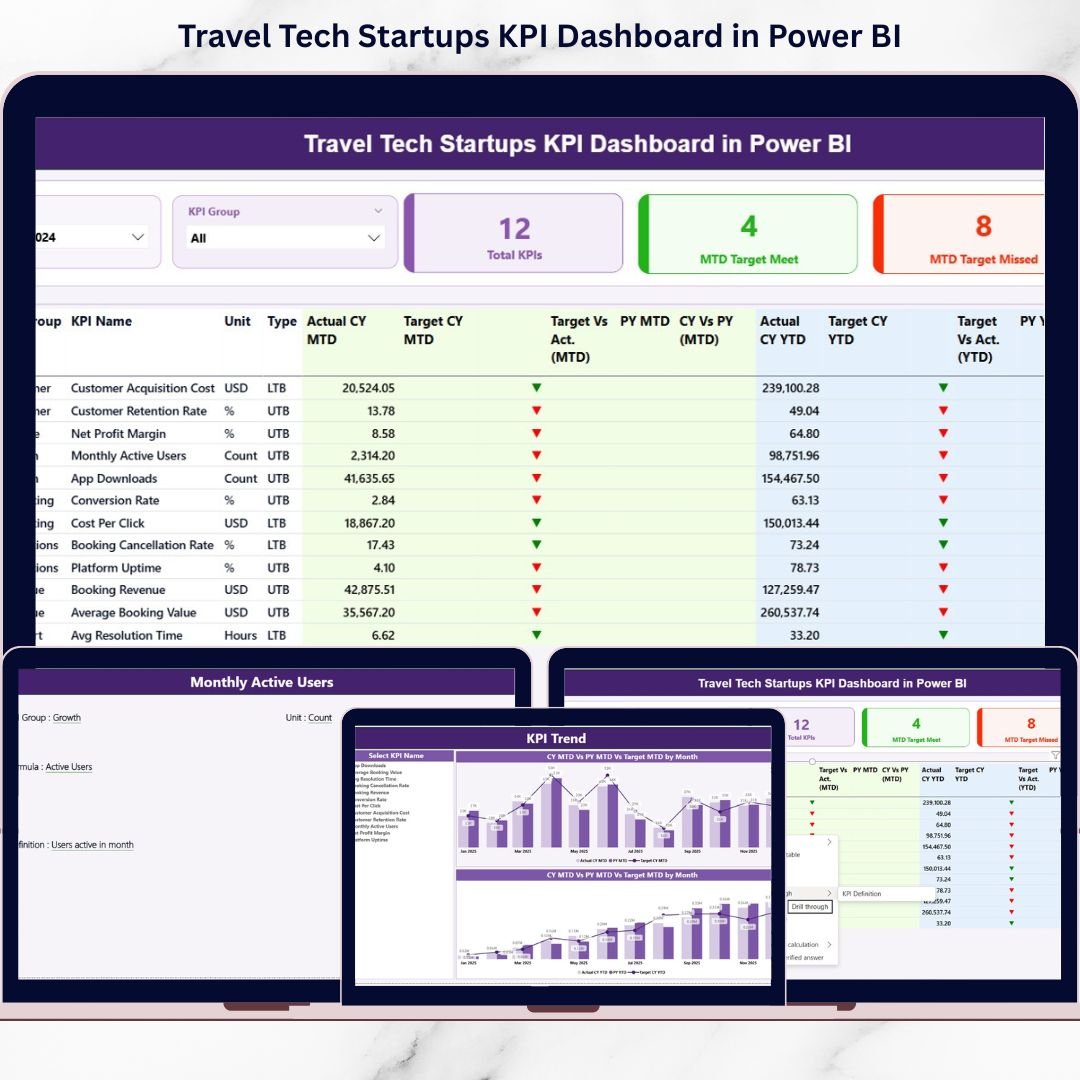
This ready-to-use Power BI dashboard helps travel technology companies track, analyze, and compare their most important KPIs using clear visuals, smart indicators, and Excel-based data inputs. Instead of guessing performance, founders and leadership teams gain instant clarity across MTD, YTD, target vs actual, and year-over-year trends—all in one place.
✅ Key Features of Travel Tech Startups KPI Dashboard in Power BI
📊 Centralized KPI Monitoring
Track all critical travel tech KPIs from a single interactive dashboard without juggling multiple files.
📅 MTD & YTD Performance Tracking
Instantly switch between Month-to-Date and Year-to-Date views to monitor short-term execution and long-term growth.
🎯 Target vs Actual Comparison
Clearly see which KPIs are meeting targets and which need attention using visual indicators.
📈 Year-over-Year Analysis
Compare current year performance against previous year data for both MTD and YTD metrics.
🚦 Visual Performance Indicators
Green and red arrows instantly highlight KPI success or underperformance.
📉 Interactive Trend Charts
Analyze KPI trends using combo charts showing actuals, targets, and prior-year values.
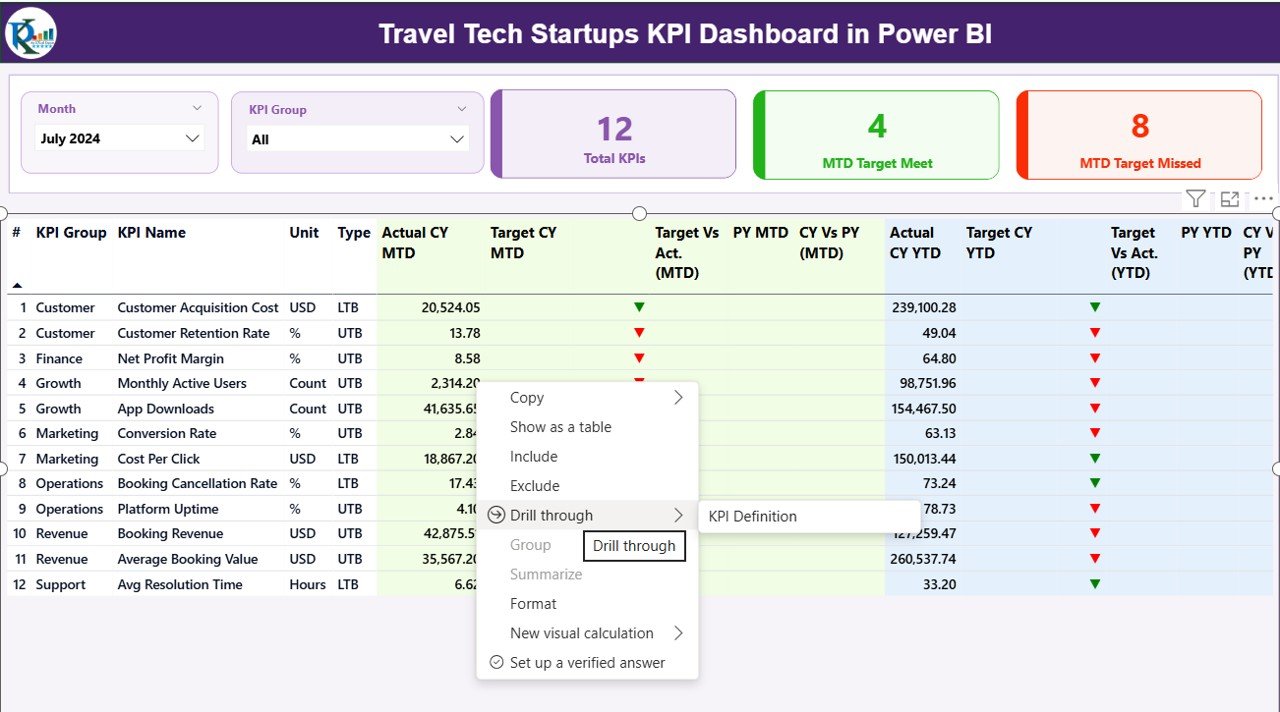
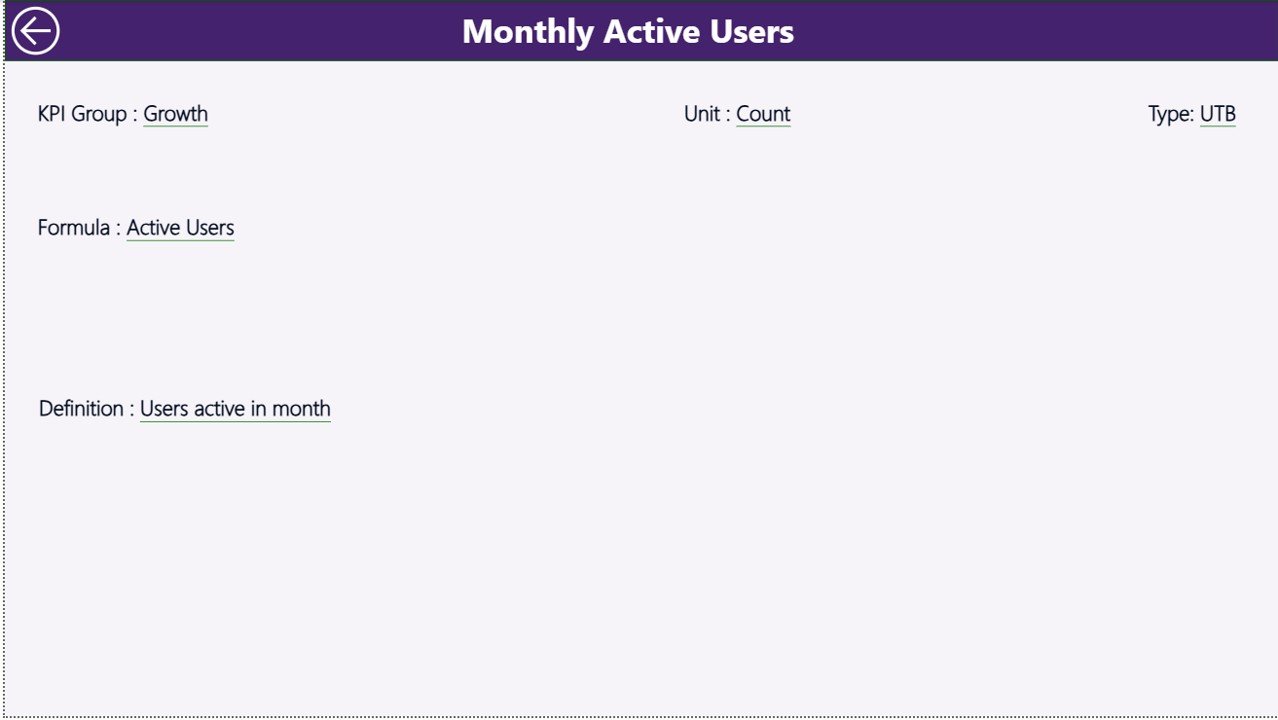
🔍 Drill-Through KPI Definitions
Click any KPI to view its formula, unit, definition, and performance type (LTB or UTB).
📂 Excel-Based Data Entry
Update data easily in Excel—Power BI visuals refresh automatically.

📦 What’s Inside the Travel Tech Startups KPI Dashboard in Power BI
This dashboard comes with a structured Power BI file connected to an Excel data source, including:
📌 Summary Page
-
Month slicer and KPI Group slicer
-
KPI cards for total KPIs, targets met, and targets missed
-
Detailed KPI table with MTD and YTD performance metrics
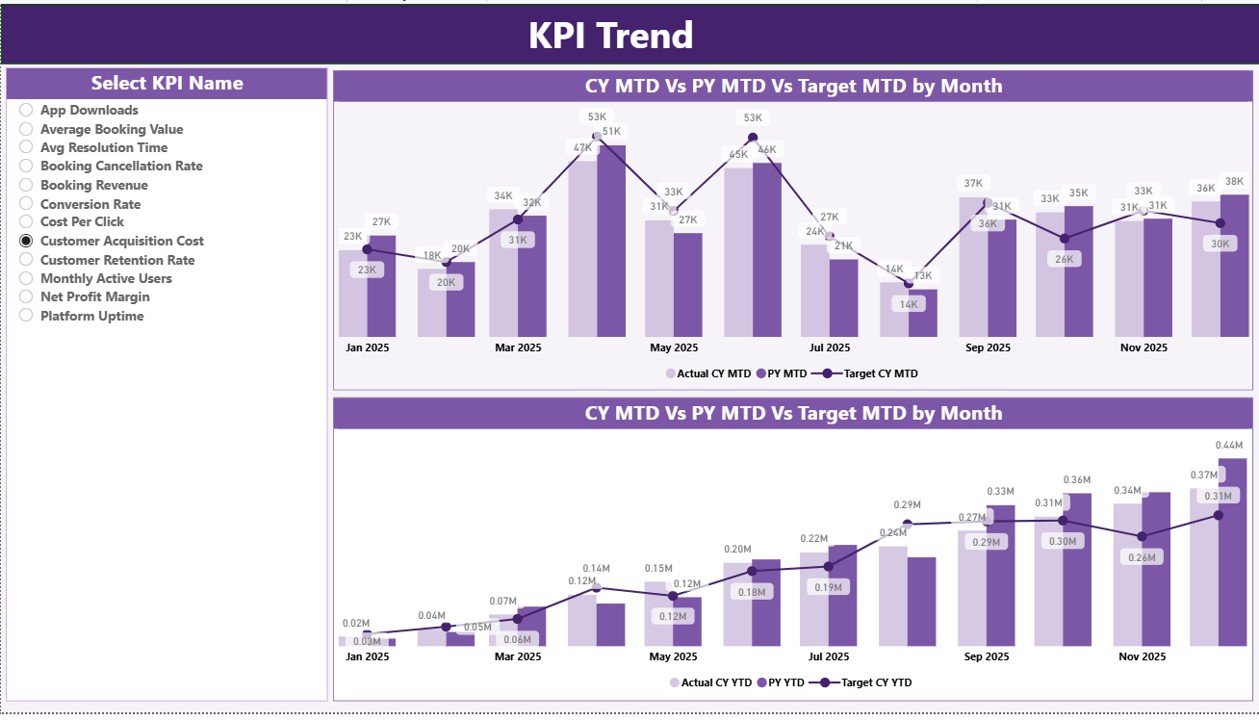
📌 KPI Trend Page
-
Two combo charts for MTD and YTD trends
-
KPI selector to analyze individual performance patterns
📌 KPI Definition Page (Drill-Through)
-
KPI number, group, unit, formula, and definition
-
LTB (Lower the Better) and UTB (Upper the Better) logic
-
One-click navigation back to Summary
📌 Excel Data Source (3 Sheets)
-
Input_Actual – Enter MTD & YTD actual values
-
Input_Target – Maintain monthly and yearly targets
-
KPI Definition – Centralized KPI master data
🛠️ How to Use the Travel Tech Startups KPI Dashboard in Power BI
1️⃣ Enter KPI actual values in the Input_Actual Excel sheet
2️⃣ Update target values in the Input_Target sheet
3️⃣ Maintain KPI logic in the KPI Definition sheet
4️⃣ Refresh the Power BI file
5️⃣ Use slicers to analyze performance instantly
No advanced Power BI skills required—Excel updates drive everything.
👥 Who Can Benefit from This Travel Tech Startups KPI Dashboard
🚀 Travel tech startup founders
📊 Product and operations managers
💼 Strategy and analytics teams
📈 Growth and revenue leaders
💰 Finance and performance analysts
🤝 Investor reporting teams
This dashboard also adapts easily to staffing, SaaS, consulting, and service-based businesses.
Click here to read the Detailed Blog Post
Watch the step-by-step video tutorial: