


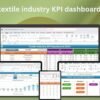


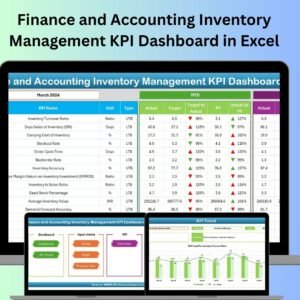
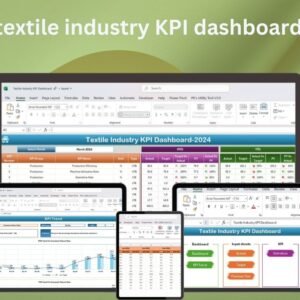
The Textile Industry KPI Dashboard in Excel is a comprehensive tool designed to help textile industry professionals track, analyze, and visualize key performance indicators (KPIs) related to production, inventory, sales, and more. This customizable Excel dashboard offers a real-time snapshot of your textile operations, enabling businesses to monitor essential metrics and make data-driven decisions.
Whether you’re overseeing production efficiency, inventory levels, or sales performance, this KPI dashboard provides a clear and organized way to visualize your data. With easy-to-read charts, graphs, and automated data tracking, this tool helps streamline your workflow and improve decision-making across your textile business.
Key Features of the Textile Industry KPI Dashboard in Excel
 Real-Time Data Tracking: Track KPIs such as production output, sales, inventory levels, and production efficiency in real-time.
 Customizable Dashboard: Tailor the dashboard to suit the specific needs of your textile business, from raw material costs to finished goods performance.
 Production Performance Analysis: Monitor the efficiency of production lines, track order completion rates, and identify bottlenecks.
 Sales and Revenue Tracking: Keep track of sales performance, revenue, and market trends to boost profitability.
 Inventory Management: Visualize inventory turnover rates, stock levels, and reorder points for better supply chain management.
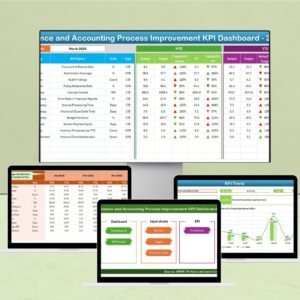
 Dynamic and Interactive Features: Drill down into individual KPIs for deeper insights and track historical performance trends.
 User-Friendly Interface: A simple layout and intuitive design make it easy for users of all levels to manage the dashboard.
Why You’ll Love the Textile Industry KPI Dashboard in Excel
 Simplifies Textile Operations: Gain full visibility into production, inventory, and sales metrics in one central dashboard. Enhances Decision Making: Make data-driven decisions using real-time insights on performance, trends, and inventory. Increases Productivity: Identify areas of improvement by tracking KPIs such as production efficiency and sales performance. Customizable and Scalable: Adapt the dashboard to your unique textile industry needs and scale as your business grows. Easy to Use: No technical expertise required to set up or use the dashboard effectively.
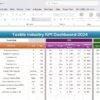
What’s Inside the Textile Industry KPI Dashboard in Excel?
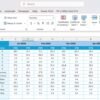
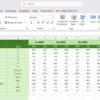
Real-Time Tracking of KPIs: Monitor key metrics such as production output, sales revenue, and inventory levels.

Customizable Widgets: Adjust the layout and design to suit the specific KPIs that matter most to your textile business. Visual Data Representation: Use charts, graphs, and tables to visualize production and sales data at a glance. Time-Based Trends: Analyze production performance, sales growth, and inventory turnover over various time periods. Interactive Features: Dive deeper into specific data points for a detailed analysis of your textile operations.
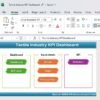
How to Use the Textile Industry KPI Dashboard in Excel
 Download the Dashboard Template – Instantly access the Excel file upon purchase.
 Customize KPIs: Adjust the dashboard to include your specific textile production, inventory, and sales metrics.
 Input Your Data: Add your current performance data and see the charts update automatically.
 Monitor Performance: Use the real-time tracking features to monitor production efficiency, sales, and inventory levels.
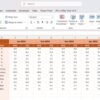
 Generate Reports: Create reports and visual insights for decision-making and presentations.
Who Can Benefit from the Textile Industry KPI Dashboard in Excel?
 Textile Manufacturers Production Managers Inventory Managers Sales Teams Business Analysts Small and Medium Enterprises (SMEs) Textile Industry Consultants
Optimize your textile operations, increase productivity, and track performance with this easy-to-use and customizable Excel dashboard.
Click here to read the detailed blog post
Visit our YouTube channel to learn step-by-step video tutorials


Reviews
There are no reviews yet.