In today’s fast-paced digital world, technical support is the backbone of customer satisfaction. When service requests are delayed, escalated, or unresolved, it directly impacts customer loyalty and business growth. That’s why every organization needs a simple yet powerful way to monitor, measure, and improve its support operations.
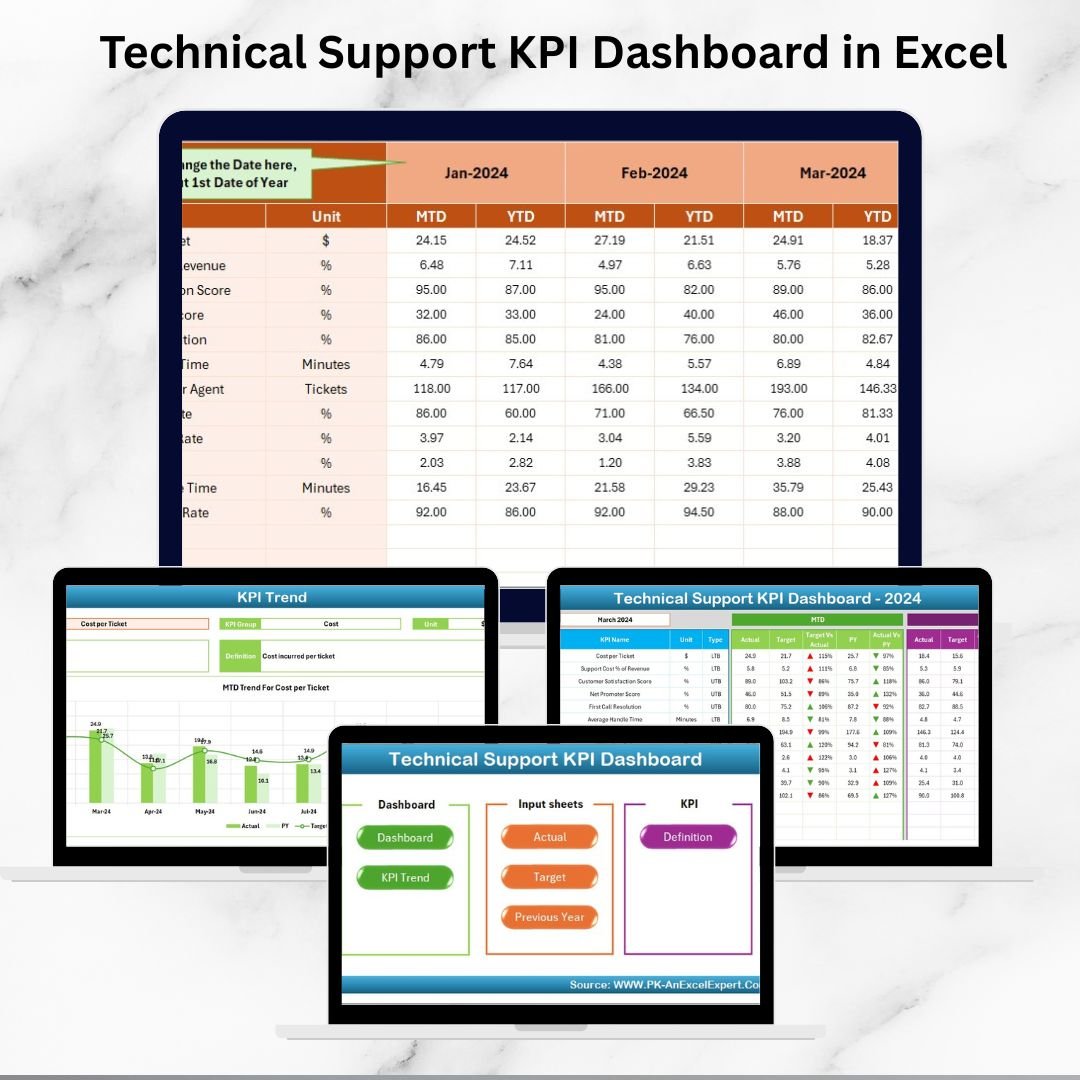
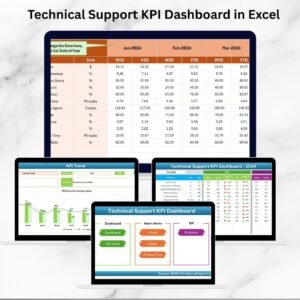
Introducing the Technical Support KPI Dashboard in Excel – a ready-to-use, fully customizable solution designed to give managers and teams instant visibility into support performance. Instead of juggling multiple spreadsheets and manual reports, this dashboard brings all your critical KPIs into one central, interactive platform. 🚀
With seven well-structured worksheets, you’ll have everything you need to track, analyze, and boost performance—whether you’re monitoring first response times, resolution rates, or customer satisfaction.
✨ Key Features of Technical Support KPI Dashboard in Excel
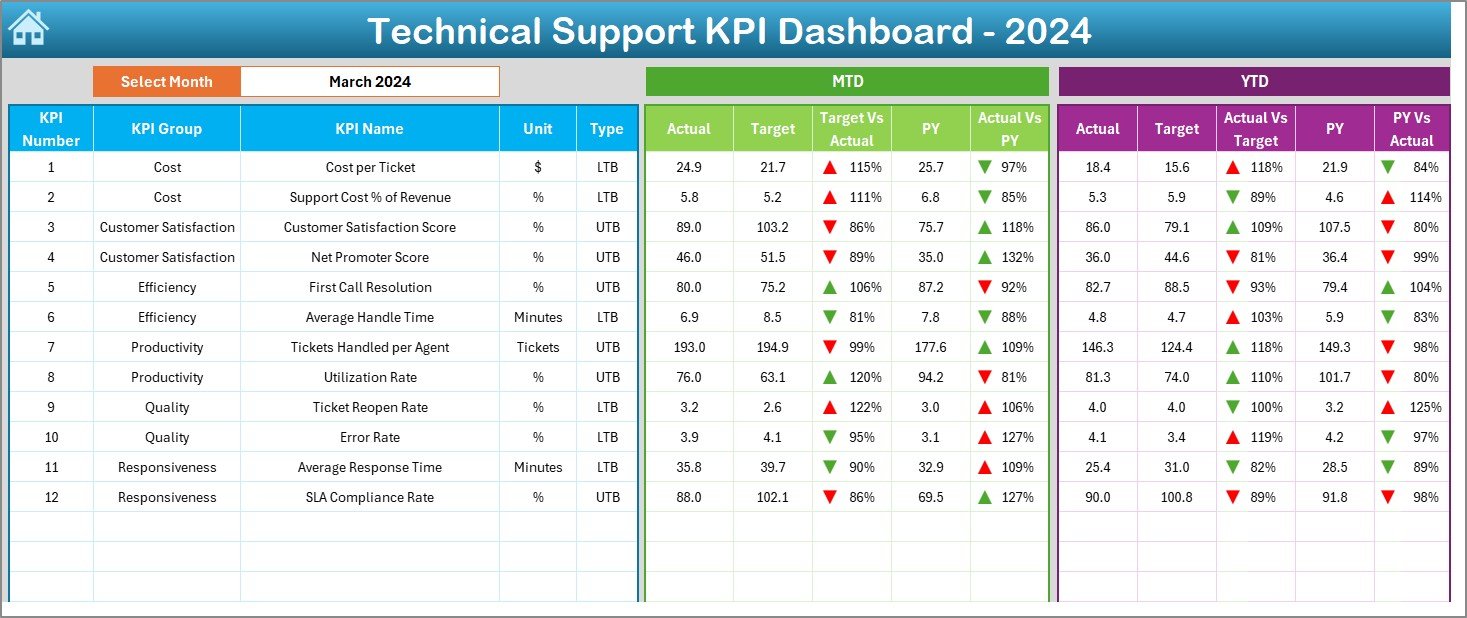
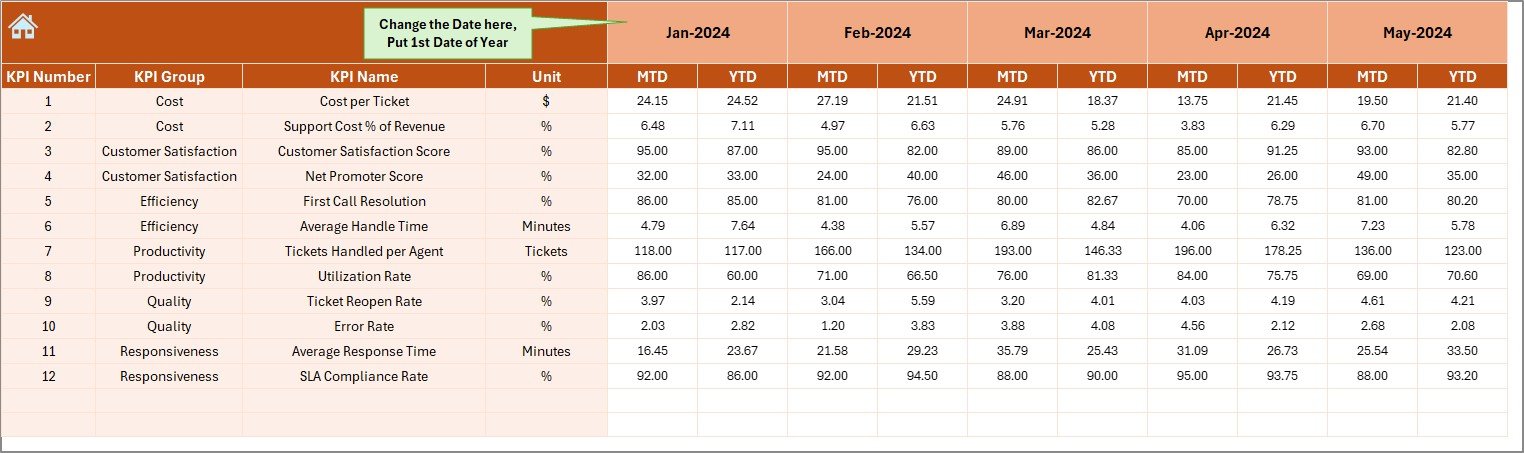
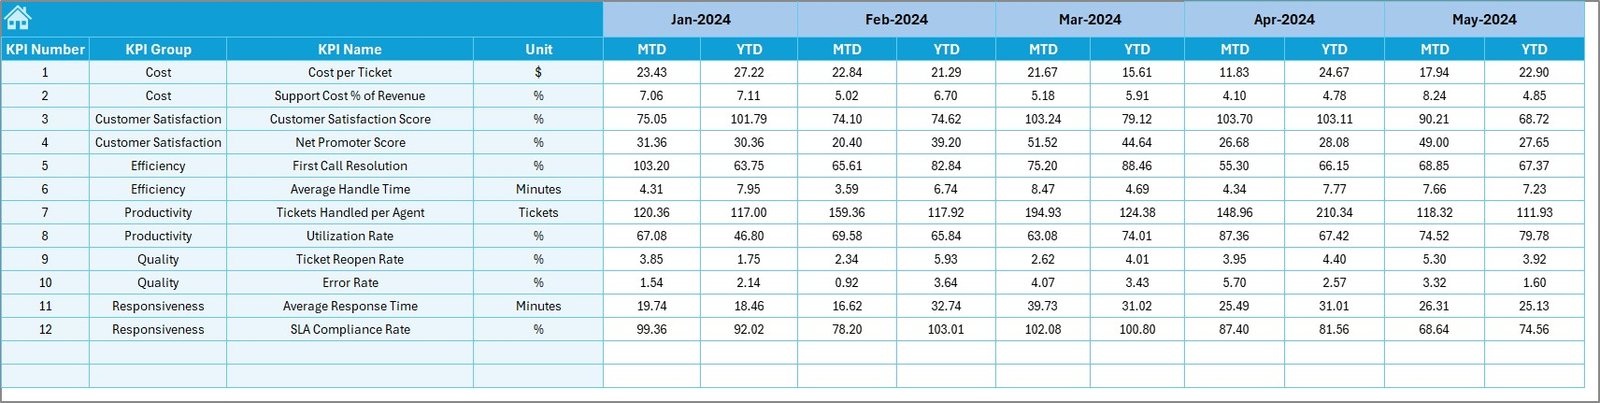
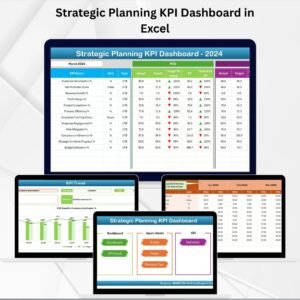
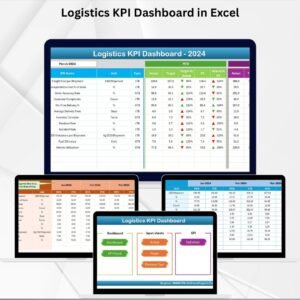
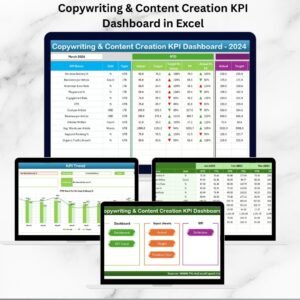
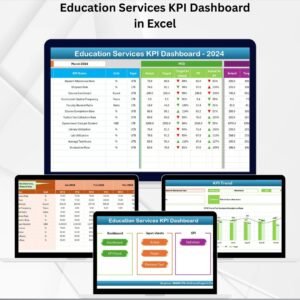
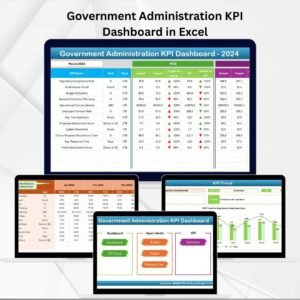
✅ All-in-One Dashboard – Track MTD (Month-to-Date) and YTD (Year-to-Date) KPIs in one glance.
✅ Interactive Reports – Use drop-down filters to switch months and KPIs instantly.
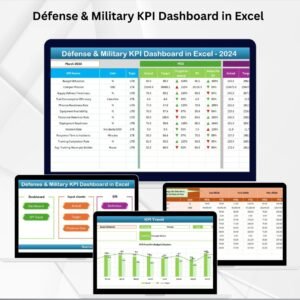
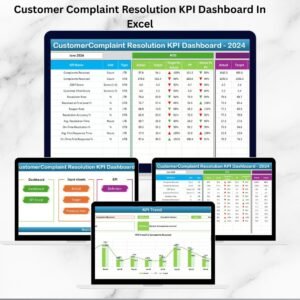
✅ KPI Comparisons – View Actual vs Target and Actual vs Previous Year with clear visual cues.
✅ Automated Insights – Conditional formatting highlights performance trends with arrows.
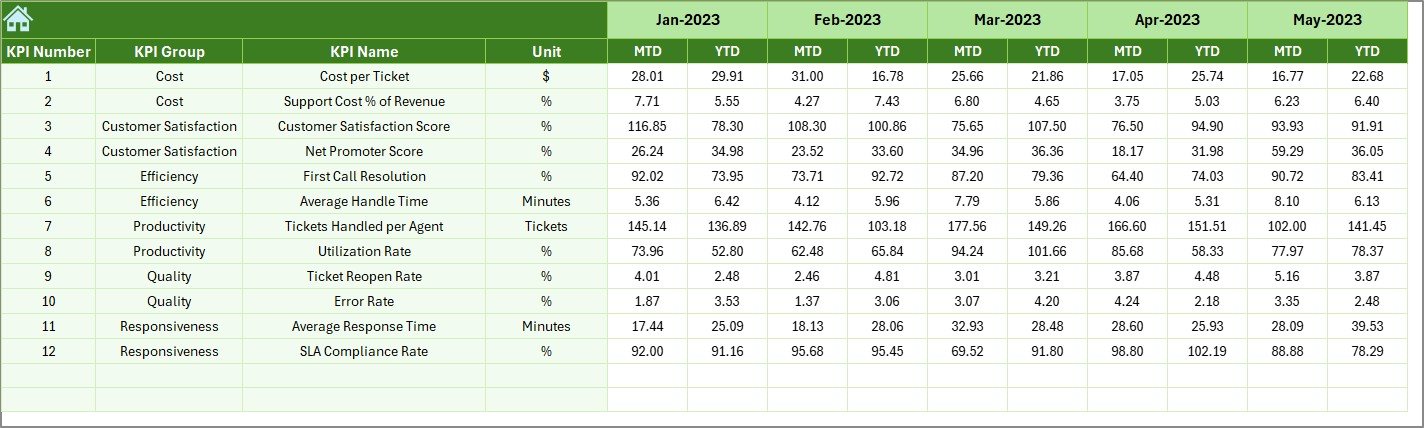
✅ Historical Benchmarking – Compare current year results with last year’s data.
✅ Customizable Structure – Add, edit, or remove KPIs based on your business needs.
✅ User-Friendly Navigation – Home sheet with quick buttons to jump across tabs.
✅ Ready-to-Use Design – No advanced Excel skills required—just plug in your data.
📊 What’s Inside the Technical Support KPI Dashboard
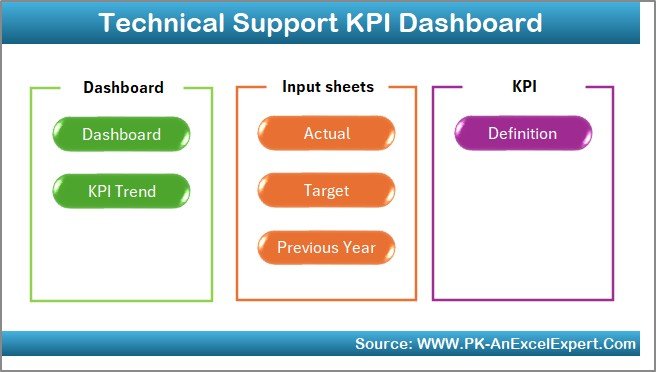
This product comes with 7 interactive worksheet tabs, each crafted for a specific purpose:
-
Home Sheet – Navigation hub with quick links to all sections.
-
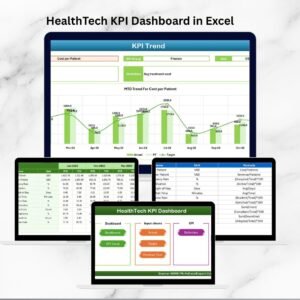
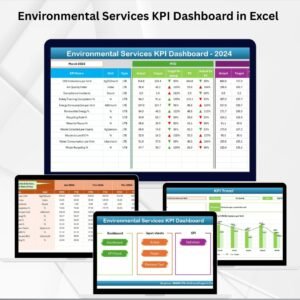
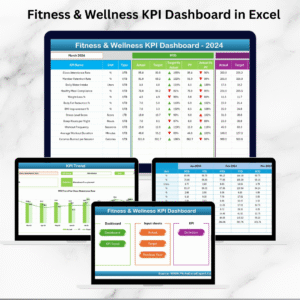
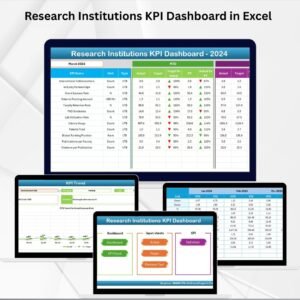
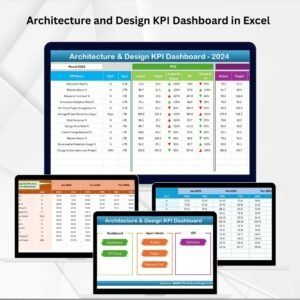
Dashboard Sheet – Visual performance overview with charts, comparisons, and KPI cards.
-
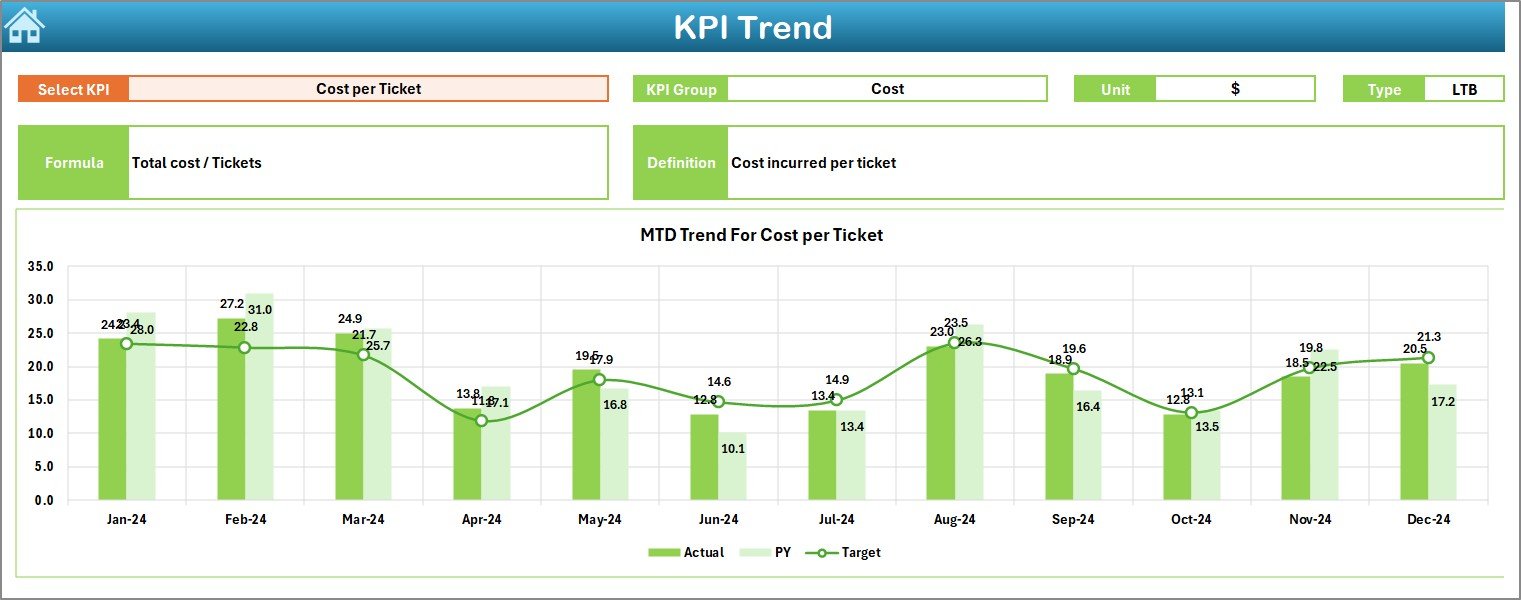
KPI Trend Sheet – Line charts showing MTD & YTD trends for individual KPIs.
-
Actual Numbers Input Sheet – Simple layout to enter monthly performance numbers.
-
Target Sheet – Define your monthly and yearly goals.
-
Previous Year Numbers Sheet – Enter historical data for benchmarking.
-
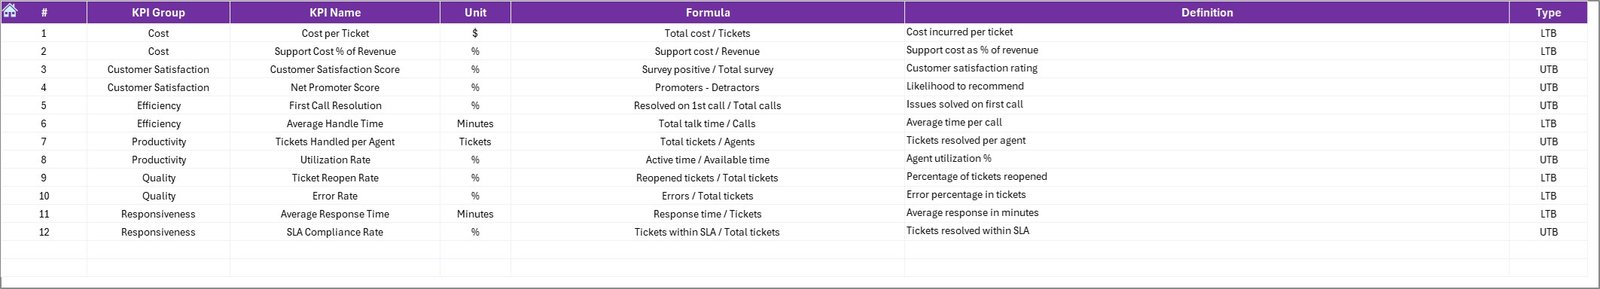
KPI Definition Sheet – Reference table with KPI name, formula, unit, and type (UTB/LTB).
🛠️ How to Use the Technical Support KPI Dashboard in Excel
Using this dashboard is as easy as 1-2-3:
1️⃣ Input Actual Data – Enter your monthly values in the “Actual Numbers” sheet.
2️⃣ Set Targets – Add MTD & YTD goals in the “Target” sheet.
3️⃣ Add Historical Data – Fill in last year’s figures for better comparisons.
4️⃣ Check KPI Definitions – Ensure team alignment using the “KPI Definition” sheet.
5️⃣ Analyze Trends – Open the Dashboard & KPI Trend tabs to view real-time insights.
6️⃣ Take Action – Identify gaps, SLA breaches, or rising backlogs—and resolve them proactively.
👥 Who Can Benefit from This Dashboard?
This dashboard is designed for any organization that values efficient technical support:
-
Customer Support Managers – Track team performance and identify bottlenecks.
-
Business Owners – Ensure seamless service delivery and improve customer satisfaction.
-
Support Teams – Gain clarity on key KPIs and align with company goals.
-
Startups & SMEs – Get a cost-effective, professional tool without investing in complex software.
-
Large Enterprises – Customize the dashboard to integrate with existing processes.
Whether you’re a startup looking to organize support tracking or a global enterprise aiming for advanced insights, this dashboard is your one-stop solution.
📖 Click here to read the Detailed blog post
Watch the step-by-step video tutorial:


Reviews
There are no reviews yet.