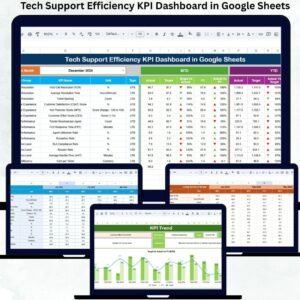
Tech support teams sit at the heart of business performance. Every open ticket, delayed response, or unresolved issue directly impacts customer satisfaction, employee productivity, and system reliability. Despite this, many organizations still rely on basic spreadsheets, disconnected tools, or manual reports that fail to show real performance insights on time.
The Tech Support Efficiency KPI Dashboard in Google Sheets eliminates this problem by delivering a centralized, ready-to-use performance monitoring system for IT support and helpdesk teams. It converts raw ticket data into clear KPIs, trends, and comparisons—so leaders can make faster, smarter service decisions without investing in expensive software.
Built entirely in Google Sheets, this dashboard is simple, collaborative, and powerful, making it ideal for teams of all sizes.
🚀 Key Features of the Tech Support Efficiency KPI Dashboard
✅ Centralized tracking of all tech support KPIs
✅ Automated MTD & YTD performance calculations
✅ Target vs Actual & Previous Year comparisons
✅ Visual trends with conditional arrows
✅ Clean KPI definitions for standardization
✅ Google Sheets-based – no tools or coding required
This dashboard gives you full visibility and control over tech support efficiency.
📦 What’s Inside the Tech Support Efficiency KPI Dashboard
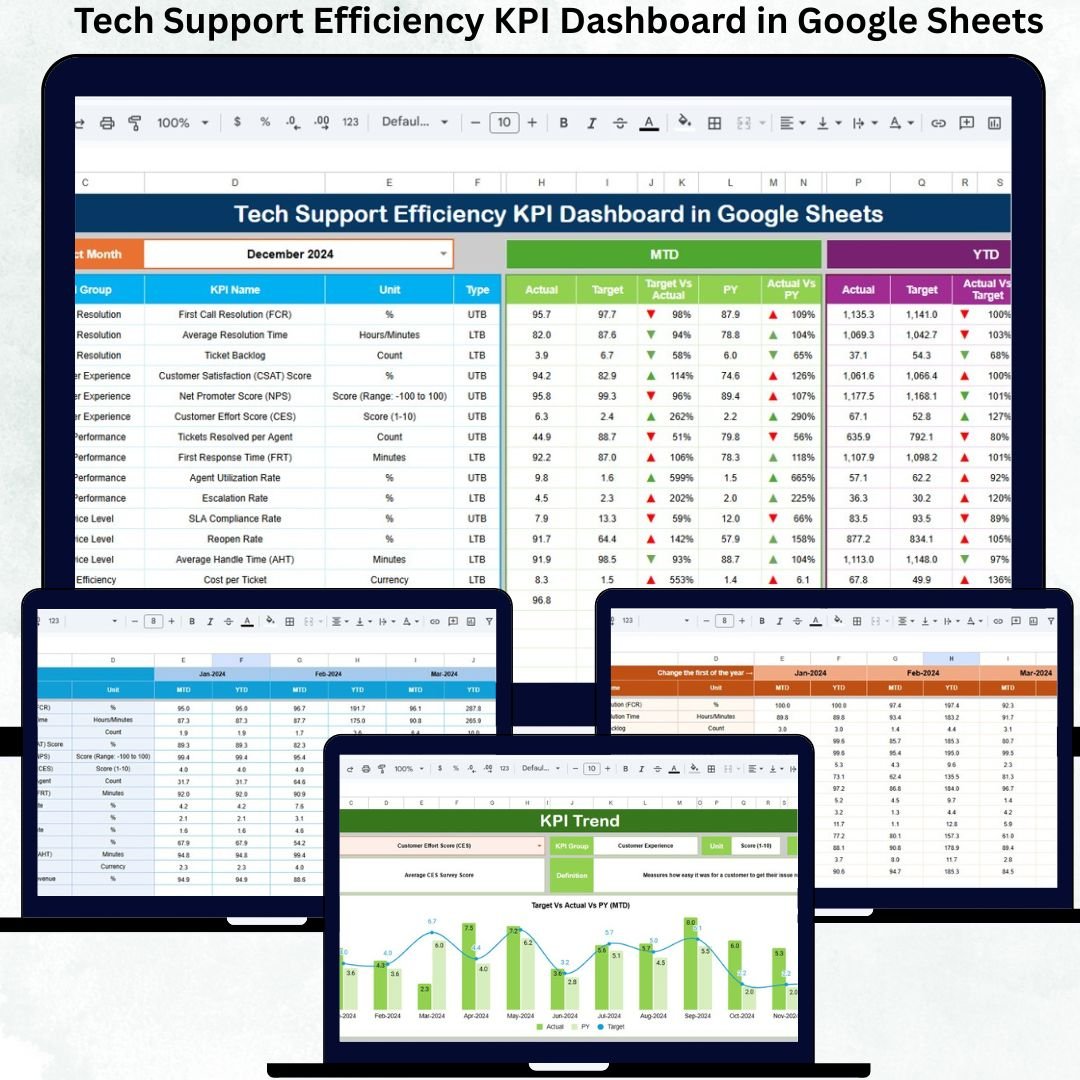
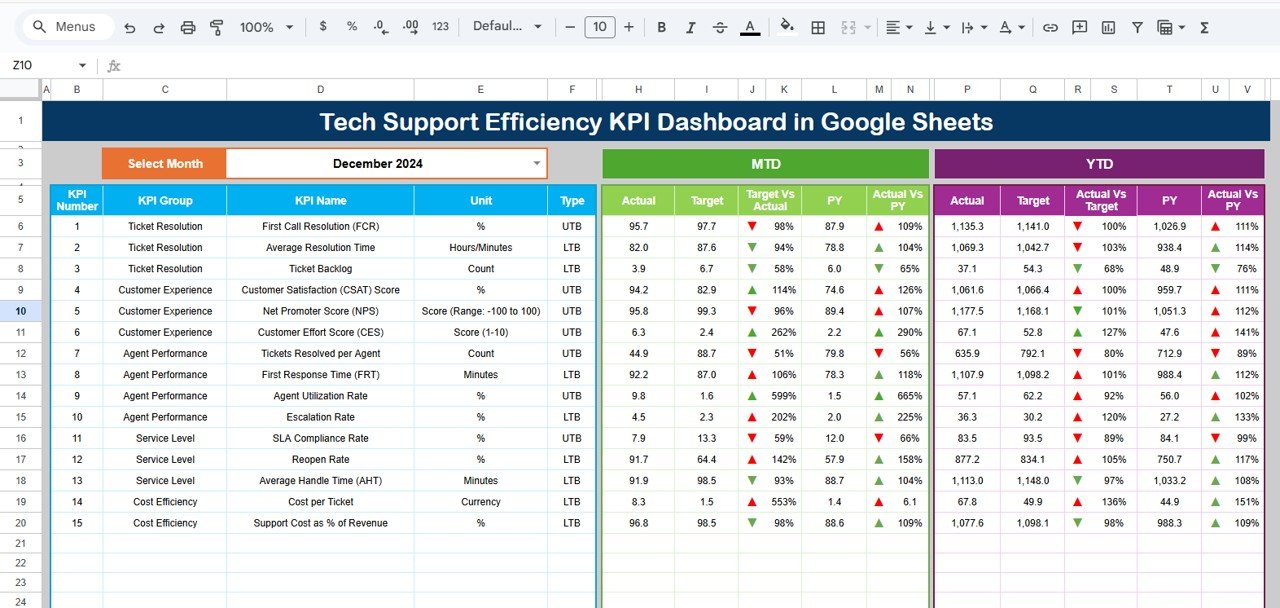
📊 1. Dashboard Sheet (Main Page)
This is the executive summary view.
-
Select the month from the dropdown in cell D3
-
The dashboard refreshes automatically
It displays:
MTD View
-
MTD Actual
-
MTD Target
-
MTD Previous Year
-
Target vs Actual
-
Previous Year vs Actual
YTD View
-
YTD Actual
-
YTD Target
-
YTD Previous Year
-
Target vs Actual
-
Previous Year vs Actual
🔺 Green Arrow → Improvement
🔻 Red Arrow → Decline
This allows managers to assess service health within seconds.
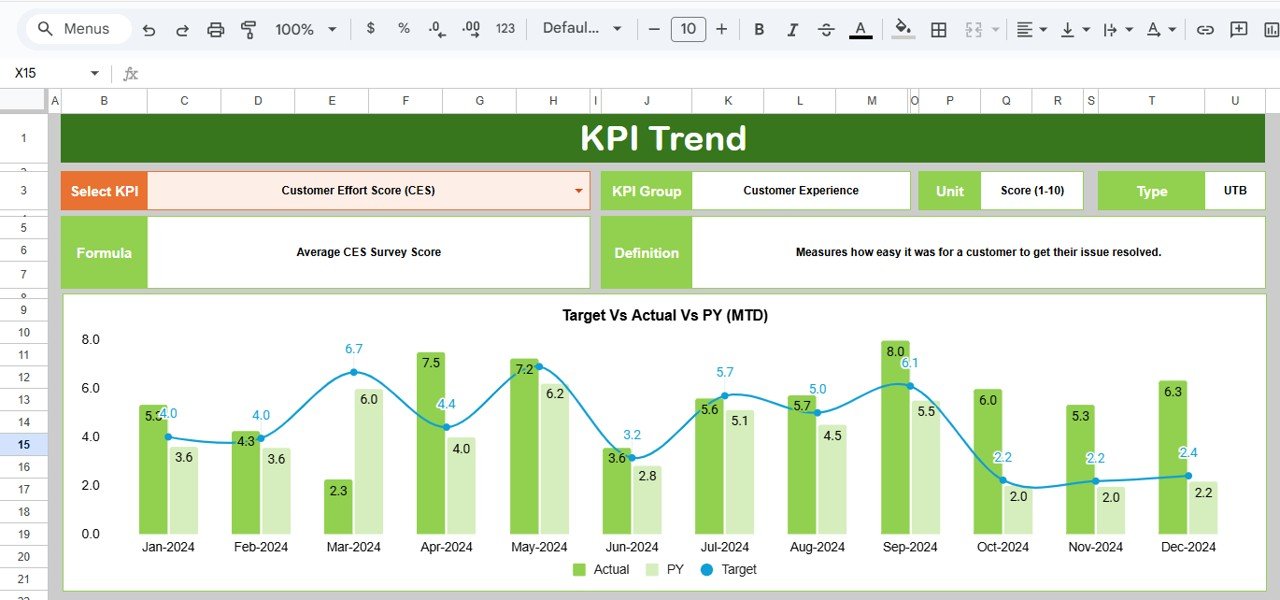
📈 2. KPI Trend Sheet Tab
This sheet enables deep KPI analysis.
-
Select a KPI from the dropdown in cell C3
-
View:
-
KPI Group
-
KPI Unit
-
KPI Type (LTB / UTB)
-
KPI Formula
-
KPI Definition
-
A month-wise trend chart helps identify bottlenecks, improvement patterns, and workload pressure points.
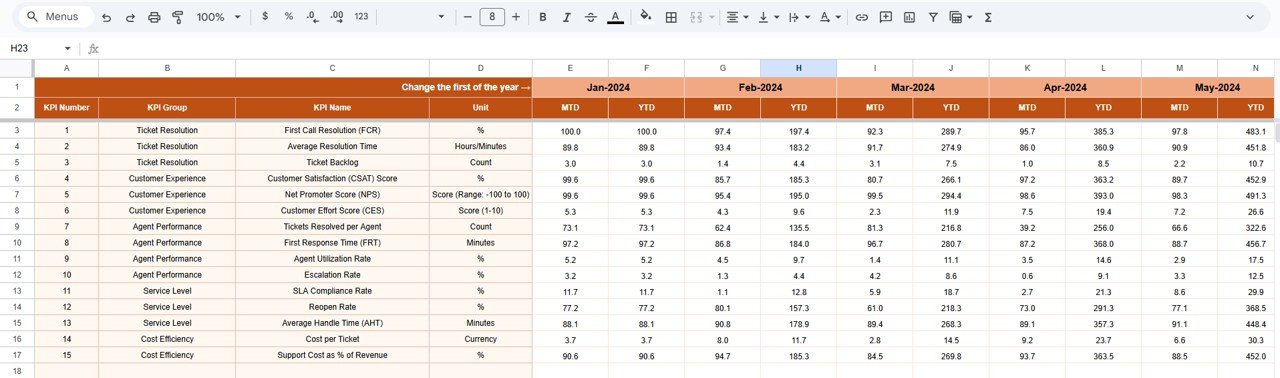
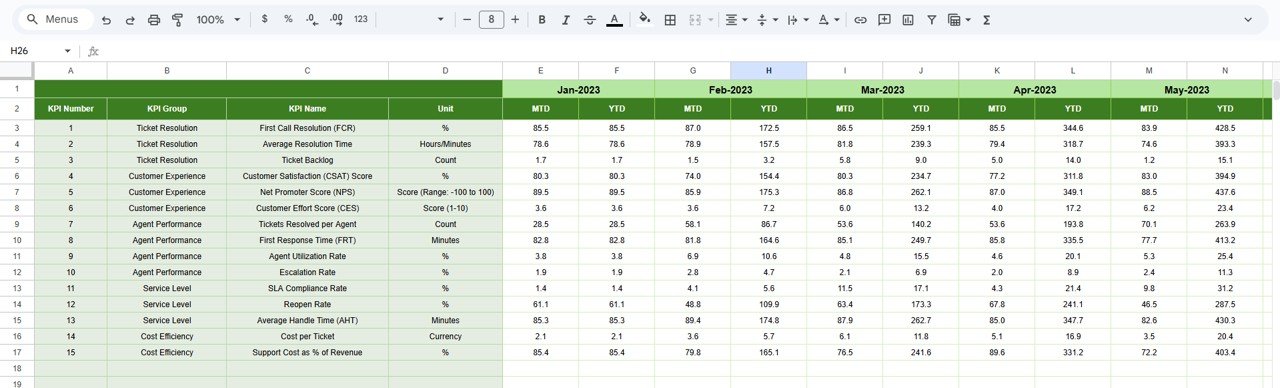
🧾 3. Actual Number Sheet Tab
This is where real performance data is entered.
-
MTD Actual values
-
YTD Actual values
-
Select first month of the year in cell E1
Once numbers are entered, all dashboards update automatically.
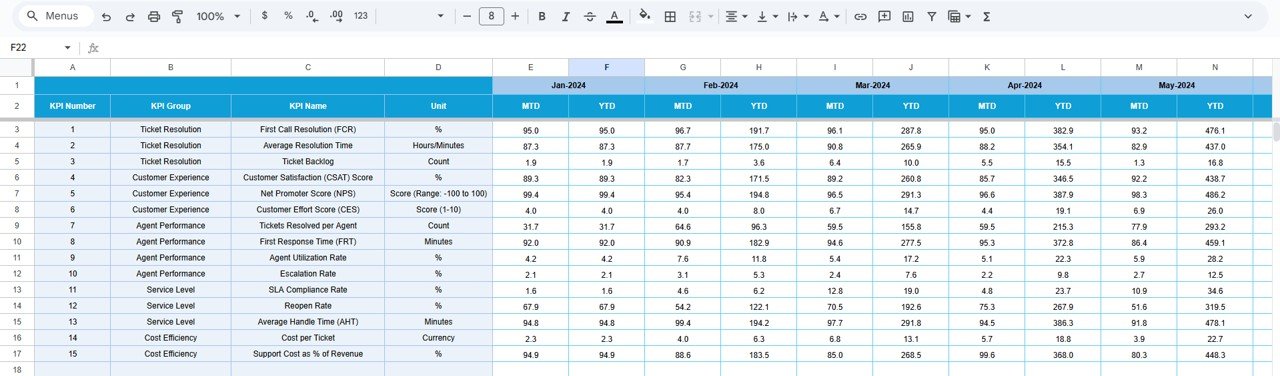
🎯 4. Target Sheet Tab
This sheet stores service benchmarks:
-
MTD Targets
-
YTD Targets
These targets help teams monitor SLA adherence and service goals effectively.
📅 5. Previous Year Number Sheet Tab
This sheet stores last year’s support metrics to enable:
-
Year-over-year performance comparison
-
Service maturity evaluation
-
Long-term improvement tracking
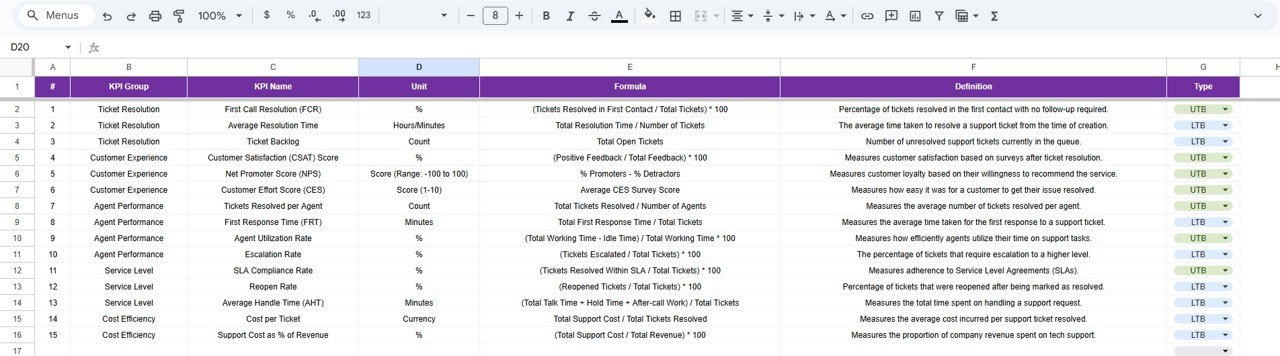
📘 6. KPI Definition Sheet Tab
This is the governance layer of the dashboard.
It contains:
-
KPI Name
-
KPI Group
-
Unit
-
Formula
-
Definition
-
KPI Type (Lower the Better / Upper the Better)
This ensures clarity, consistency, and alignment across teams.
🛠️ How to Use the Tech Support Efficiency KPI Dashboard
1️⃣ Enter actual performance data monthly
2️⃣ Maintain targets at the start of the year
3️⃣ Review dashboard KPIs regularly
4️⃣ Analyze trends using KPI Trend sheet
5️⃣ Compare current vs previous year performance
No training required—basic Google Sheets knowledge is enough.
👥 Who Can Benefit from This Dashboard
-
💻 IT Support & Helpdesk Teams
-
🧑💼 Service Delivery Managers
-
📞 Customer Support Operations
-
🏢 IT & Operations Leadership
-
📊 Managed Service Providers (MSPs)
Ideal for small teams, enterprises, and shared service centers.
✅ Why Organizations Choose This Dashboard
✔ Improved SLA compliance
✔ Faster issue identification
✔ Balanced workload across agents
✔ Better staffing decisions
✔ Increased customer satisfaction
✔ Zero software investment
🔧 Opportunities for Improvement
-
Integrate Zendesk, Jira, Freshdesk
-
Add severity-wise ticket tracking
-
SLA breach alerts
-
Predictive ticket volume trends
-
Channel-wise request analysis
✅ Best Practices
-
Update KPIs consistently
-
Review trends, not just monthly values
-
Set realistic SLA targets
-
Focus on first-contact resolution
-
Share insights with support agents
✅ Conclusion
The Tech Support Efficiency KPI Dashboard in Google Sheets empowers organizations to measure, monitor, and improve technical support performance with confidence. It transforms operational data into actionable insights while staying simple, flexible, and collaborative. With structured KPIs, automated calculations, and trend analysis, support teams improve efficiency, reduce costs, and deliver superior service experiences.
✅ Click here to read the Detailed blog post
Watch the step-by-step video tutorial:


Reviews
There are no reviews yet.