


Sustainability is no longer optional for modern organizations. Environmental responsibility, social impact, and governance transparency now sit at the core of business strategy. Companies track sustainability performance just as closely as financial results. However, when sustainability data stays scattered across reports, spreadsheets, and emails, insights become unclear and actions get delayed. That is exactly why the Sustainability Metrics KPI Dashboard in Google Sheets becomes an essential and practical solution.
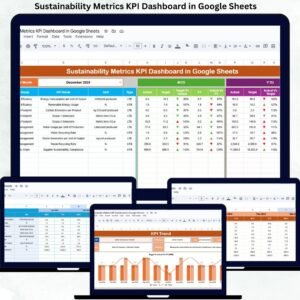
This ready-to-use dashboard helps organizations monitor key sustainability indicators in one centralized, structured, and visual system. Instead of manually compiling sustainability reports, teams can track performance using automated KPIs, MTD (Month-to-Date) and YTD (Year-to-Date) comparisons, trend analysis, and clear performance indicators. The dashboard supports ESG goals by making sustainability data measurable, comparable, and actionable.
Because the dashboard runs entirely in Google Sheets, it remains flexible, collaborative, cloud-based, and cost-effective—without the need for complex BI tools or software licenses.
✨ Key Features of the Sustainability Metrics KPI Dashboard in Google Sheets
📊 1. Centralized Sustainability KPI Monitoring
Track all sustainability KPIs—environmental, social, and governance—in one structured dashboard instead of multiple reports.
🎯 2. MTD & YTD Performance Tracking
Monitor Month-to-Date and Year-to-Date sustainability performance with automatic calculations.
📈 3. Target vs Actual & Previous Year Comparison
Compare actual sustainability results against targets and previous-year benchmarks to identify gaps early.
🚦 4. Visual Performance Indicators
Conditional formatting with arrows highlights performance instantly:
Green arrow → improvement
Red arrow → decline
☁️ 5. Google Sheets-Based Collaboration
Teams can update, review, and share sustainability metrics in real time from anywhere.
📦 What’s Inside the Sustainability Metrics KPI Dashboard in Google Sheets
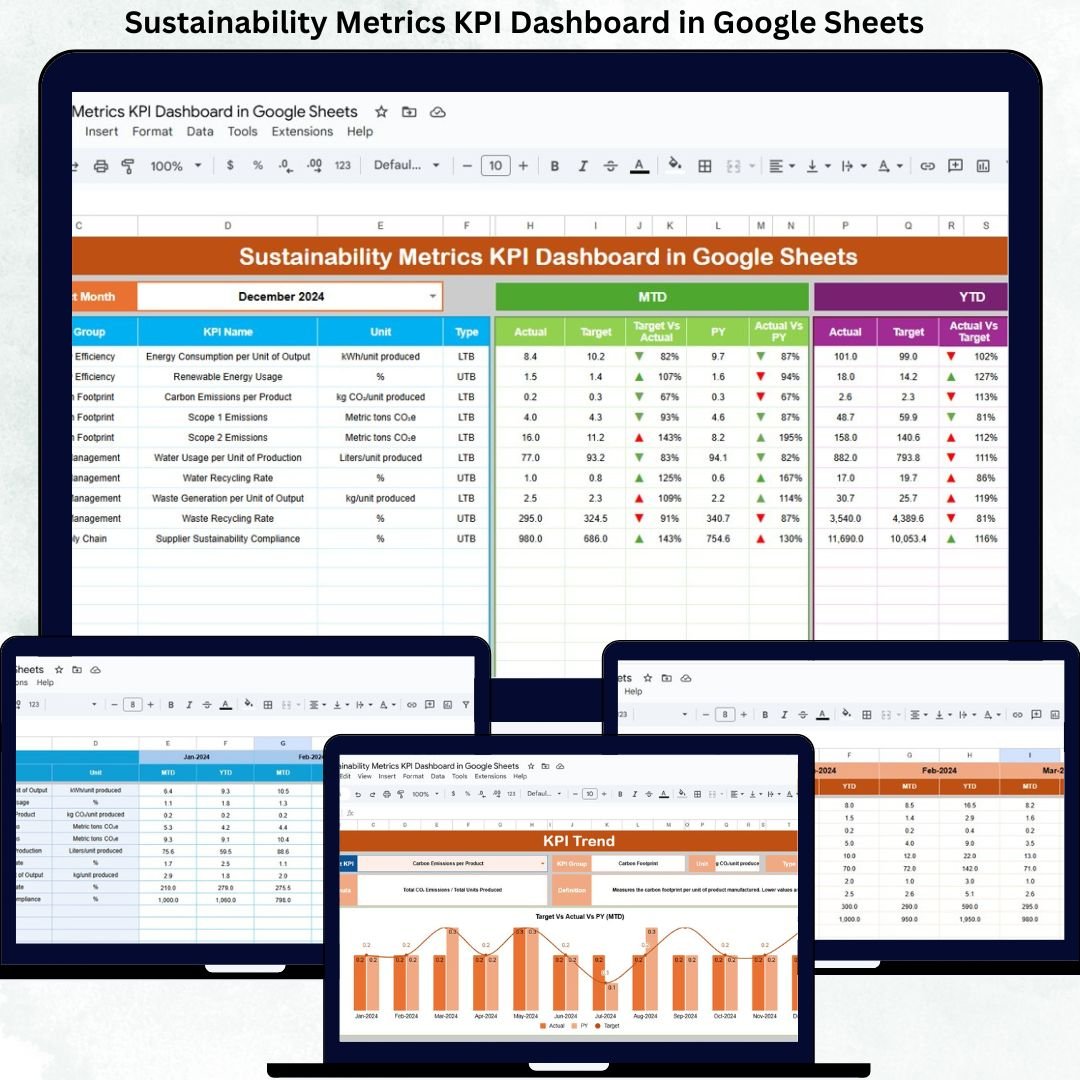
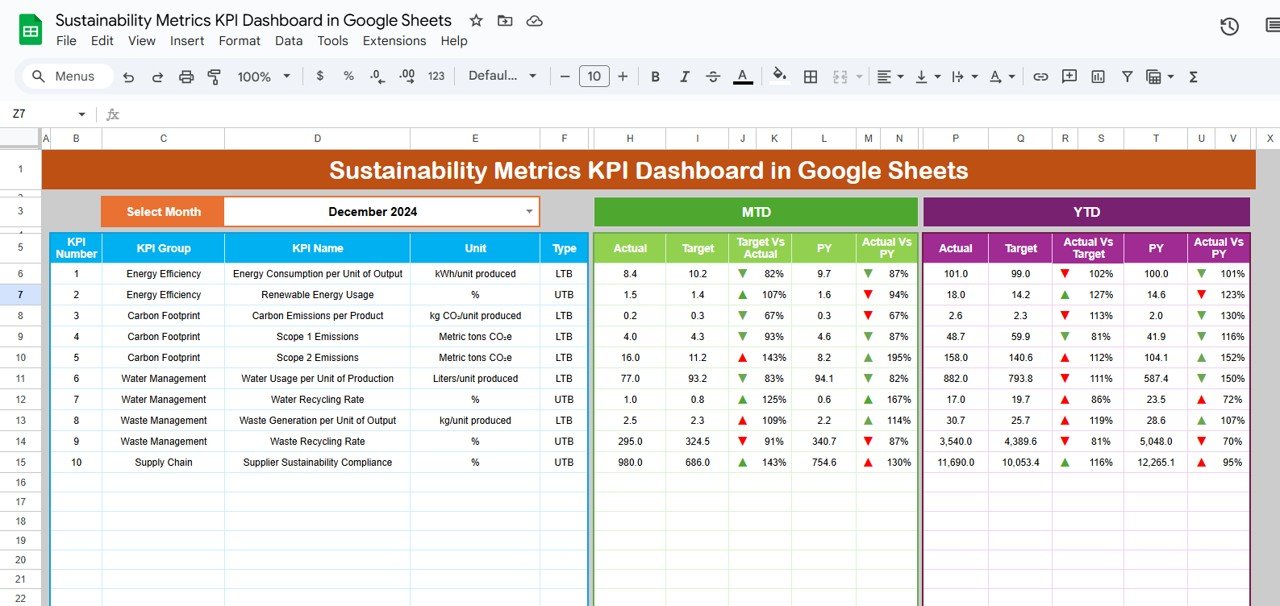
🖥️ Dashboard Sheet Tab (Main Page)
This is the main reporting view used for management and ESG reviews.
You select the reporting month from the dropdown in cell D3, and the entire dashboard updates automatically.
It displays:
MTD Metrics
Actual
Target
Previous Year
Target vs Actual
Previous Year vs Actual
YTD Metrics
Actual
Target
Previous Year
Target vs Actual
Previous Year vs Actual
This sheet provides instant visibility into sustainability progress and compliance status.
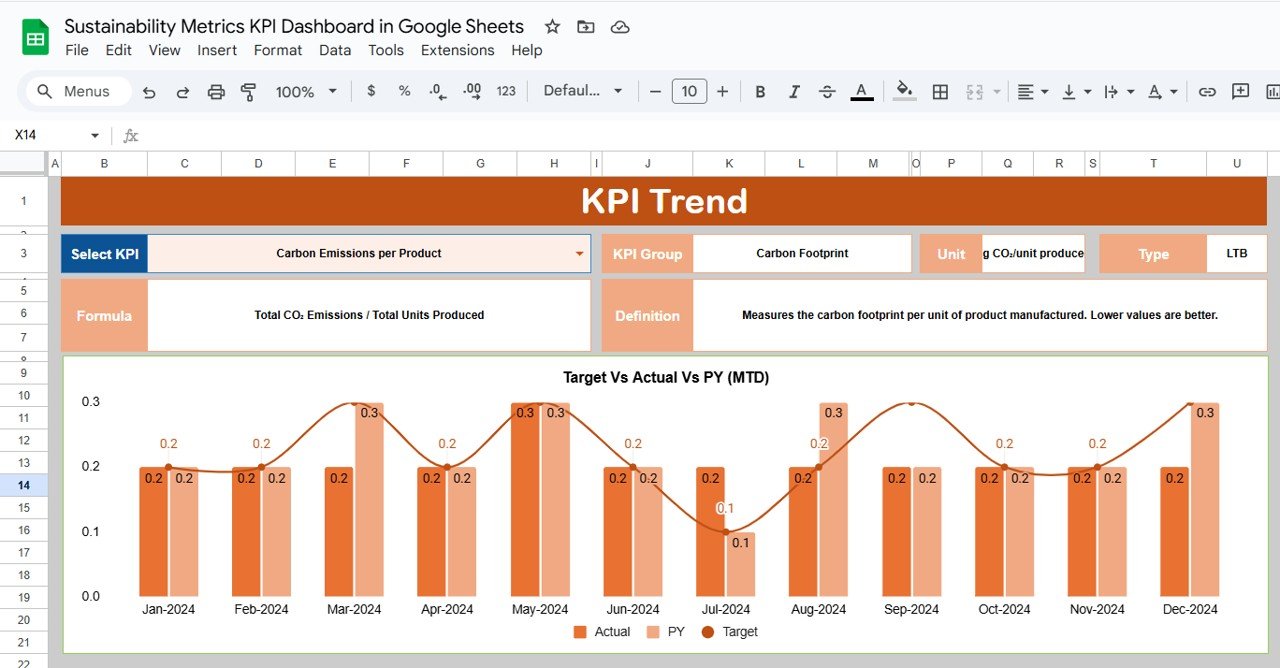
📉 KPI Trend Sheet Tab
This sheet supports detailed KPI-level analysis.
Select a KPI name from the dropdown in cell C3, and the sheet displays:
KPI Group
KPI Unit
KPI Type (Lower the Better / Upper the Better)
KPI Formula
KPI Definition
Month-wise trend charts help identify long-term patterns and improvement areas.
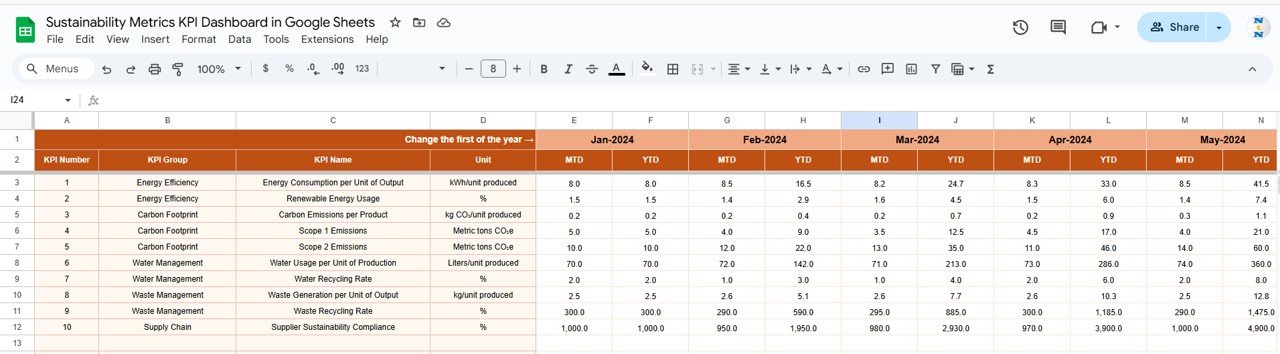
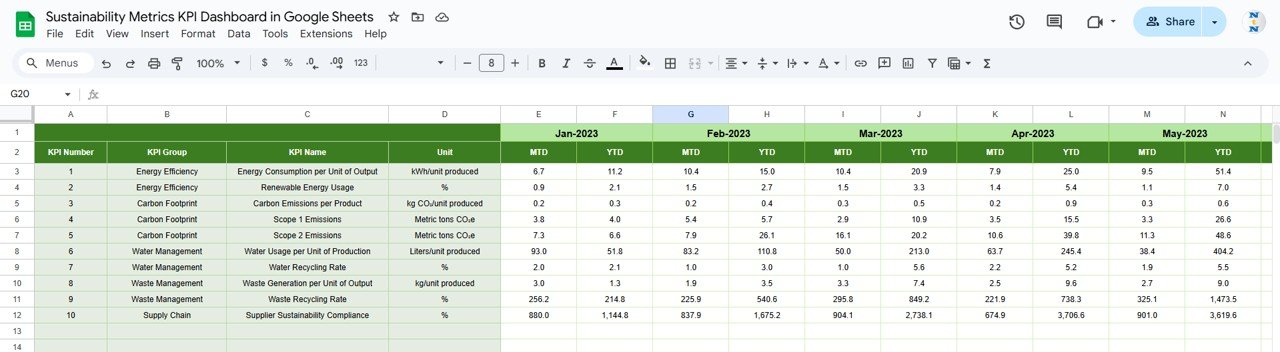
📋 Actual Number Sheet Tab
This sheet stores actual sustainability data.
Select the first month of the year in cell E1
Enter monthly MTD and YTD actual values
All dashboard visuals update automatically
This ensures consistency and accuracy in sustainability reporting.
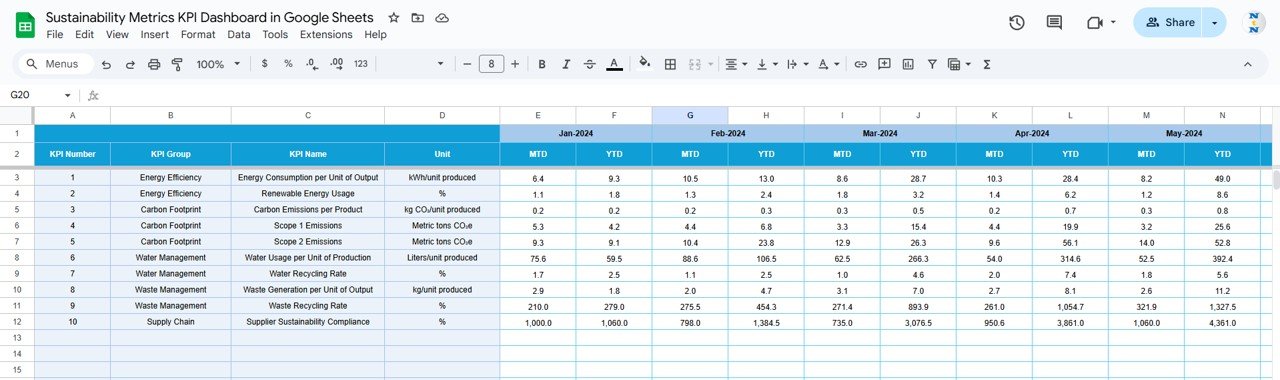
🎯 Target Sheet Tab
This sheet captures MTD and YTD targets for every sustainability KPI.
Targets help organizations:
Measure ESG commitments
Track progress toward sustainability goals
Align sustainability initiatives with strategy
📆 Previous Year Number Sheet Tab
This sheet stores last year’s sustainability KPI values.
It enables:
Year-over-Year performance comparison
Long-term sustainability trend analysis
Benchmarking against historical data
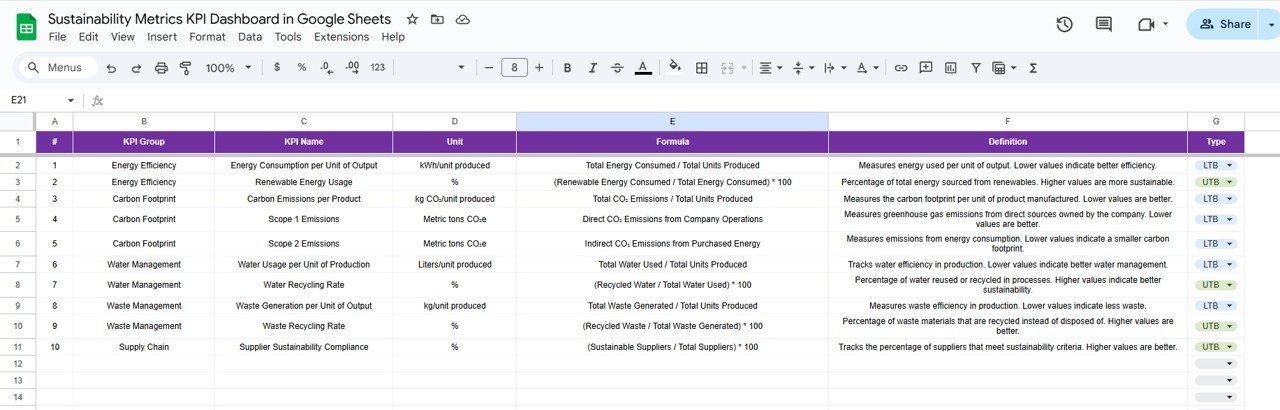
📘 KPI Definition Sheet Tab
This is the reference foundation of the dashboard. It includes:
KPI Name
KPI Group
Unit
Formula
KPI Definition
KPI Type (LTB / UTB)
It ensures transparency, consistency, and shared understanding across teams.
🛠️ How to Use the Sustainability Metrics KPI Dashboard
1️⃣ Define Sustainability KPIs
Customize KPI names, formulas, and types in the KPI Definition sheet.
2️⃣ Enter Actual Data Regularly
Update monthly sustainability data in the Actual Number sheet.
3️⃣ Set Clear Targets
Define realistic sustainability targets in the Target sheet.
4️⃣ Select Reporting Month
Use the dropdown to refresh all MTD and YTD calculations instantly.
5️⃣ Review Trends & Take Action
Use the KPI Trend sheet during ESG and sustainability reviews.
🎯 Who Can Benefit from This Dashboard
🌱 Sustainability & ESG Teams
Track environmental and social performance clearly.
🏭 Operations Teams
Monitor energy, water, waste, and efficiency metrics.
📊 Management & Leadership
Review sustainability performance without complex tools.
🏢 Compliance & Reporting Teams
Support ESG disclosures and sustainability audits.
🚀 Growing Organizations
Adopt a structured, scalable sustainability reporting framework.
### Click here to read the Detailed blog post
Watch the step-by-step video tutorial:


Reviews
There are no reviews yet.