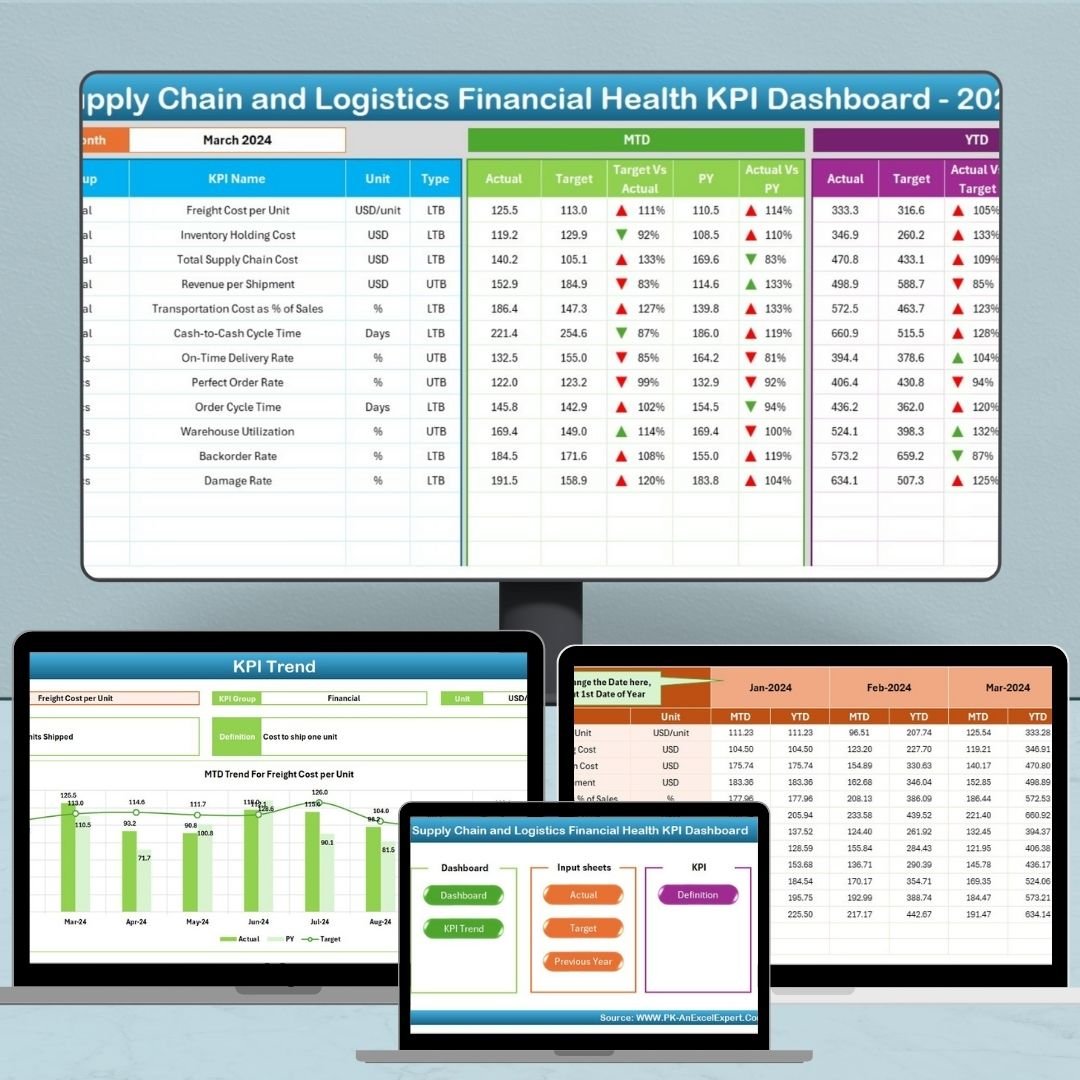

Managing supply chain and logistics without financial visibility is like navigating without a map. That’s why the Supply Chain and Logistics Financial Health KPI Dashboard in Excel is your ultimate solution for real-time monitoring, smart cost tracking, and goal alignment. Whether you’re managing transportation costs, warehouse operations, or logistics efficiency, this interactive Excel dashboard puts every key financial KPI at your fingertips—no expensive software required.
Built with slicers, trend visuals, and conditional formatting, it helps you track MTD and YTD performance, compare actuals vs. targets and previous year data, and make data-driven decisions with confidence.
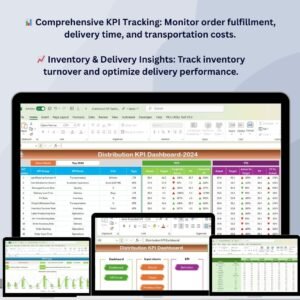
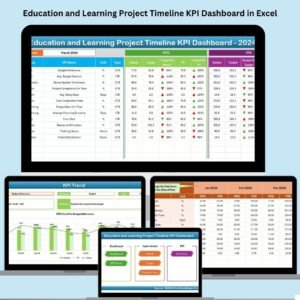
✨ Key Features of the Dashboard
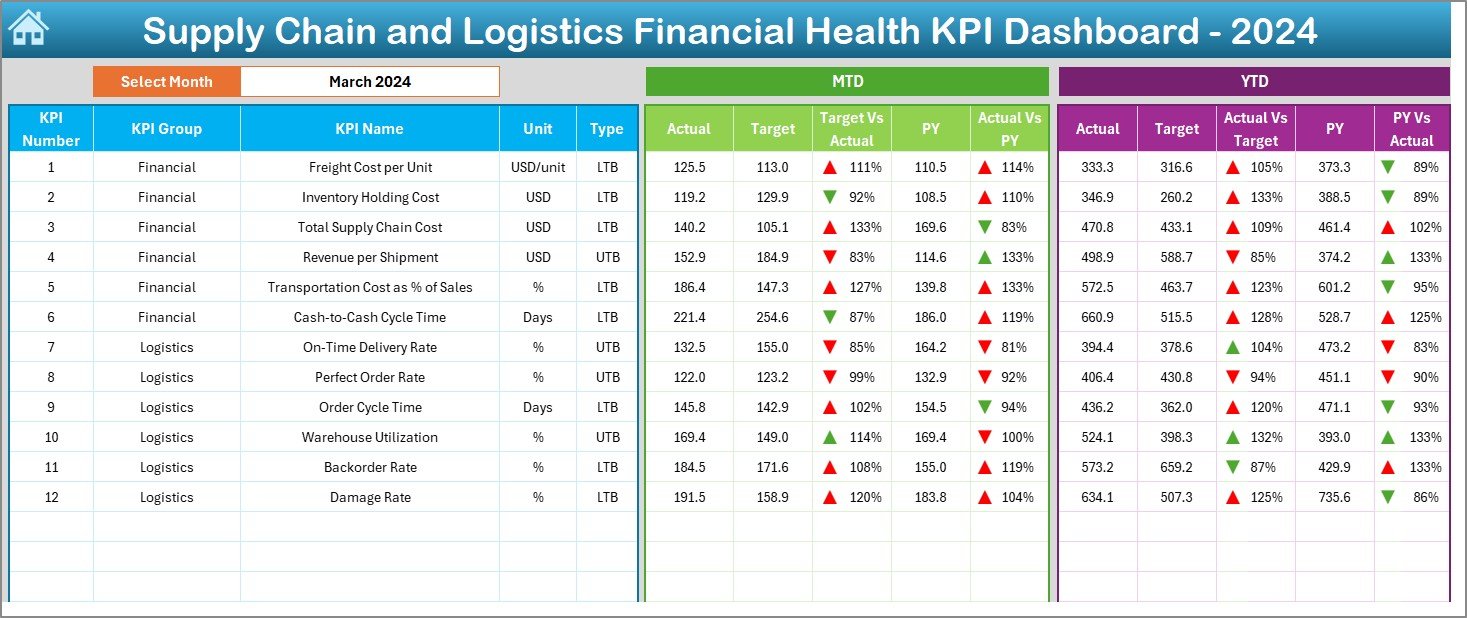
📋 Dynamic Dashboard Sheet
-
Month selector with instant filtering
-
Visuals for Actual vs. Target vs. PY
-
Up/down arrows indicate KPI progress
-
Real-time updates for MTD and YTD values
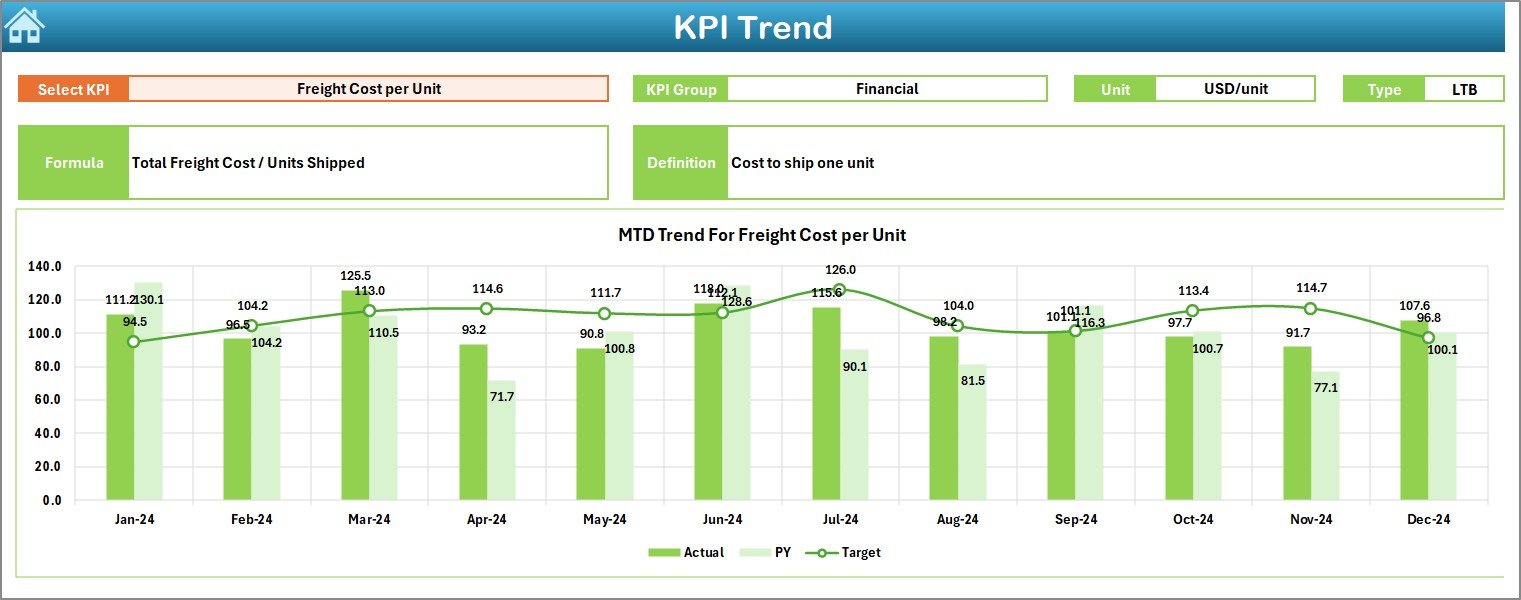
📈 KPI Trend Analysis Sheet
-
Select any KPI to view trend charts
-
Displays KPI group, unit, UTB/LTB status, formula & definition
-
Track improvements or drops across months
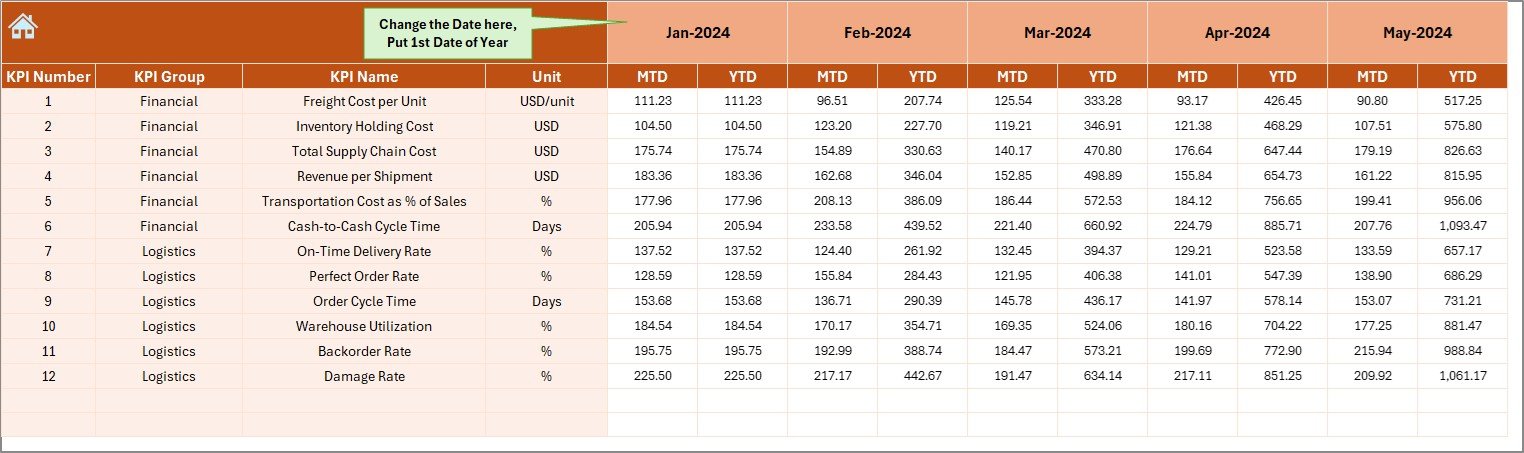
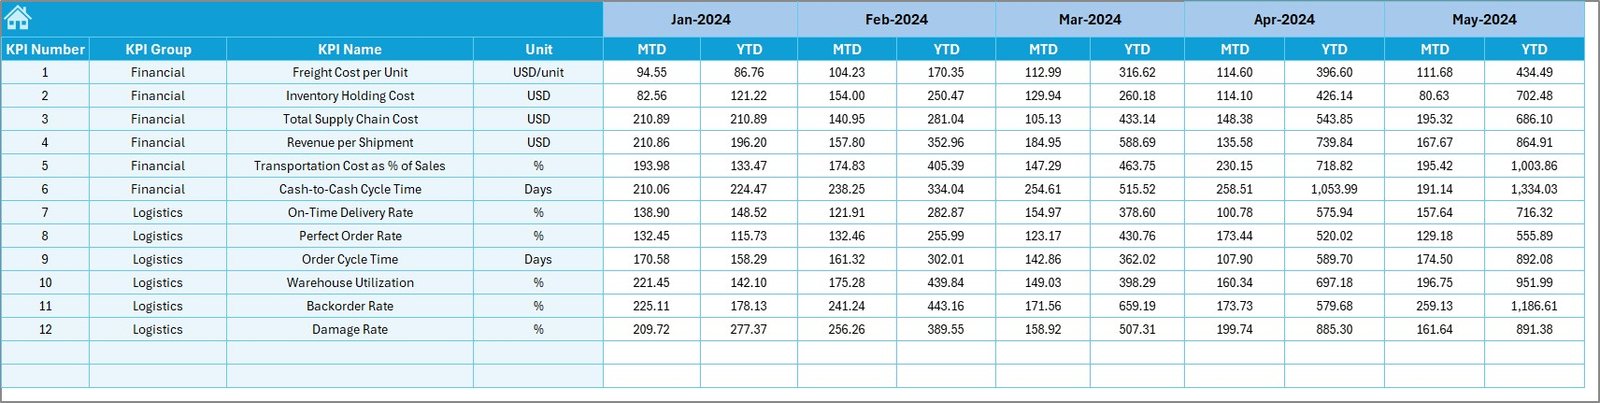
🧾 Structured Data Input Sheets
-
Actual Numbers Input – Enter monthly MTD/YTD actuals
-
Target Sheet – Set monthly targets for each KPI
-
Previous Year Sheet – Maintain historical benchmarks
-
Flexible start month setup
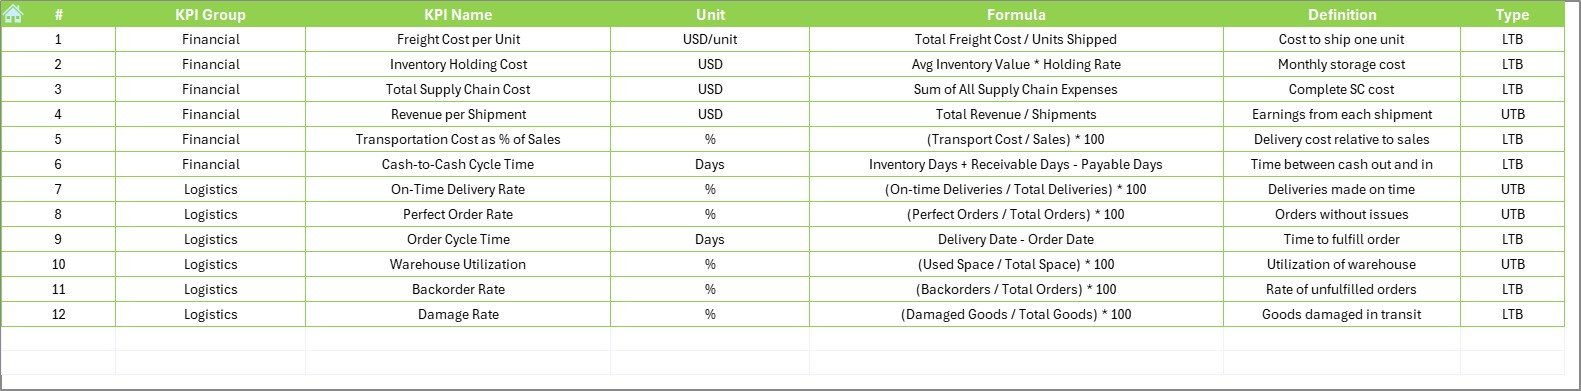
📚 KPI Definition Sheet
-
Define all metrics with unit, formula, group, and performance type
-
A perfect reference point for teams
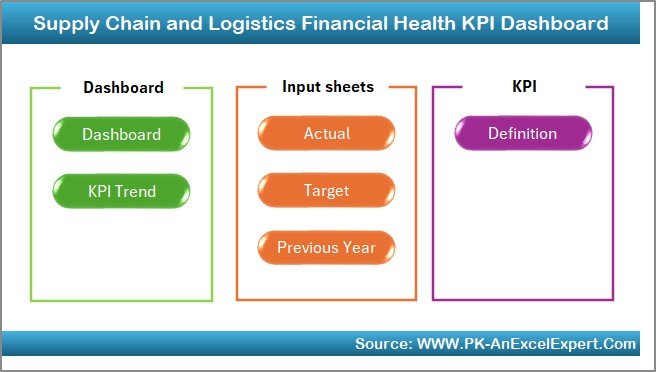
🏠 Home Sheet with Quick Navigation
-
Jump to any worksheet with a single click
-
Clean interface for easy access
📂 What’s Inside the Dashboard Package?
✔️ 7 Organized Excel Sheets
✔️ Built-in KPI Trend Charts
✔️ Conditional Formatting Icons
✔️ Target vs. Actual vs. Previous Year Comparison
✔️ Month Slicer and KPI Dropdowns
✔️ Sample KPIs and Definitions for Immediate Use
👥 Who Should Use This Dashboard?
🚚 Logistics Managers – Track freight, delivery, and warehouse costs
🏬 Retail Supply Chain Leads – Improve inventory turnover and reduce holding costs
📦 E-commerce Operations Teams – Manage order accuracy, shipping costs, and return handling
📈 Finance Teams – Align logistics with budget and cost-saving targets
🛒 Wholesalers & Distributors – Monitor region-wise transportation spend and warehouse utilization
💡 Most Popular KPIs You Can Track
📦 Freight Cost per Unit
📦 Inventory Holding Cost
📦 Delivery Cost per Order
📦 Logistics Cost as % of Sales
📦 Warehouse Utilization Rate
📦 Return Processing Cost
📦 On-Time Shipment Rate
📦 Order Accuracy Rate
📦 Transportation Spend by Region
📦 Cost per Shipment
Set each KPI as UTB (Upper the Better) or LTB (Lower the Better) based on your business strategy.
🔗 Click here to read the Detailed blog post
📺 Visit our YouTube channel to learn step-by-step video tutorials


Reviews
There are no reviews yet.